
Clustering of Emotional States under Different Task Difficulty Levels for
the Robot-assisted Rehabilitation system-RehabRoby
Yigit Can Aypar
1
, Yunus Palaska
1
, Ramazan Gokay
1
, Engin Masazade
1
, Duygun Erol Barkana
1
and Nilanjan Sarkar
2
1
Department of Electrical and Electronics Engineering, Yeditepe University, 34755, Istanbul, Turkey
2
Department of Mechanical Engineering, Vanderbilt University, Nashville, TN 37235, U.S.A.
Keywords:
Robot-assisted Rehabilitation System, Biofeedback Sensors, Unsupervised Learning.
Abstract:
In this paper, we study an unsupervised learning problem where the aim is to cluster the emotional state (ex-
citedness, boredom, or stress) using the biofeedback sensor data while subjects perform tasks under different
difficulty levels on the robot assisted rehabilitation system-RehabRoby. The dimension of the training vectors
has been reduced by using the Principal Component Analysis (PCA) algorithm after collecting the biofeedback
sensor measurements from different subjects under different task difficulty levels to better visualize the sensor
data. The reduced dimension vectors are fed into a K-means clustering algorithm. Numerical results have been
given to demonstrate that for each training vector, the emotional state decided by the clustering algorithm is
consistent with the subjects declaration of his/her emotional state obtained via surveys after performing the
task.
1 INTRODUCTION
Robot-assisted rehabilitation systems were first used
in large scaled clinical tests in 1998 and since then
several robot-aided rehabilitation systems have been
developed. There are two kinds of robot-assisted re-
habilitation systems for the upper extremities in terms
of mechanical design, which are end-effector-based,
and exoskeleton type rehabilitation robots. MIT-
MANUS (Krebs et al., 2004), MIME (Lum et al.,
2006), GENTLE/S (Loureiro et al., 2003) and NeRe-
Bot are end-effector-based, and ARMin (Nef et al.,
2009), CADEN-7 (Perry et al., 2007), RUPERT IV
(Balasubramanian et al., 2008), WREX (Rahman
et al., 2006), SRE (Caldwell et al., 2007), RehabExos
(Vertechy et al., 2009), ExoRob (Rahman et al.,
2009), SUEFUL-7 (Kiguchi et al., 2008), IntelliArm
(Ren et al., 2009) are exoskeleton type robot-assisted
rehabilitation systems. Exoskeleton type robots re-
semble the anatomy of the human arm and each of
the robot’s joints can be controlled separately, which
reduces the control complexity. Recently, we have de-
veloped an exoskeleton type upper-extremity robot-
assisted rehabilitation system, which is called Re-
habRoby (Ozkul et al., 2012), (Ozkul and Barkana,
2013). Robot-assisted rehabilitation systems have
shown to be helpful in neuromotor rehabilitation be-
cause it is possible to deliver interactive and repeat-
able sensorimotor exercise, and monitor the actual
performance continuously. However, to obtain opti-
mal performance from such exercises, the task dif-
ficulty needs to be appropriately challenging. Note
that a rehabilitation task that is too easy or under chal-
lenging can be perceived as boring, while a task that
is too challenging can be frustrating. An optimally
challenging rehabilitation task can motivate and cause
maximum mental engagement for the patients (No-
vak et al., 2012). Mental engagement of patients have
shown to be a key factor to improve the outcome of
the rehabilitation (Maclean and Pound, 2000). Mo-
tor learning theory states that learning rate increases
when the rehabilitation task challenges and excites the
subjects (Guadagnoli and Lee, 2004). Thus, it is im-
portant that a robot- assisted rehabilitation system aid-
ing in rehabilitation tasks should be capable of detect-
ing that patient is either becoming bored or frustrated,
and then modifying the rehabilitation task to better
suit the patient’s abilities.
A recent survey paper presents the current state
of the art and the new challenges in automatic,
dimensional and continuous analysis and synthesis
of human emotional behavior (Gunes et al., 2011).
34
Aypar Y., Palaska Y., Gokay R., Masazade E., Erol Barkana D. and Sarkar N..
Clustering of Emotional States under Different Task Difficulty Levels for the Robot-assisted Rehabilitation system-RehabRoby.
DOI: 10.5220/0005052600340041
In Proceedings of the 11th International Conference on Informatics in Control, Automation and Robotics (ICINCO-2014), pages 34-41
ISBN: 978-989-758-039-0
Copyright
c
2014 SCITEPRESS (Science and Technology Publications, Lda.)

The most commonly employed strategy in auto-
matic dimensional emotional state detection is the
2D valence-arousal (V-A) emotion model (Russell,
1989). Various difficulty levels of a rehabilitation task
has previously been defined according to the circum-
plex model of affect (Koenig et al., 2011b), (Koenig
et al., 2011a). Emotional state may become apparent
by subjective experiences (how the person feels), in-
ternal/inward expressions (psychophysiological mea-
surements) and external/outward expressions (audio/
visual signals) (Gunes et al., 2011). The great chal-
lenge of psychophysiological measurements is the
abundance of available data, and the hundreds of
features that can be extracted by considering all the
physiological responses. Psychophysiological mea-
surements such as heart and muscle activity, brain
activity, blood pressure, skin temperature, respira-
tion, are multichannel recordings from both the cen-
tral nervous system (CNS), and the autonomic ner-
vous systems (ANS). These measurements are all rich
sources of information concerning the physiological
responses of the human body. The transition from
one emotional state to another, for instance, from state
of boredom to state of anxiety is accompanied by
dynamic shifts in indicators of ANS activity. Fur-
thermore, it has previously been mentioned that the
signals from the autonomic nervous system (ANS)
can indicate mental engagement (Filipovic and An-
dreassi, 2001). Changes in psychophysiological mea-
surements can be used to assess mood and engage-
ment, and to understand emotions of people in a va-
riety of applications (Mandryk and Atkins, 2007),
(Rani et al., 2003b), (Rani et al., 2003a). Psychophys-
iological measurements can also be used to under-
stand emotions of patients during the execution of a
rehabilitation task using a robotic system. Heart rate,
skin conductance responses, and skin temperature
have previously been used to estimate and classify
a patient’s psychological state during robot-assisted
gait rehabilitation (Koenig et al., 2011b), (Koenig
et al., 2011a).The biofeedback sensors can be used
to measure the emotions. In this study, we use skin
conductance, electrocardiography (ECG), tempera-
ture, blood volume pulse (BVP) and respiratory rate
biofeedback sensors to detect if the subject has been
bored, overstressed or excited (emotional states) dur-
ing the execution of a rehabilitation task.
Since the raw data from the biofeedback sensors
are inadequate, several features from the raw sen-
sor data have previously been defined to classify the
emotion states (Koenig et al., 2011b), (Koenig et al.,
2011a). Note that proper feature selection from the
sensory data determines the accuracy of the emo-
tional state classification. The Pulse Transit Time
(PTT) and Heart Rate Variability (HRV) have previ-
ously been used as feature for Electrocardiography
(ECG), and delta(1-3Hz), theta(4-7Hz), alpha1(8-
9Hz), alpha2(10-12Hz), beta1(13-17Hz), beta2(18-
30Hz), gamma1(31-40Hz), gamma2(41-50Hz) have
been used as features for Electroencephalography
(EEG) sensor (Kandemir, 2013). High frequency
components, standard deviation, standard deviation
of coefficients of Daubechie transform (3th and 4th)
and mean of the peak values of ECG signal have pre-
viously been used as features to detect the excite-
ment, anxiety, boredom, frustration and anger (Rani
et al., 2007). Mean values derived for phasic and
tonic components of raw skin conductance data, am-
plitude of hurbis, mean and median frequency of hur-
bis, and standard deviation of raw EMG and mean,
power spectrum density and slope of skin temper-
ature have also been used as features to detect the
emotions (Rani et al., 2007). In this study, we use
the features heart rate(HR), HR mean(beat/min), in-
terbeat interval(IBI), pulse transit time(with BVP)
(PTT(ms)), very low frequency(VLF) power(%),
low frequency(LF) power(%), high frequency(HF)
power(%), total VLF power, total LF power, total
HF power, and HR standard deviation (from ECG);
time between two successive beats of the heart (IBI)
(from BVP); skin conductance value(%), mean of
skin conductance value(uS), and percentage of mean
of the skin conductance level (from skin conduc-
tance); mean of the temperature (deg), percentage of
the mean of the temperature, and percentage value
of temperature (from temperature sensor), and respi-
ration rate(br/min) (from the respiratory rate) to de-
tect the emotional states (boredom, stress and excite-
ment).
In this paper, an unsupervised learning problem
has been considered. The biofeedback signals from
different subjects under different difficulty levels have
been collected. The aim is to distinguish the emo-
tional state of the subjects while performing a re-
habilitation task with a robot-assisted rehabilitation
system-RehabRoby. The emotional states that we
want to classify are excitedness, boredom, and over-
stress. Correct classification of the emotional state is
an important step for the later steps of the rehabilita-
tion task. As an example, if it is determined that the
subject is bored, the difficulty level of the task can be
very easy for the subject, and the difficulty level may
need to be increased. If, on the other hand, it is de-
termined that the subject is excited, we can deduce
that the task difficulty level is optimal for the subject.
Finally, if the subject is found to be stressed, the dif-
ficulty level of the task can be very challenging for
the subject and the difficulty level may need to be de-
ClusteringofEmotionalStatesunderDifferentTaskDifficultyLevelsfortheRobot-assistedRehabilitation
system-RehabRoby
35

creased (Koenig et al., 2011b).The emotional states
can be classified solely based on the survey results af-
ter performing the task but the subjects may not be
sure about their feelings, may not want to reveal their
feelings or may declare a misleading answer (Novak
et al., 2012). Therefore, emotional state classification
based on biofeedback sensor data may depend on the
surveys. On the other hand, survey results can still
be used to determine the accuracy of the classifica-
tion algorithm (Koenig et al., 2011b). The output of
the classification algorithm can be further used in the
later steps of the rehabilitation task. In this paper, af-
ter collecting biofeedback signals from subjects, we
develop a clustering problem by using principal com-
ponent analysis (PCA) and K-means clustering algo-
rithms (Bishop, 2006) to obtain the clusters related
with each emotional state. The training vectors re-
lated to each emotional state is then compared with
the survey results to test the accuracy of the cluster-
ing algorithm.
The rest of this paper is organized as follows, in
Section II, we present our materials, experiments and
unsupervised learning methods. In Section III, we
present our numerical results. In Section IV, we con-
clude our work and address future research directions.
2 MATERIALS AND METHODS
In this section, we present the details of the hardware
properties of the robot-assisted rehabilitation system,
RehabRoby, the task, and the unsupervised learning
method used for classification of the emotional states.
2.1 Hardware
In this study, an exoskeleton type upper-extremity
robot-assisted rehabilitation system, which is called
RehabRoby, has been used (Fig. 1). RehabRoby has
been designed in such a way that i) it can implement
passive mode therapy, active-assisted mode therapy
and resistive mode therapy, ii) it can be easily adjusted
for people of different heights and with different arm
lengths, and iii) it can be used for both right and left
arm rehabilitation. RehabRoby is designed to pro-
vide extension, flexion, abduction, adduction, rota-
tion, pronation and supination upper-extremity move-
ments and the combinations of these movements that
are necessary for the tasks and activities of daily liv-
ing. An arm splint, which has humeral and forearm
thermoplastic supports with Velcro straps and a sin-
gle axis free elbow joint, has been designed and at-
tached to RehabRoby (Figure1). The thermoplastic
arm splint designed for the RehabRoby has humeral
and forearm supports with Velcro straps, and a ther-
moplastic inner layer that is covered by a soft material
(Plastazote). Two force sensors (Kistler - 9313AA1;
Kistler France, Les Ulis, France) are placed in the in-
ner surface of the plate attached dorsally to the fore-
arm splint (Figure1). One of the force sensors mea-
sures the force applied during the elbow flexion move-
ment and the other measures the force applied during
the shoulder flexion movement. Ensuring the safety
of the subject is a critical issue for a robot-assisted
rehabilitation system. Thus, in the event of an emer-
gency situation, the therapist can press an emergency
button to stop the RehabRoby (Figure1), and the mo-
tor drivers of RehabRoby are disabled separately or
together by pressing the driver enable/disable buttons
without turning off RehabRoby. The system is pow-
ered by an uninterruptible power supply, thus, there
can be no power loss and RehabRoby will not col-
lapse at any time.
Figure 1: Robot-Assisted Rehabilitation System-
RehabRoby.
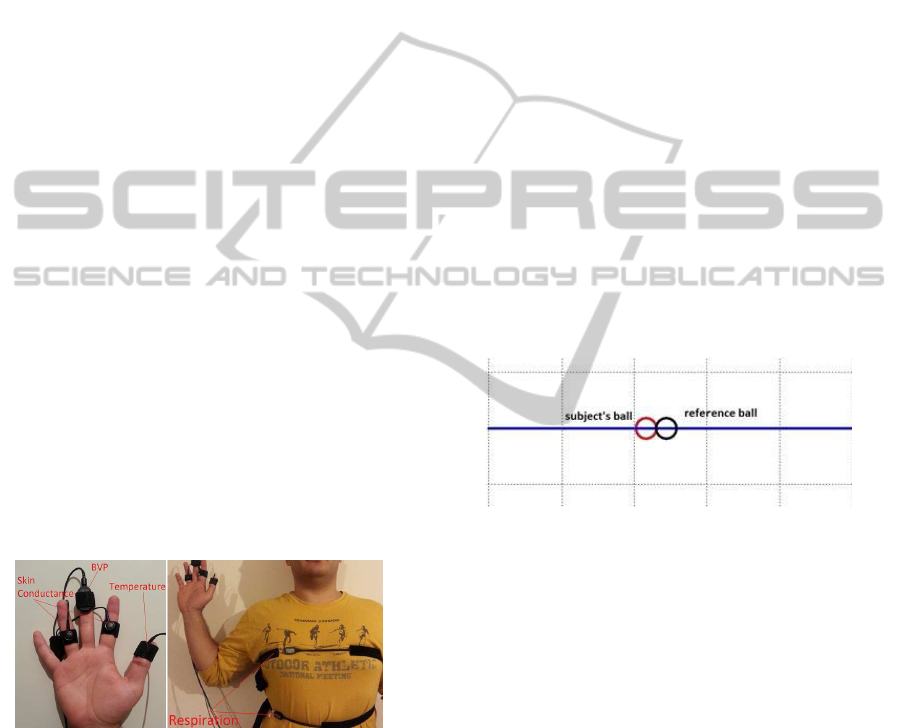
In this study, skin conductance, electrocardiogra-
phy (ECG), temperature, blood volume pulse (BVP)
and respiratory rate from Thought Technology Ltd
have been used for biofeedback sensory information
to detect three emotion states boredom, overstressed
and excited. Physiological signals have been sam-
pled at 256Hz using Procomp Infinite Encoder. Skin
conductance has been measured using skin conduc-
tance sensor (sc-flex pro) (Figure 2-left). The elec-
trodes have been placed on the middle phalanx of
index finger and ring finger. There are three ECG
electrodes used for the measurement. Two of them
are placed where the Deltoid anterior heads and Pec-
toralis major muscles intersect, several centimeters
below the clavical. The third ECG electrode is placed
near the xiphoid. Temperature has been recorded us-
ing a skin type sensor that is placed on the finger tip of
the thumb (Figure2-left). Blood volume pulse (BVP)
has been recorded using BVP-Pro flex sensor that is
placed on the finger tip of the middle finger (Figure 2-
left). Respiration sensors (resp-flex pro), which have
been placed around abdomen and the chest, have been
ICINCO2014-11thInternationalConferenceonInformaticsinControl,AutomationandRobotics
36
used to record the respiratory rate (Figure 2-right).
Skin conductance, temperature and respiratory rate
signals have been sampled at 256Hz and ECG and
BVP have been sampled at 2048Hz. The features
derived from the signals of these sensors have been
downsampled to 32Hz for learning algorithm because
of the hardware limitations of the computer.
BioGraph Infinity is the interface software pro-
vided by Thought Technology Ltd to get both raw
sensor data and the features from the raw data.
19 features from the skin conductance, electrocar-
diography (ECG), temperature, blood volume pulse
(BVP) and respiratory rate sensory data have been
selected for this study. The physiological sig-
nals we examined were: various features of ECG,
including heart rate(HR), HR mean(beat/min), in-
terbeat interval(IBI), pulse transit time(with BVP)
(PTT(ms)), very low frequency(VLF) power(%),
low frequency(LF) power(%), high frequency(HF)
power(%), total VLF power, total LF power, total
HF power, and HR standard deviation; time between
two successive beats of the heart (IBI) (from BVP);
skin conductance value(%), mean of skin conduc-
tance value(uS), and percentage of mean of the skin
conductance level (from skin conductance); mean
of the temperature (deg), percentage of the mean
of the temperature, and percentage value of tem-
perature (from temperature sensor), and respiration
rate(br/min) (from the respiratory rate). These signals
were selected because they i) were shown to capture
important information about the underlying targeted
emotion states, (ii) could be measured non-invasively;
and iii) were relatively resistant to movement arti-
facts.
Figure 2: Sensor Placement on Subjects.
2.2 Task
A well-known rehabilitation tasks has been selected
in consultation with therapists at Yeditepe Univer-
sity’s Physiotherapy and Rehabilitation Department.
The task is the elbow flexion and extension movement
(i.e., reaching up to the chest button up). Each task
takes one minute. Subjects are seated in the chair,
and their arms are placed in the splint and tightly se-
cured with Velcro straps (Figure1). The height of the
RehabRoby can be adjusted for each subject so that
they would start the task in the same arm configura-
tion. Initially, the subject’s shoulder is positioned at
an extension of 90
◦
, the elbow is it the neutral posi-
tion, the lower arm is at a pronation of 90
◦
, and the
hand and the wrist are free at the neutral position. A
computer monitor has been placed in front of the sub-
ject to provide visual feedback about his/her motion
trajectory during the execution of the task.
The subject is asked to catch a ball that is dis-
played on the computer monitor (Figure3). Black
ball demonstrates the reference trajectory and red ball
demonstrates the subject’s movement. Subjects are
expected to perform the same task with five different
difficulty levels following resting period. The differ-
ent difficulty level is defined by changing the number
of repeated flexion and extension movement in a cer-
tain amount of time. For example, the subject is asked
to flex and extend his/her arm 5 times in 4 minutes
for the first difficulty level and 25 times for the fifth
difficulty level. Thus, the angular speeds of these five
different levels are 2.5
◦
/s,5
◦
/s,7.5
◦
/s,10
◦
/s and 12.5
◦
/s
consideringthe repetition numbers. The reference tra-
jectories for each difficulty level are computed using
minimum-jerk trajectory.
Figure 3: The Reference Trajectory and the Subject’s Move-
ment.
2.3 Experiment Procedure
Initially, the biofeedback sensors were placed on
the subject as shown in (Figure 2). Then sub-
ject was asked to track the black ball as shown
in (Figure3) for all 5 different angular velocities
(2.5
◦
/s,5
◦
/s,7.5
◦
/s,10
◦
/s and 12.5
◦
/s). Subjects were
asked to complete The Self-Assessment Manikin
(SAM) survey, which has previously been used to
measure emotional responses (Bradley and Lang,
1994). We also used SAM to verify the difficulty lev-
els of the task really resulted in feelings of boredom,
stress and excitement.
2.4 Classification Method
In unsupervised learning, we have m training vec-
tors x
1
, x
2
, . . . , x
m
to be clustered where a training
vector i (i ∈ {1, 2, . . . , m}), x
i
has n features. Then,
ClusteringofEmotionalStatesunderDifferentTaskDifficultyLevelsfortheRobot-assistedRehabilitation
system-RehabRoby
37

x
i
, [x
i
1
, x
i
2
, . . . , x
i
n
]
T
where T is the transpose opera-
tor.
The elements of each training vector is obtained from,
• x
i
1
, IBI from BVP: Used to compute the time be-
tween beats (period) from a BVP signal (Average
of every 15 samples).
• x
i
2
, Heart Rate(HR) from IBI: Number of heart
beats during a one minute period(from bvp sen-
sor) (Average of every 15 samples).
• x
i
3
, ECG VLF power(%): Percentage of very low
frequency power (Average of every 285 samples).
• x
i
4
, ECG LF power(%):Percentage of low fre-
quency power (Average of every 285 samples).
• x
i
5
, ECG HF power(%):Percentage of high fre-
quency power (Average of every 285 samples).
• x
i
6
, ECG VLF power(total): Very low frequency
components of total power (Average of every 285
samples).
• x
i
7
, ECG LF power(total): Low frequency compo-
nents of total power (Average of every 285 sam-
ples).
• x
i
8
, ECG HF power(total): High frequency com-
ponentsof total power(Averageof every 285 sam-
ples).
• x
i
9
, Skin Conductance value(%): Percentage value
of skin conductance (Average of every 400 sam-
ples).
• x
i
10
, Temperature value(%): Percentage value of
temperature (Average of every 400 samples).
• x
i
11
, ECG Heart Rate(HR) Mean:Mean of number
of heart beats during a one minute period(from
ecg sensor) (Average of every 380 samples).
• x
i
12
, ECG HR standart deviation: Standard devia-
tion of heart rate (Average of every 380 samples).
• x
i
13
, Skin Conductance mean:Mean of skin con-
ductance value(uS) (Average of every 400 sam-
ples).
• x
i
14
, Skin Conductance mean(%): Percentage of
mean of the skin conductance level (Average of
every 400 samples).
• x
i
15
, Temperature mean: Mean of the temperature
(Deg) (Average of every 400 samples)
• x
i
16
, Temperature mean(%):Percentage of the
mean of the temperature (Average of every 400
samples).
• x
i
17
, Respiration Rate: Number of the breaths dur-
ing a one minute period (Average of every 380
samples).
• x
i
18
, ECG IBI NN Intervals: Inter-beat interval be-
tween nearest neighbor beats (Average of every
380 samples).
• x
i
19
, Pulse Transit Time (PTT): Time it takes fort
he blood pumped by heart to reach arteries in the
arms (Average of every 15 samples).
In our experiments, we have m = 798 training vec-
tor which are obtained under 5 difficulty levels and
one resting period as explained in Section 2.2. Then
each training vector reflects the emotional state for
1.8 seconds. We ask the subject to express his/her
the emotional feelings after each 4 minute task exe-
cutions. Then SAM surveys are used to validate the
classification results.
2.4.1 Principal Component Analysis (PCA)
Dimensionality reduction is a useful step for visual-
izing and processing high-dimensional data as in this
problem. In order to visualize the biofeedback sen-
sor data under different emotional state, the 19 di-
mensional training vector needs to be converted in
2-dimensional or 3-dimensional vectors. Principal
Component Analysis (PCA) (Bishop, 2006) is a very
useful dimensionality reduction method to convert
high dimensional data into lower dimensions while
still keeping as much as the variations of the original
data. In this paper, using the PCA method, the n = 19
dimensional biofeedback sensor data is mapped into
k = 2 dimensional data as follows (Ng, 2014):
• Initialize the training vectors x
1
, x
2
, . . . , x
m
• Feature scaling/mean normalization
µ
j
=
1
m
∑
m
i=1
x
i
j
and s
j
=
q
1
m
∑
m
i=1
(x
i
j
− µ
j
)
2
• Replace x
i
j
with
x
i
j
−µ
j
s
j
.
• Compute the covariance matrix
Σ =
1
m
m
∑
i=1
x
i
(x
i
)
T
.
• Compute the eigenvectors of Σ using singular
value decomposition.
• Pick the first k eigenvectors of Σ to create the ma-
trix U of size k× n.
• Multiply each training vector x
i
with U. So the
reduced dimension training vector is obtained as
z
i
= Ux
i
which has dimension k × 1.
2.4.2 K-means Clustering Algorithm
The K-means clustering algorithm partition m obser-
vations into K clusters where each observation be-
longs to the cluster with the nearest mean (Bishop,
ICINCO2014-11thInternationalConferenceonInformaticsinControl,AutomationandRobotics
38

2006). According to (Ng, 2014), the K-means clus-
tering algorithm can be summarized as follows,
• Set the number of clusters K (In this problem K =
3) and get the reduced dimension training vectors
as x
1
= z
1
, . . . , x
m
= z
m
.
• Randomly initialize K cluster centroids,
µ
1
, . . . , µ
K
.
• Cluster assignment step: Assign each training
vector x
i
to the cluster c
i
according to
c
i
= arg min
k∈{1,2,3}
||x
i
− µ
k
||
2
• Centroid update step: Update the cluster centroid
based on the mean of the training vectors belong
to c
i
.
• Repeat Cluster assignment and Centroid update
steps until the cluster centroids converge.
3 EXPERIMENTS
In this section, we demonstrate the effectiveness of
the clustering algorithm with numerical results.
3.1 Ethical Approval
This study has been approved by the Institutional
Review Board of Yeditepe University Hospital (IRB
no.32). The subjects were informed of the experi-
ment protocol and an orientation has been given to
each subject.
3.2 Subjects
7 subjects (3 female and 4 male), whose ages are in
the range of 22-26, have participated in this study.
The biofeedback signal data of these 7 subjects have
been used for training the clustering algorithm. All
the subjects are healthy and have no background of
any diseases that might have affected the study. Total
task duration is about 30 min for each subject.
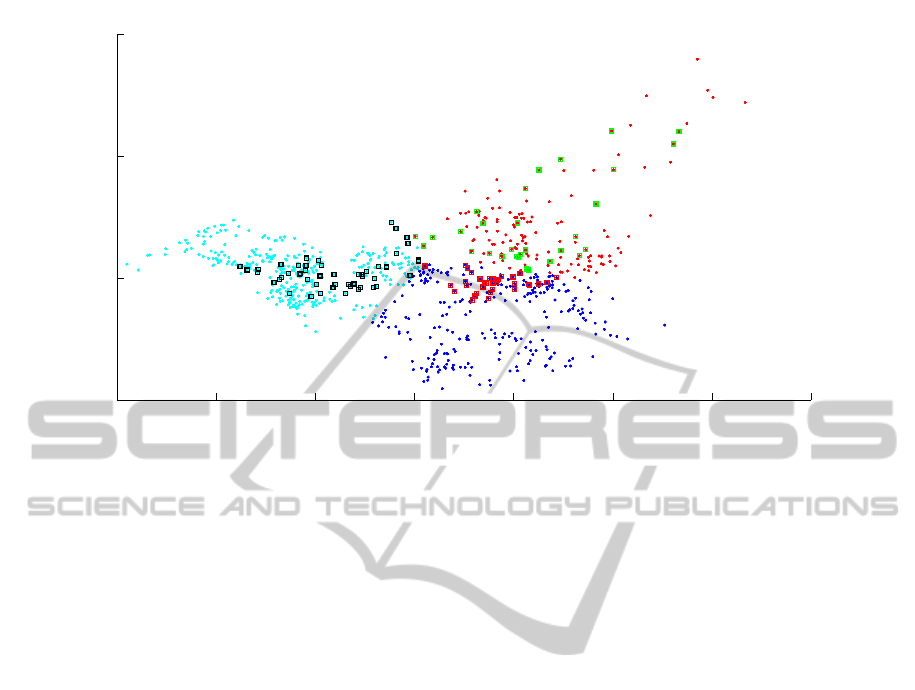
3.3 Results
Three different emotional states, which are classi-
fied by plotting the first two principal components,
are shown in Fig.4. We further highlight the data of
one particular subject who has reported her emotional
state in 6 different tasks for each run in 4 minute in-
tervals. The numericalresults showthat the emotional
states of a subject during the rehabilitation task is sep-
arable. We first determined the emotional state by
Table 1: The number of training vectors where the emo-
tional states decided by the clustering algorithm match with
the subjects survey results
Accuracy
Subject 1 (Female) 82 %
Subject 2 (Male) 71 %
Subject 3 (Female) 83 %
Subject 4 (Female) 77 %
Subject 5 (Male) 84 %
Subject 6 (Male) 68 %
Subject 7 (Male) 81 %
Overall 78 %
Table 2: Percentage of training vectors under different emo-
tional states.
Stress Excitedness Boredom
Survey 12 % 33 % 52 %
Clustering 18.54 % 35.08 % 46.36 %
the clustering algorithm and compared this emotional
state with the emotional state reported by the subject
for each training sample (Table 1). The accuracy per
subject is then defined as the number of training ex-
amples where the emotional states proposed by the
clustering algorithm match with the subjects’ own re-
port. Numerical results show that the clustering re-
sults and the subjects’ reports are consistent to each
other where the overall accuracy is around 80%. In
the survey case, we have assumed all training vec-
tors reflect the same emotional state as declared by
the subject during a 4 minute task. On the other hand,
subjects emotional state may change during the task
and in reality the subject may feel multiple emotional
states while performing the task and may declare only
one of them.
Finally, we compare the percentage of training
vectors under different emotional states obtained with
the clustering algorithm and the survey results. Table
2 shows that the ratio of solutions obtained with the
clustering algorithm for stress, excitement and bore-
dom are consistent with the survey results.
4 CONCLUSIONS
In this paper, we consider an unsupervised learning
problem where the task is to classify the emotional
states of a subject while in performing different diffi-
culty levels of a robot assisted rehabilitation task. We
have first used dimensionality reduction using PCA to
reduce the dimension of each training example with
19 features to 2 dimensions to better visualize the
data. Then, we have used the K-means clustering al-
gorithm and decided the clusters associated with each
ClusteringofEmotionalStatesunderDifferentTaskDifficultyLevelsfortheRobot-assistedRehabilitation
system-RehabRoby
39
−6 −4 −2 0 2 4 6 8
−5
0
5
10
First Principal Component
Second Principal Component
Figure 4: Visualization of the biofeedback sensor data after dimensionality reduction and K-means clustering. Cyan dots
represent the boredom cluster, blue dots represent the excitedness cluster, and purple dots represent the stress cluster. One
particular subject (Subject 1) declared her emotional state as bored for the vectors represented with red squares, excited for
the vectors represented with blue squares and stressed for the vectors represented with black squares.
emotional state. Numerical results show that the clus-
ters offered by the clustering algorithm are consis-
tent with the survey results where subjects report their
own emotional state.
The proposed clustering algorithm provides a ba-
sis for the supervised learning problems for the robot-
assisted rehabilitation task. As a future work, we need
to determine the decision boundaries among clusters
reflecting different emotional states. Therefore, while
subjects perform the task, the learning algorithm will
be able to predict the emotional state of the subject,
and accordingly adjust the difficulty level of the task
in real-time. Furthermore, more comparative results
can be included when different learning algorithms
are used for classification of emotional states. Addi-
tionally, it is also desirable to evaluate the accuracy of
the classification algorithms for the disabled people.
ACKNOWLEDGEMENTS
The study was supported by the European Union Sev-
enth Framework Programme FP7/2007-2013 under
grant agreement n. 270396 (I-SUR). We gratefully
acknowledge the help of Prof. Serap Inal and Prof.
Sule Badilli Demirbas, who are in the Physiother-
apy and Rehabilitation Department of the Faculty of
Health Sciences Yeditepe University, for their valu-
able feedback concerning the task design. Addition-
ally, we acknowledge the help of Cenap Turan for his
help during the preparation of the surveys. We appre-
ciate the comments and suggestions provided by the
reviewers that significantly improve the clarity and
content of this paper.
REFERENCES
Balasubramanian, S., Wei, R., Perez, M., Shepard, B.,
Koeneman, E., Koeneman, J., and He, J. (2008). Ru-
pert: an exoskeleton robot for assisting rehabilitation
of arm functions. In Virtual Rehabilitation, 2008,
pages 163–167. IEEE.
Bishop, C. M. (2006). Pattern Recognition and Machine
Learning, volume 1. Springer New York.
Bradley, M. M. and Lang, P. J. (1994). Measuring emotion:
the self-assessment manikin and the semantic differ-
ential. Journal of behavior therapy and experimental
psychiatry, 25(1):49–59.
Caldwell, D. G., Tsagarakis, N. G., Kousidou, S., Costa, N.,
and Sarakoglou, I. (2007). ” soft” exoskeletons for up-
per and lower body rehabilitationdesign, control and
testing. International Journal of Humanoid Robotics,
4(03):549–573.
Filipovic, S. R. and Andreassi, J. L. (2001). Psychophys-
iology: Human behavior and physiological response.
Journal of Psychophysiology, 15(3):210–212.
Guadagnoli, M. A. and Lee, T. D. (2004). Challenge point:
a framework for conceptualizing the effects of vari-
ous practice conditions in motor learning. Journal of
motor behavior, 36(2):212–224.
ICINCO2014-11thInternationalConferenceonInformaticsinControl,AutomationandRobotics
40

Gunes, H., Schuller, B., Pantic, M., and Cowie, R. (2011).
Emotion representation, analysis and synthesis in con-
tinuous space: A survey. In IEEE International Con-
ference on AutomaticFace & Gesture Recognition and
Workshops (FG 2011),, pages 827–834. IEEE.
Kandemir, M. (2013). Learning Mental States from Biosig-
nals. PhD thesis, Aalto University School of Science.
Kiguchi, K., Rahman, M. H., Sasaki, M., and Teramoto, K.
(2008). Development of a 3dof mobile exoskeleton
robot for human upper-limb motion assist. Robotics
and Autonomous Systems, 56(8):678–691.
Koenig, A., Novak, D., Omlin, X., Pulfer, M., Perreault,
E., Zimmerli, L., Mihelj, M., and Riener, R. (2011a).
Real-time closed-loop control of cognitive load in
neurological patients during robot-assisted gait train-
ing. IEEE Transactions on Neural Systems and Reha-
bilitation Engineering, 19(4):453–464.
Koenig, A., Omlin, X., Zimmerli, L., Sapa, M., Krewer, C.,
Bolliger, M., M¨uller, F., and Riener, R. (2011b). Psy-
chological state estimation from physiological record-
ings during robot-assisted gait rehabilitation. Journal
of Rehabilitation Research & Development, 48(4).
Krebs, H. I., Ferraro, M., Buerger, S. P., Newbery, M. J.,
Makiyama, A., Sandmann, M., Lynch, D., Volpe,
B. T., and Hogan, N. (2004). Rehabilitation robotics:
pilot trial of a spatial extension for mit-manus. Jour-
nal of NeuroEngineering and Rehabilitation, 1(1):5.
Loureiro, R., Amirabdollahian, F., Topping, M., Driessen,
B., and Harwin, W. (2003). Upper limb robot me-
diated stroke therapygentle/s approach. Autonomous
Robots, 15(1):35–51.
Lum, P. S., Burgar, C. G., Van der Loos, M., Shor, P. C.,
Majmundar, M., and Yap, R. (2006). Mime robotic
device for upper-limb neurorehabilitation in subacute
stroke subjects: A follow-up study. Journal of reha-
bilitation research & development, 43(5).
Maclean, N. and Pound, P. (2000). A critical review of the
concept of patient motivation in the literature on phys-
ical rehabilitation. Soc Sci Med, 50(4):495–506.
Mandryk, R. L. and Atkins, M. S. (2007). A fuzzy
physiological approach for continuously modeling
emotion during interaction with play technologies.
International Journal of Human-Computer Studies,
65(4):329–347.
Nef, T., Guidali, M., and Riener, R. (2009). Armin III–arm
therapy exoskeleton with an ergonomic shoulder actu-
ation. Applied Bionics and Biomechanics, 6(2):127–
142.
Ng, A. (2014). Machine Learning Lecture Notes.
http://coursera.org/ml.
Novak, D., Mihelj, M., and Munih, M. (2012). A survey of
methods for data fusion and system adaptation using
autonomic nervous system responses in physiological
computing. Interacting with Computers, 24(3):154–
172.
Ozkul, F. and Barkana, D. E. (2013). Upper-extremity reha-
bilitation robot rehabroby: Methodology, design, us-
ability and validation. International Journal of Ad-
vanced Robotic Systems.
Ozkul, F., Barkana, D. E., Demirbas, S. B., and Inal, S.
(2012). Evaluation of elbow joint proprioception with
rehabroby: a pilot study. Acta Orthop Traumatol Turc,
46(5):332–338.
Perry, J. C., Rosen, J., and Burns, S. (2007). Upper-limb
powered exoskeleton design. IEEE/ASME Transac-
tions on Mechatronics, 12(4):408–417.
Rahman, M. H., Saad, M., Kenne, J.-P., and Archambault,
P. S. (2009). Modeling and control of a 7dof exoskele-
ton robot for arm movements. In IEEE International
Conference on Robotics and Biomimetics (ROBIO),
pages 245–250. IEEE.
Rahman, T., Sample, W., Jayakumar, S., King, M. M., Wee,
J. Y., Seliktar, R., Alexander, M., Scavina, M., and
Clark, A. (2006). Passive exoskeletons for assisting
limb movement. Journal of rehabilitation research
and development, 43(5):583.
Rani, P., Sarkar, N., and Adams, J. (2007). Anxiety-
based affective communication for implicit human–
machine interaction. Advanced Engineering Informat-
ics, 21(3):323–334.
Rani, P., Sarkar, N., and Smith, C. A. (2003a). Affect-
sensitive human-robot cooperation-theory and experi-
ments. In Robotics and Automation, 2003. Proceed-
ings. ICRA’03. IEEE International Conference on,
volume 2, pages 2382–2387. IEEE.
Rani, P., Sarkar, N., Smith, C. A., and Adams, J. A. (2003b).
Affective communication for implicit human-machine
interaction. In Systems, Man and Cybernetics, 2003.
IEEE International Conference on, volume 5, pages
4896–4903. IEEE.
Ren, Y., Park, H.-S., and Zhang, L.-Q. (2009). Develop-
ing a whole-arm exoskeleton robot with hand opening
and closing mechanism for upper limb stroke rehabil-
itation. In IEEE International Conference on Rehabil-
itation Robotics, 2009. ICORR 2009., pages 761–765.
IEEE.
Russell, J. A. (1989). Measures of emotion. In R. Plutchik
and H. Kellerman (Eds.), Emotion: Theory, research,
and experience, 4:83–111.
Vertechy, R., Frisoli, A., Dettori, A., Solazzi, M., and
Bergamasco, M. (2009). Development of a new ex-
oskeleton for upper limb rehabilitation. In IEEE In-
ternational Conference on Rehabilitation Robotics,
ICORR 2009., pages 188–193. IEEE.
ClusteringofEmotionalStatesunderDifferentTaskDifficultyLevelsfortheRobot-assistedRehabilitation
system-RehabRoby
41
