
Decision Support and Online Advertising
Development and Empirical Testing of a Data Landscape
Thomas Hansmann
1
and Florian Nottorf
2
1
Institut f¨ur Elektronische Gesch¨aftsprozesse, Leuphana University, L¨uneburg, Germany
2
Adference GmbH, Am Urnenfeld 5, L¨uneburg, Germany
Keywords:
Data Landscape, Decision Support, Online Advertising, User Journey.
Abstract:
The number of data sources available inside and outside companies and total data points increase, which
makes the coordinated data selection in the forefront of decision making with respect to a specific economic
goal becomes more and more relevant. To assess the available data and enhance decision support, we develop
a framework including a process model that supports the identification of goal-oriented research questions and
a data landscape that provides a structured overview of the available data inside and outside the company. We
empirically tested the framework in the field of online advertising to enhance decision support in managing
display advertising campaigns. The test reveals that the developed data landscape supports the identification
and selection of decision-relevant data and that the subsequent analysis leads to economic valuable results.
1 INTRODUCTION
Since 2000, data generation by various sources, such
as Internet usage, mobile devices and industrial sen-
sors in manufacturing, has been growing enormously
(Hilbert and L´opez, 2011). As the number of data
sources as well as the total number of data points
available inside and outside of companies have in-
creased, coordinated data selection in the forefront of
decision making with respect to a specific economic
goal has become more relevant (LaValle et al., 2011).
The lack of a detailed and goal-oriented data selection
process may lead to inefficient decision support (DS)
because i) questions regarding which data sources are
generally available for specific analytic purposes and
ii) questions about which data sources and respective
results should be integrated into the decision making
process remain unanswered.
To identify relevant, available data, we propose
that both a process model for identifying specific op-
timization problems and the development of a data
landscape that provides a structured overview of the
available data inside and outside the company as well
as its characteristics are mandatory. To the best of our
knowledge, neither such a process model nor a data
landscape for DS currently exist (Author, 2013).
We test our model in the field of online advertis-
ing, as the process of data selection and data evalua-
tion is particularly relevant for companies doing on-
line advertising. The field of online advertising of-
fers multiple possible data sources within and outside
the advertising company in different levels of aggre-
gation (e.g., specific user-level data vs. aggregated
data) at different levels of temporal availability (e.g.,
frequently vs. sporadic). Online advertising has be-
come increasingly important for companies in their
attempts to increase consumer awareness of products,
services, and brands. With a share of nearly 50%
of total online advertising spending, paid search ad-
vertising has become the favored online advertising
tool for companies. In addition to paid search adver-
tising, companies can combine several forms of dis-
play advertising, such as banner or affiliate advertis-
ing, on multiple platforms (i.e., information sites, fo-
rums, or social network sites) to enhance consumer
awareness (Braun and Moe, 2013). These increased
opportunities to advertise online add complexity to
managerial decisions about how to optimally allocate
online advertising spending, as consumers are often
exposed to numerous types of online advertising dur-
ing their browsing routinesor their search-to-buy pro-
cesses (Rutz and Bucklin, 2011b).
The goal of this paper thus is twofold: i) the de-
velopment of a process model for the generation of a
data landscape and ii) its empirical application.
The paper is structured as follows: after describ-
ing the current state of science about data selection
and its weaknesses in the field of DS applications,
111
Hansmann T. and Nottorf F..
Decision Support and Online Advertising - Development and Empirical Testing of a Data Landscape.
DOI: 10.5220/0005060401110122
In Proceedings of the 11th International Conference on e-Business (ICE-B-2014), pages 111-122
ISBN: 978-989-758-043-7
Copyright
c
2014 SCITEPRESS (Science and Technology Publications, Lda.)

a process model for the development of a data land-
scape is developed. This section is followed by the
testing of the proposed model in the field of online
advertising. Finally, based on the identified data, we
apply the model of (Nottorf and Funk, 2013) to en-
hance DS in the field of display advertising. After
outlining our findings and discussing our results, we
conclude this study by highlighting its limitations and
providing suggestions for future research.
2 DATA LANDSCAPE AND
DECISION SUPPORT
2.1 Current Research
An initial literature review revealed that no process
models specific to the developmentof data landscapes
have been published in the field of online advertising
or decision support, although (Chaudhuri et al., 2001)
claim that “what data to gather and how to conceptu-
ally model the data and manage its storage” is a fun-
damental issue.
The fields of data warehouse (DW) and informa-
tion system (IS) development represent a preliminary
stage in developing data landscapes in terms of infor-
mation requirementanalysis, which includes the iden-
tification of data and information necessary to sup-
port the decision maker (Byrd et al., 1992). (Win-
ter and Strauch, 2003) distinguish between the two
systems, citing the underlying IT-infrastructure, the
number of interfaces and connections, the degree of
specification, and the number of involved organiza-
tional units as distinguishing factors. The different
characteristics lead to a disparity in the information
requirement analysis because IS requirements tar-
get “necessary and desirable system properties from
prospective users” whereas the required information
for a data warehouse system can usually not be gath-
ered correctly due to the “uniqueness of many deci-
sion/knowledge processes”. Consequently, how ex-
tensively these models can be applied to data land-
scape development must be tested.
The existing identification approaches for DW
can be categorized as data/supply-, requirement/goal/
demand-, or process-driven (Winter and Strauch,
2003). Data-driven approaches focus on the available
data, which can be found in the operational systems
(e.g., ERP or CRM systems) (Moody and Kortink,
2000; Golfarelli et al., 1998). This approach can help
identify the sum of the overall available data but fails
to incorporate the users’ respective decision-makers
actual and future requirements. Requirement-driven
approaches focus on the requirements of the system
user, assuming that a user can best evaluate his infor-
mation need, which is simultaneously a limiting fac-
tor because most users are not aware of the overall
available data sources (Gardner, 1998). Furthermore,
in an early study (Davis, 1982) explains human bias-
ing behaviors, which havea negativeinfluence on data
selection in the initial phases of a data warehouse de-
velopment. He describes strategies to determine the
information requirements, including asking, deriving
them from an existing information system, synthesiz-
ing them from characteristics of the utilizing system,
and discovering them through experimentation with
an evolving information system. He also emphasizes
the relevance of data characteristics, claiming, “the
format of the data is the window by which users of the
data see things an events. Format is thus constrained
by the structure.”
As a special form of the requirement-driven ap-
proach, the process-driven approach focuses on data
from existing business processes and therefore avoids
the subjectivity of the requirement-driven approach
and the constraints of the data-driven approach (List
et al., 2000). Depending on the coverage of business
processes by IT systems, this approach can produce
results that are similar to those of the data-driven ap-
proach; as more process steps are covered, the results
from the two approaches are more comparable. One
challenge for the use of the process-driven approach
in landscape development can be the identification of
the relevant decision process.
Using a method engineering approach, the infor-
mation requirement analysis by (Winter and Strauch,
2004) introduces the information map that described
“which source systems provide which data in which
quality” but does not amplify the development of this
data landscape. (Giorgini et al., 2005) present a mixed
demand/supply-driven goal-oriented approach, incor-
porating the graphical representation of data sources
and attributes depending on the particular analytic
goal. The graphical representation contains aspects
of a data landscape but does not contain a charac-
terization/evaluation of the attributes and focuses on
existing, internal data sources. (Maz´on et al., 2007)
also propose a goal-oriented approach, introducing a
hierarchy among the strategic, decisional and infor-
mational goals. Based on the information goals, mea-
sures and dependencies among them are identified.
Less research has been published regarding infor-
mation requirement analysis for IS/decision support
systems. (Byrd et al., 1992) categorize existing ap-
proaches into observation techniques (prototyping),
unstructured elicitation techniques (e.g., brainstorm-
ing and open interviews), mapping techniques (e.g.,
ICE-B2014-InternationalConferenceone-Business
112

variance analysis), formal analytic techniques (reper-
tory grid), and structured elicitation techniques (e.g.,
structured interviews and critical success factors),
which can be used to identify requirements based on
existing information systems. (Davis, 1982) presents
four strategies for generic requirement identification
on the organization or application-level: i) asking,
ii) deriving it from an existing information system,
iii) synthesizing it from characteristics of the utilizing
system, and iv) discovering it from experimentation
with an evolving information system. In their litera-
ture review, (Stroh et al., 2011) compare and evalu-
ate methods for analyzing information requirements
for analytical information systems based on the re-
quirementengineering by (Kotonya and Sommerville,
1998). Their analysis reveals that most publications
address elicitation, but the issue needs to be pursued
further. The same applies to research about documen-
tation of the information requirement, which lacks a
“sufficient level of detail” that is coherent for both
business and IT.
The presented models can not be utilized for the
information requirement analysis in the context of de-
cision support as the existing models focus on inter-
nal company data and hence do not consider possible
valuable external data for DS purposes. Therefore,
an external perspective has to be incorporated. Sec-
ond, to cope with the multiple data sources, a struc-
ture must be provided that supports focusing only on
decision-relevant data which can only be found in the
work by (Giorgini et al., 2005) and (Maz´on et al.,
2007). Consequently, we propose a process model de-
cision supportthat enhances the process of identifying
and evaluating potential data sources.
2.2 Development of the Process Model
for the Data Landscape
The proposedprocess modelfor data landscape devel-
opment combines and extends the goal-oriented ap-
proaches by (Giorgini et al., 2005) and (Maz´on et al.,
2007) and the data model-oriented level-approach by
(Inmon, 2005). The initial goal-oriented approach
helps identify relevant analysis tasks, whose results
support the overall decision making process.
The starting point can be the pursuit of a strategic
goal or a specific analytic question. In the first case,
the decision and information goals are derived based
on the strategic goal, using a top-down approach. For
example in the field of online advertising, a strategic
goal can be the improvement of the overall company
reputation or an increase in sales. These goals can
focus on the department level or the company level.
In the next step, the strategic goal is itemized into
decision goals, which, when completed, contribute to
the achievement of the overall strategic goal.
In the third step, the decision goals are specified
by developing information goals as the lowest hierar-
chical step. Information goals are concrete goals that
contain distinctive analytic questions. These form the
basis for the subsequent identification of relevant data
sources in an information requirement analysis.
The goal hierarchy supports the identification of
analytic questions, based on requirements, as a first
step to frame the requirements based on the neces-
sary decision support, incorporating the uniqueness
of each decision making process (Winter and Strauch,
2003). Furthermore, it fosters the definition of ana-
lytic goals, independent of the perceived limitations
regarding employees’ knowledge of available data
sources. Due to their granularity, information goals
can be used to derive concrete hypotheses that can be
tested. In case a concrete analytic goal exists, this
technique can be used as a bottom-up approach to
identify further informational goals. In this case, the
related decisional and strategic goals are first defined.
Based on the decision goal, further information goals
are derived.
In the next step, the related business process is
defined for each analytic goal. For example in the
field of online advertising, for the possible informa-
tion goal “analyze online customer conversions under
the influence ofonline advertising” the related generic
business processis established as a potential customer
interacts with an advertisement(i.e., bybeing exposed
to a banner advertisement or clicking on a paid search
advertisement), visits the online shop, and purchases
a product.
In the next step, the related data sources, e.g.,
ERP-/CRM-systems, and attributes for each process
step are identified. To this point, this approach for a
high- or mid-level data analysis is similar to the one
proposed by (Inmon, 2005). We extend this approach
to cope with the requirements of DS in the emerg-
ing Big Data context regarding the dimensions vol-
ume, variety, velocity and veracity. Considering the
numerous data sources within and outside the com-
pany that can contain business process and decision-
relevant data, we extend the approach by distinguish-
ing internal and external data sources (Stonebraker
and Robertson, 2013). For example, the data sources
regarding a purchased productare not limited to prod-
uct master data and sales data on the product level.
They can be enriched by customer reviews from exter-
nal product platforms regarding customer satisfaction
or product weaknesses and can thereforefoster the de-
cision support, e.g., with regard to companies spend-
ing on product development,product quality manage-
DecisionSupportandOnlineAdvertising-DevelopmentandEmpiricalTestingofaDataLandscape
113
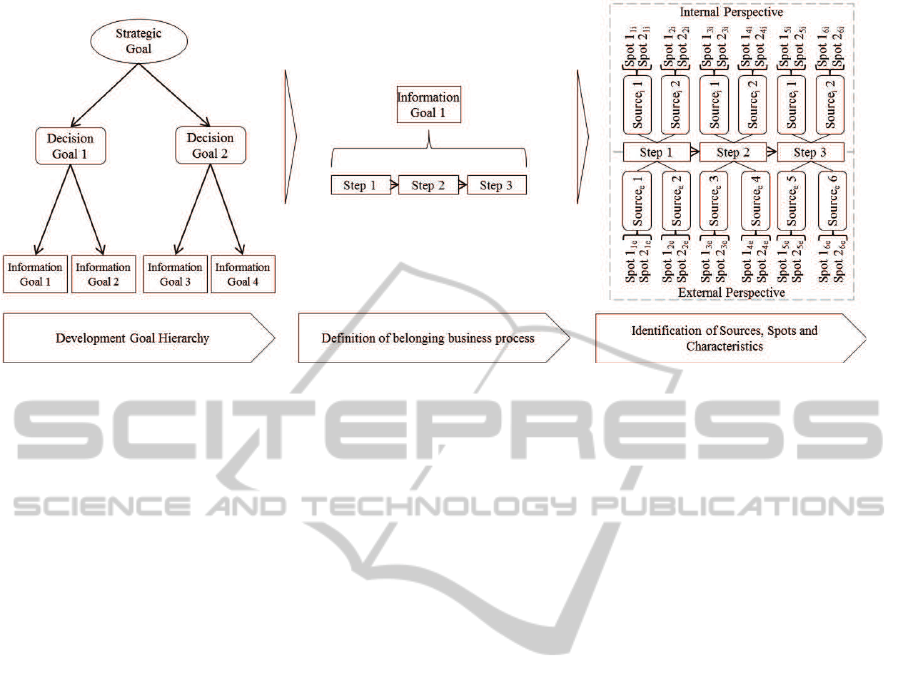
Figure 1: Process Steps.
ment, or reputation management.
The available data sources, spots and attributes in
the field of online advertising and decision support
are heterogeneous. We understand data spots to be
the next lower level of data sources — the customer
or product master data which contain again attributes,
e.g., name, address. Consequently, for decisions in
which data sources and spots should be integrated into
the analysis, information about the potential informa-
tion content and the amount of data processing work
resulting from its characteristics is needed. For exam-
ple, the characteristics in Table 1 must be defined for
each attribute.
Therefore, the second extension is the introduc-
tion of a low-level attribute characterization that con-
tains the determination of data characteristics for each
attribute in addition to the type and source system
of the data, which are already known from database
development-related approaches. Furthermore, at-
tributes that do not contain further insight indepen-
dent of the decision in focus (e.g., customer telephone
number) are eliminated in the following data cleaning
step. This removal step aims to simplify the subse-
quent model building process. Previous approaches
to information requirement analysis do not consider
further data characteristics as the physical attributes
like data type (e.g. varchar). With the increase in
the number and points of origin of potential available
data sources, a cost estimation in the early stages of
heterogeneous source utilization is crucial.
The determination of characteristics fosters the
evaluation of attributes regarding costs and effort for
an integration into the DS. Using Twitter as an ex-
ample, although data collection is simplified by using
the available API, the process of data cleaning with
regard to the noisy data is time consuming. Con-
versely, the (pre-)processing of clickstream data is
less time consuming due to the higher degree of struc-
ture. To incorporate these characteristics, the degree
of structure and distinction between machine- and
human-generated data is introduced, assuming that
unstructured data generated by humans, such as re-
views or blog entries, are more likely to contain noisy
data, which increase the time needed for data (pre-
) processing due to typos (e.g., “gooood” instead of
“good”) or linguistic features (e.g., irony, sarcasm).
With regard to blog entries or tweets from different
countries, the text language also influences the pre-
processing time, although research has revealed that
machine-basedtranslationdoes not necessarily impair
the results (Forcada et al., 2011). The effort for data
preprocessing is related to the data quality, which is a
major subject in the field of Big Data (Madnick et al.,
2009). In addition the available volume influences the
sample size and the coverage of the analysis. The ve-
locity influences the time intervals in which the deci-
sion model can be updated based on new data. The
costs per unit target purchased data, e.g. advertising
data or market research data. The level indicates in
how far decisions can be made on customer level. The
historical availability defines the period, which can be
incorporated in the analysis. This is of special interest
regarding the changes in customer online behaviour.
In case different internal and external data sources
are supposed to be integrated in a decision support
system, the data characteristics can support the tech-
nological decisions regarding database management
software as well. The introduced aspects of external
data integration and characterization incorporate the
requirements from decision support into the Big Data
context. Based on the developed data landscape, a
model building process that is used to answer the ori-
ICE-B2014-InternationalConferenceone-Business
114

Table 1: Data characteristics and possible features for each attribute.
Characteristics Features Implications
Data type Integer, Small Integer etc.
Degree of Structure High/mid/low Time for (pre-)processing
Volume Actual available amount of data Size of test sample
Velocity Amount per time unit Update cycle of decision model
Costs Costs per unit Cost estimation per decision
API available y/n + data throughput Effort for data gathering
Level Individual/Aggregated Explanatory power on individual level
Data origin Machine-generated/Human-generated Time for (pre-)processing
Historical availability Time units of backwards availability Period the decision model is based on
Language Country code Need for translation
gin question can be established.
In order to develop a sound theoretical founda-
tion, the presented model and its development is eval-
uated in the next step based on the design-science re-
search guidelines (Hevner et al., 2004). Although the
presented paper is not solely linked with information
system research, it exist extensive overlaps with the
field of IT infrastructure especially data warehousing.
With regard to the limited space of this paper, the
guidelines are only shortly described and than cross
checked with the presented model.
1) Design as an artifact demands the production
of a viable artifact. This is fulfilled as an indepen-
dent process model is developed, applicable as a ba-
sis for the respective information system develop-
ment. The 2) Problem Relevance is given as until to-
day companies are confronted with an 1.4-fold annual
data growth (Manyika et al., 2011) based on numer-
ous different company-internal and -external sources
which results in the described insecurity about the
data selection for decision support applications. The
3) guideline Design Evaluation demands for an eval-
uation of the utility, quality, and efficacy of the de-
signed artifact. Therefore, in the next section, the
model is applied in a two step approach in the field
of online marketing, both qualitative and empirical.
Guideline 4) targets the Research Contribution. As
no comparable process model for the development of
a data landscape exists so far, the presented model is
a distinct contribution. This aspect is in conjunction
with guideline 5), the Research Rigor in terms of the
application of rigorous methods. This is given as the
in the forefrontof the model building, an extensive lit-
erature review has been carried out, which led to the
selection of the two presented publications, which act
as a basis for the developed model, complemented by
an two step model evaluation as described. Guideline
6) contains the Design as a Search Process, demand-
ing the utilization of available means. This transfer
of this guideline can not be executed completely as
the with regard to the novelty of this approach, the
run through several test cycles in order to refine the
means could not be carried out so far.
3 EMPIRICAL APPLICATION IN
THE FIELD OF ONLINE
ADVERTISING
3.1 Testing the Process Model
We test the model using the example of a telecom-
munication service provider that sells its products and
services both online and in brick-and-mortar outlets.
We first define a strategic goal and then develop re-
spective information goals. This is followed by the
definition of the corresponding business process and
the identification of related data sources, data spots
and attributes.
For online advertising, a strategic goal may be op-
timizing the company’s advertising spending, such as
by reducing the cost per order (CPO). The CPO is the
sum of the advertising costs divided by the total num-
ber of purchases. Therefore, two possible resulting
decision goals are reducing the advertising spending
while keeping sales constant and vice versa. There-
fore, related information goals include measuring the
effects of reduced advertising spending on sales or the
targeted exposure of online advertising activities to
potential consumers to reduce scattering losses. The
latter informationgoal is the basis for the further anal-
ysis of related data sources, spots and their charac-
teristics. Scattering losses can be analyzed and op-
timized for each active advertising channel, such as
paid search advertising or social media advertising.
In the following example, we will focus on display
advertising activities.
Based on the information goal of “reducing scat-
tering losses of display advertising activities”, we
identify the related business process, which contains
the process of redirecting possible customers from
DecisionSupportandOnlineAdvertising-DevelopmentandEmpiricalTestingofaDataLandscape
115

third-party websites to the company’s online shop
with the help of display advertisements. Because
the company sells products with different techni-
cal specifications, the process begins with the cus-
tomer’s browsing routines or internet-based informa-
tion search regarding a product or service. During
the search, an advertisement for the company is dis-
played to the potential customer, who either clicks on
the advertisement or visits the online shop directly.
The visit to the shop leads to a purchasing decision,
which terminates the analyzed process.
This business process given the information goal
serves as the basis for the following identification of
related data sources and spots as described in Sec-
tion 2.2. The description of each data spot and its at-
tributesand characteristics wouldbe beyond the scope
of this paper. Therefore, we analyze only a selection
of data sources sufficient to demonstrate the function-
ality of the process model:
• The main internal data source (high level) in
the information search process step is the com-
pany’s website respective to the company’s web-
server. On the middle level, the contained data
spots are primarily customer reviews and click-
stream data (Bucklin and Sismeiro, 2003). On the
low level, which contains the data characteristics,
the reviews are poly-structured (i.e., text, evalua-
tion scheme, time of creation, and user name) and
written in the customers national language . They
are written on a sporadic basis. Furthermore, be-
cause they are stored on own servers, the acqui-
sition costs are low in the first step. However,
due to the low structure of text and potential noisy
data, the data preprocessing is time-consuming
and therefore cost-intensive. Reviews are human-
generated on an individual level and are available
because the product is sold in the online shop.
As the second main data spot, the redirection to
the company’s website after clicking on adver-
tisements creates individual user journeys (click-
stream data including information of which user
clicked on what type of online advertisement at
which point of time and finally bought a prod-
uct). These data have a high degree of structure
and can be accessed free of charge because the
telecommunication company in focus has its own
webserver. The data are machine-generated on in-
dividual level. Therefore, less time is required for
data preprocessing than for the customer reviews.
• The data sources and spots identified so far in-
side the company are enriched in the next step by
the external data perspective. On a high level,
websites from other online shops selling a prod-
uct or service, such as Amazon.com or prod-
uct review websites from magazines and product-
related fora, are additional data sources. The
contained data spots include the review texts and
ratings, the time stamp and the reviewer’s pro-
file (e.g., number of reviews written, products re-
viewed so far). Compared to the review data
from the company’s website, the data are poly-
structured, available since the product has been
sold in the respective online shop and generated
at irregular intervals. The information value dif-
fers significantly across reviews and is based on
the length of the review, the active vocabulary
used and the reviewer’s intention (Mudambi and
Schuff, 2010). In addition, fora may contain
phony reviews by reputation management agen-
cies that are designed to influence product sales.
Therefore, the data preprocessing effort is high.
The difference between internal and external re-
views is the absence of an API to access and
store the data. Therefore, its acquisition costs are
higher than are those for internal review data, and
access is not always possible due to crawling lim-
itations.
• A next process step is the contact of the potential
customer with a displayed advertisement (such as
individual “view”-touch point events of individ-
ual users with display advertisements). Because
the company has outsourced its online advertising
activities, the related data source is an external ad-
vertising server. The contained data include the
cookie ID, type of advertisement displayed (e.g.,
banner, pop-up; here, a banner), timestamp, dis-
play duration, location (URL, position on-page,
and size) and whether the advertisement has been
viewed (y/n) and clicked (y/n). These data have
a high degree of structure and contain low to no
noisy data because they are machine-generated.
On the downside, the data are cost-intensive be-
cause they mustbe purchasedfrom the advertising
agency.
• The data source for the final process step, the po-
tential conversion, is again the company’s web
server, which contains the same data used in
the first information-gatheringstep (internal click-
stream data). Additional data spots include the
conversion (y/n), products in the shopping cart
and time of a potential cart abandonment
The structured process leads to numerous poten-
tial data sources with heterogeneous characteristics
that analysis may generally be useful in reducing dis-
play advertising costs. However, each of the data
sources has a different expected level of contribution
to the informationgoal. For example, the internal data
sources may include directly available information
ICE-B2014-InternationalConferenceone-Business
116

about how display advertising affected consumers’
decision and buying processes, which helps com-
panies optimize display advertising activities (Braun
and Moe, 2013; Nottorf and Funk, 2013; Rutz and
Bucklin, 2011a), whereas the external available data
sources, such as customer reviews, only have indirect
effects on the effectiveness of display advertising ac-
tivities and, therefore, will not directly contribute to
the information goal.
Following the principal of first considering data
that are easy to generate and analyze and that are ex-
pected to contribute to the information goal, we an-
ticipate that the internal clickstream data offer deep
insight into consumer online clicking and purchas-
ing behavior. Based on this clickstream data, which
contain highly detailed user-level information, we are
able to analyze user clicking and purchasing behavior.
The results are intended to contribute to the informa-
tion goal of reducing display advertising costs given
the same output or the same number of sales.
3.2 Analyzing Clickstream Data
The telecommunication company in question runs
multiple advertising campaigns. As discussed above,
the company generates highly detailed user-level data
that contain time-specific touch points for individual
users with multiple advertising channels. Analyzing
the advertising-specific attribution to the overall ad-
vertising success (e.g., sales) is an ongoing problem
that is the focus of recent scientific research because
the options for online advertising have become in-
creasingly complex, leading to the necessity of mak-
ing sophisticated decisions (Nottorf, 2013). For ex-
ample, because companies run multiple online ad-
vertising campaigns simultaneously, individual con-
sumers are often exposed to more than one type of
online advertising beforethey click or purchase. Stan-
dalone metrics, such as click-through rates, which are
the ratio of clicks to impressions, or conversion rates,
defined as the number of purchases in relation to the
number of clicks, are not able to realistically assign
these clicks and purchases to a specific type of online
advertising. These metrics neither explain the devel-
opment of consumer behavior over time (i.e., a con-
sumer is first exposed to a display advertisement, later
searches for the advertised product, and finally pur-
chases it) nor account for the potential effects of in-
teraction among multiple types of online advertising.
(Nottorf and Funk, 2013) have recently demon-
strated how having and analyzing clickstream data
can explain consumer online behavior and conse-
quently optimize online advertising activities. There-
fore, we follow (Nottorf and Funk, 2013) in model-
ing clickstream data and analyzing individual con-
sumer purchasing behavior. That is, we interpret all
interactions with advertisements as a repeated num-
ber of discrete choices (Bucklin and Sismeiro, 2003).
For example, consumers can decide whether to buy
a product after clicking on an online advertisement,
which results in a conversion/non-conversion deci-
sion. Note that we model the consumer choice of
buying or not buying (binary choice) by incorporat-
ing the effects of repeated interaction with multiple
types of online advertising as explanatory variables.
As already demonstrated by (Chatterjee et al., 2003),
it is useful to consider short-term advertising effects
on consumers’ success probabilities by adding vari-
ables to the model specification that vary across time
t with each advertisement interaction (X
ist
) as well as
their long-term effects by incorporating variables that
only varyacross sessions s (Y
is
). To model the individ-
ual contribution of each advertising effort and its ef-
fect on the probability that a consumer i will purchase,
we specify a binary logit choice model following the
specification of (Nottorf and Funk, 2013). The proba-
bility that consumer i purchases a product at time t in
session s is modeled as follows:
Conv
ist
=
1 if user i purchases at time t in session s
0 otherwise,
(1)
with the probability
P(Conv
ist
= 1) =
exp(α
i
+ X
ist
β
i
+Y
is
γ
i
+ ε
ist
)
1+ exp(α
i
+ X
ist
β
i
+Y
is
γ
i
+ ε
ist
)
,
(2)
where X
ist
are variables varying within (t), across
sessions (s), and across consumers (i); Y
is
are vari-
ables varying across sessions (s) and consumers (i);
and α
i
, β
i
, and γ
i
are consumer-specific parameters to
be estimated.
α
i
accounts for the propensity of an individual
consumer to purchase a product after clicking on
a respective advertisement. For example, previous
research indicates that consumer responses to ban-
ner advertisements are highly dependent on individ-
ual involvement (Cho, 2003; Danaher and Mullarkey,
2003) and exhibit strong heterogeneity (Chatterjee
et al., 2003; Nottorf, 2013).
To accountfor the effects within a consumer’s cur-
rent session across multiple advertising types, we fol-
low Nottorf and Funk (2013) and define the following
variables incorporated by X
ist
:
X
ist
= {x
search
ist
, x
social
ist
, x
display
ist
, x
affiliate
ist
, x
newsletter
ist
,
x
other
ist
, x
brand
ist
, x
direct
ist
, x
conv
is(t−1)
, Conv
is(t−1)
, TLConv
ist
}.
(3)
DecisionSupportandOnlineAdvertising-DevelopmentandEmpiricalTestingofaDataLandscape
117

We expect the effect of repeated clicks on adver-
tisements to vary depending on the type of online
advertising that is being clicked on. Thus, x
search
ist
,
..., x
other
ist
refer to the cumulative number of clicks on
the respective type of advertisement.
1
x
brand
ist
accounts
for the cumulative number of brand-related interac-
tions (e.g., the search query of the consumer included
the company’s name). x
direct
ist
refers to the cumulative
number of direct visits of a consumer (e.g., via direct
type-in or the use of bookmarks). x
conv
is(t−1)
is the cumu-
lative number of conversions until the consumer’s last
touch point (t−1) in the current session s. Conv
is(t−1)
is an indicator function that assumes the value 1 if a
consumer has purchased in t − 1. TLConv
ist
refers
to the logarithm of time since a consumer’s last pur-
chase. If a consumer has not yet purchased, the vari-
able remains zero.
The variables Y
is
are similar to those specified as
X
ist
, but now account for the long-term, inter-session
effects of previous touch points of a consumer:
Y
is
= {y
search
is
, y
social
is
, y
display
is
, y
affiliate
is
, y
newsletter
is
,
y
other
is
, y
brand
is
, y
direct
is
, y
conv
i(s−1)
, IST
is
, Session
is
}.
(4)
y
search
is
, ..., y
other
is
refer to the number of clicks on re-
spective advertisements in previous sessions. y
brand
is
,
y
direct
is
, and y
conv
i(s−1)
also account for the total number
of respective interactions in previous sessions. IST
is
is the logarithm of the intersession duration between
session s and s − 1 and remains zero if a consumer
is active in only one session. Session
is
refers to the
number of sessions duringwhich a consumerhas been
active.
2
3.3 Empirical Data
The dataset analyzed consists of information on indi-
vidual consumers and the point in time at which they
clicked on different advertisements and made pur-
chases. The internal clickstream data were collected
within a one-month period in 2013 and consist of
more than 500,000 uniqueusers. Because no informa-
tion on the number of consumer sessions and their du-
ration is accessible, we follow(Chatterjee et al., 2003)
1
“search” refers to clicks on paid search advertisements,
“social” to clicks on advertisements on Facebook, “display”
to clicks on generic banner advertisements, “affiliate” to
clicks on banner advertisements of the affiliate networks,
“newsletter” to clicks on emails sent to consumers, and
“other” to further advertisement interactions that do not be-
long to one of the previous groups.
2
For a more detailed description of preparing the click-
stream data for the analysis, please see (Nottorf and Funk,
2013).
and (Nottorf, 2013) and manually define a session as
a sequence of advertising exposures with breaks that
do not exceed 60 minutes. We report the descriptive
statistics of our final set of variables in Table 2. To
test the out-of-sample fit performances of the model,
we split the data into a training sample (50,000 con-
sumers) and a test group (470,906 consumers). The
dataset has been sanitized, and we are unable to pro-
vide any further detailed information on the dataset
for reasons of confidentiality.
3.4 Results and Discussion
Similar to Nottorf and Funk (2013), we use a
Bayesian standard normal model approach to account
for consumer heterogeneity and to determine the set
of individual parameters. We apply a Markov Chain
Monte Carlo (MCMC) algorithm including a hybrid
Gibbs Sampler with a random walk Metropolis step
for the coefficients for each consumer (Rossi et al.,
2005). We perform 5,000 iterations and use every
twentieth draw of the last 2,500 iterations to compute
the conditional distributions.
The parameter estimates for X
ist
and Y
is
can be
found in Table 2. The mean of the intercept α
i
, which
accounts for the initial “proneness to purchase” (fol-
lowing (Chatterjee et al., 2003)), is -5.85. This re-
sults in a very low initial conversion probability of
0.29%. In contrast to the prior findings of Nottorf and
Funk (2013) who modeled click probabilities, only a
few significant parameter estimates exist. For exam-
ple, whereas each additional click on a social media
x
social
ist
or display x
display
ist
advertisement significantly
decreases conversion probabilities within consumers’
current sessions (-6.08 and -1.14), consumers’ clicks
on the remaining channels do not significantly in-
fluence conversion probabilities. However, although
the parameter estimates of the remaining channels are
not significant, they are still influencing conversion
probabilities differently. For example, x
search
ist
is neg-
ative, with a value of -0.58, indicating that each ad-
ditional click on a paid search advertisement within a
consumer’s current session decreases the conversion
probability. Conversely, x
newsletter
ist
= 0.48 is positive,
so each additional click on newsletter-links slightly
increases the probability of a purchase.
To demonstrate how the analysis of clickstream
data can optimize the display advertising efficiency,
we propose a method for short-term decision support
in real-time bidding (RTB).
3
Therefore, we first high-
3
In RTB, display advertising impressions are bought in
an auction-based process and displayed in real time on the
individual consumer level. In other words, the knowledge of
a consumer’s success probability (such as a click or a con-
ICE-B2014-InternationalConferenceone-Business
118

Table 2: Descriptive statistics of the variables used in the final model specification.
X
ist
variables Min. Max. Mean Sd. Y
is
variables Min. Max. Mean Sd.
x
search
ist
0 86.00 0.47 2.63 y
search
is
0 5.42 0.52 1.50
x
social
ist
0 4.00 0.00 0.11 y
social
is
0 2.57 0.01 0.13
x
display
ist
0 432.00 1.60 24.05 y
display
is
0 7.23 0.25 1.30
x
affiliate
ist
0 148.00 0.18 4.18 y
affiliate
is
0 5.30 0.14 0.73
x
newsletter
ist
0 10.00 0.00 0.16 y
newsletter
is
0 3.22 0.01 0.15
x
other
is
0 6.00 0.00 0.12 y
other
is
0 3.76 0.01 0.17
x
brand
ist
0 86.00 0.84 2.62 y
brand
is
0 5.29 1.26 2.23
x
direct
ist
0 41.00 0.53 1.08 y
direct
is
0 5.29 1.08 2.13
x
conv
is(t−1)
0 3.00 0.01 0.11 y
conv
i(s−1)
0 3.22 0.02 0.22
Conv
is(t−1)
0 1.00 0.00 0.10 IST
is
0 7.76 3.14 4.32
TLConv
ist
0 7.77 0.13 1.19 Session
is
1 198.00 12.61 34.49
Table 3: Parameter estimates of the proposed model. We report the mean and the 95% coverage interval; significant estimates
are in boldface.
X
ist
variables Mean (95% cov. interval) Y
is
variables Mean (95% cov. interval)
x
search
ist
-0.58 (-1.38, 0.22) y
search
is
0.42 (-0.41, 1.26)
x
social
ist
-6.08 (-7.03, -5.13) y
social
is
-0.84 (-1.57, -0.11)
x
display
ist
-1.14 (-2.18, -0.10) y
display
is
0.22 (-0.64, 1.07)
x
affiliate
ist
0.06 -0.68, 0.80 y
affiliate
is
-0.03 (-0.81, 0.76)
x
newsletter
ist
0.48 (-0.30, 1.26) y
newsletter
is
-0.56 (-1.21, 0.10)
x
other
is
-0.43 (-1.16, 0.29) y
other
is
0.11 (-0.58, 0.80)
x
brand
ist
0.64 (-0.17, 1.45) y
brand
is
0.00 (-0.90, 0.89)
x
direct
ist
-0.64 (-1.48, 0.20) y
direct
is
0.19 (-0.76, 1.14)
x
conv
is(t−1)
-0.49 (-1.41, 0.43) y
conv
i(s−1)
2.01 (0.53, 3.48)
Conv
is(t−1)
2.05 (1.10, 3.00) IST
is
-0.14 (-0.70, 0.42)
TLConv
ist
0.11 (-0.63, 0.85) Session
is
-0.31 (-0.75, 0.13)
light the out-of-sample fit performance of our pro-
posed model by predicting the actual outcome for the
last available touch point of each consumer from the
test data set (conversion/no conversion) and compar-
ing them with the actual, observed choices. Further-
more, we rank all of these consumers by their indi-
vidual conversion probabilities at the last touch point,
separate them into quartiles, and examine how many
conversions each of the quartiles actually receives
(Table 4).
4
For example, the quartile with the low-
version) at any given time is vital for accurately evaluating
each advertising type and appropriately adjusting financial
resources.
4
We do so following Nottorf and Funk (2013) and (Chat-
terjee et al., 2003) with respect to (Morrison, 1969), who
suggested ranking observations in decreasing order of pre-
dicted probabilities and classifying the first x as clicks
(where x is the total number of clicks observed in the hold-
out sample) because the behavior to be predicted is rela-
tively rare and the base probability of the outcome is very
low. As Chatterjee et al. also emphasize, with a large num-
ber of nonevents (no conversions) and very few events (con-
versions), logistic regression models can sharply underesti-
mate the probability of the occurrence of events.
Table 4: Quartiles are grouped by predicted conversion
probabilities for n = 470,906 consumers. In Scenario 1 (2),
a CPC of e 0.50 (e 0.30) is assumed to calculate the CPO.
CPO
Quartiles Conv. CVR Scenario 1 Scenario 2
0-25% 260 0.22% 227.28 e 136.36 e
25-50% 353 0.30% 166.67 e 100.00 e
50-75% 442 0.38% 131.58 e 78.95 e
75-100% 962 0.82% 60.98 e 36.59 e
Total 2,017 0.43% 116.28 e 69.77 e
est 25% of conversion probabilities (0-25%) receives
12.9% of the total 2,017 conversions that were ob-
served at the last available touch point for each con-
sumer from the test data set, whereas 25% of the con-
sumers with the highest conversion probability (75-
100%) receive nearly 50% of the conversions. Direct-
ing the company’s bidding behavior and advertising-
spending toward this upper quartile bin may lead to
improved short-term decision support and potential
financial savings and, thus, contribute to the overall
strategic goal of reducing the CPO.
DecisionSupportandOnlineAdvertising-DevelopmentandEmpiricalTestingofaDataLandscape
119

Based on the forecast for each consumer-
conversion probability-quartile, we can calculate the
expected quartile-specific conversion rate (CVR). Let
us now assume that the company in question actually
engages in a RTB setting. Depending on the individ-
ual setting (i.e., the contribution margin of the adver-
tised product), companies usually determine a spe-
cific maximum amount of money that they are will-
ing to spend to acquire new customers (which is the
maximum CPO the company is able to spend). In the
following example, we consider two scenarios, each
of which has a different cost per click (CPC), which
results in different CPOs depending on the expected
CVRs (the right side of Table 4). To be clear, let us
consider an example and assume a maximum CPO of
e 75.00. Given that maximum,
5
we see that in Sce-
nario 1, only the consumers within the quartile bin
75-100%should be exposed to display advertisements
because the CPC of the other consumers is expected
to be higher than e 75.00. A company that does
not have information on the clickstream data would
not have exposed any consumers to display advertise-
ments in thefirst scenario becausethe companywould
not have categorized consumers along their individ-
ual conversion probabilities; with e 116.28, the total
expected CPO is higher than the maximum CPO. In
the second scenario with a decreased CPC, the com-
pany would expose all consumers to display adver-
tisements, although only the consumerswith the high-
est expected CVR have a CPO that is lower than the
maximum CPO (e 36.59).
The procedure outlined above leads to additional
profit (profit
add
), in contrast to a company that does
not analyze clickstream data and consequently does
not optimize display advertising activities. To illus-
trate this result for Scenario 1, we must consider the
opportunity cost of a “lost” conversion (cost
opp
) of
a consumer whom we do not expose to display ad-
vertisements because we focus on the consumers who
have the topmost conversion probabilities multiplied
by the number of lost conversions (conv
lost
). Simul-
taneously, we save on the consumers (user
lost
) whom
we do not expose to display advertising due to an ex-
pected CPO that is too high:
profit
add
= user
lost
∗ CPC− conv
lost
∗ cost
opp
(5)
We assume that the cost of a lost conversion is equal to
the maximum CPO (e 75.00). Given that assumption,
the expected profit is e 26,828.85 for Scenario 2.
6
5
In a real setting, these expected CPOs should be cal-
culated repeatedly because the parameter estimates may
change over time and it is necessary to analyze the prob-
abilities of new consumers.
6
Note that there are additional costs (i.e., costs for data
In the first scenario, a company that does not use
the information derived from clickstreams would lose
e 13.286.75 because it misses 25% of the consumers
with the highest predicted probabilities.
7
Please note
that this profit/loss is a sample calculation and may
not hold true for every hour/day iteration. Nonethe-
less, this example demonstrates how analyzing click-
stream data contributes not only to the information
goal of reducing display advertising costs but also to
the overall strategic goal of reducing the global CPO.
4 CONCLUSION
The increasing amount of available data with hetero-
geneous characteristics regarding structure, velocity
and volume hinders the selection of data for deci-
sion support purposes. The existing models primarily
target the information requirement analysis for data
warehouse development but do not support the data
evaluation process in the early stages of data analysis
for decision support.
We developed a data landscape that enhancesboth
the data selection and the decision support process.
The proposed framework incorporates the derivation
of specific goals whose fulfillment enhance the deci-
sion support and the identification of related business
processes as well as the selection of relevant data for
each process step.
We tested the framework to enhance decision sup-
port in online advertising, partly by using approaches
for information requirement analysis from the data
warehouse and information system literature. Based
on the derived information goal of optimizing display
advertising spending, we have found that the inter-
nally available clickstream data offer deep insights
into consumer online clicking and purchasing behav-
ior. Applying the model of (Nottorf and Funk, 2013),
we successfully analyzed and predicted consumers’
individual purchasing behavior to optimize display
advertising spending.
The utility of the process model for the develop-
ment of a data landscape can bedemonstrated because
storage or for analyzing consumer-level data) that should
also have been considered in the calculation above. For
demonstration purposes, these costs are negligible. For ex-
ample, the size of the initial dataset of 500,000 consumers is
approximately 150MB, and the data storage prices for 1 GB
of data are less than e 0.10 at Amazon web services. While
estimating the model is computationally expensive, deter-
mining the conversion probabilities is not. Therefore, we
can neglect the costs for the computation of the expected
conversion probability for an individual advertising expo-
sure.
7
loss
exp
= 470.906∗ 0.25∗0.50− 962∗ 75
ICE-B2014-InternationalConferenceone-Business
120

the model helps identity, classify, characterize and
evaluate data in ways that can contribute to decision
making. The characterization of data spots related to
the business process fosters understanding about the
data and their attributes fordecision supportpurposes.
The absence of such model results can lead to an in-
complete basis for decision making. The limitation
of the presented model results from the nature of pro-
cesses, which have a static character and do not com-
pletely account for customer behavior, e.g., multiple
runs through the process of information gathering.
The presented process model suggests different
opportunities for further research. The proposed
model was applied in the field of online advertis-
ing. It should also be tested in different scenarios to
determine the degree of possible generalization and
application-specific needs, particularly with regard to
the identification of the related business process. Fur-
thermore, the development of a graphical representa-
tion could foster the decision making process.
REFERENCES
Author (2013). Big Data - Characterizing an Emerging Re-
search Field using Topic Models (under review). In-
ternational Journal of Technology and Management.
Braun, M. and Moe, W. W. (2013). Online display adver-
tising: Modeling the effects of multiple creatives and
individual impression histories. Marketing Science,
32(5):753–767.
Bucklin, R. E. and Sismeiro, C. (2003). A model of web
site browsing behavior estimated on clickstream data.
Journal of Marketing Research, 40(3):249–267.
Byrd, T., Cossick, K., and Zmud, R. (1992). A synthesis of
research on requirements analysis and knowledge ac-
quisition techniques. Mis Quarterly, 16(1):117–138.
Chatterjee, P., Hoffman, D. L., and Novak, T. P. (2003).
Modeling the clickstream: Implications for web-based
advertising efforts. Marketing Science, 22(4):520–
541.
Chaudhuri, S., Dayal, U., and Ganti, V. (2001). Database
technology for decision support systems. Computer,
34(12):48–55.
Cho, C.-H. (2003). Factors influencing clicking of ban-
ner ads on the www. CyberPsychology & Behavior,
6(2):201–215.
Danaher, P. J. and Mullarkey, G. (2003). Factors affecting
online advertising recall: A study of students. Journal
of Advertising Research, 43(3):252–267.
Davis, G. B. (1982). Strategies for information require-
ments determination. IBM Systems Journal, 21(1):4–
30.
Forcada, M. L., Ginest´ı-Rosell, M., Nordfalk, J., O’Regan,
J., Ortiz-Rojas, S., P´erez-Ortiz, J. A., S´anchez-
Mart´ınez, F., Ram´ırez-S´anchez, G., and Tyers, F. M.
(2011). Apertium: a free/open-source platform for
rule-based machine translation. Machine Translation,
25(2):127–144.
Gardner, S. R. (1998). Building the data warehouse. Com-
munications of the ACM, 41(9):52–60.
Giorgini, P., Rizzi, S., and Garzetti, M. (2005). Goal-
oriented requirement analysis for data warehouse de-
sign. Proceedings of the 8th ACM international work-
shop on Data warehousing and OLAP - DOLAP,
page 47.
Golfarelli, M., Maio, D., and Rizzi, S. (1998). The dimen-
sional fact model: A conceptual Model for Data Ware-
houses. International Journal of Cooperative Infor-
mation Systems, 7(2-3):215–247.
Hevner, A. R., March, S. T., Park, J., and Ram, S. (2004).
Design science in information system research. MIS
Quarterly, 28(1):75–105.
Hilbert, M. and L´opez, P. (2011). The world’s technolog-
ical capacity to store, communicate, and compute in-
formation. Science (New York, N.Y.), 332(60):60–65.
Inmon, W. H. (2005). Building the Data Warehouse. John
Wiley & Sons, Indianapolis, 4th edition.
Kotonya, G. and Sommerville, I. (1998). Requirements En-
gineering: Processes and Techniques. John Wiley &
Sons.
LaValle, S., Lesser, E., and Shockley, R. (2011). Big Data,
Analytics and the Path From Insights to Value. MIT
Sloan Management Review, 52(2):21–31.
List, B., Schiefer, J., and Tjoa, A. (2000). Process-oriented
requirement analysis supporting the data warehouse
design process a use case driven approach. In DEXA
’00 Proceedings of the 11th International Conference
on Database and Expert Systems Applications, pages
593–603.
Madnick, S. E., Wang, R. Y., Lee, Y. W., and Zhu, H.
(2009). Overview and Framework for Data and In-
formation Quality Research. ACM Journal of Data
and Information Quality, 1(1):1–22.
Manyika, J., Chui, M., Brown, B., Bughin, J., Dobbs, R.,
Roxburgh, C., and Byers, A. H. (2011). Big data : The
next frontier for innovation , competition , and pro-
ductivity. Technical Report June, McKinsey Global
Institute.
Maz´on, J., Pardillo, J., and Trujillo, J. (2007). A
model-driven goal-oriented requirement engineering
approach for data warehouses. In Advances in Con-
ceptual Modeling – Foundations and Applications,
pages 255–264. Springer, Berlin Heidelberg.
Moody, D. L. and Kortink, M. A. R. (2000). From Enter-
prise Models to Dimensional Models : A Methodol-
ogy for Data Warehouse and Data Mart Design Ob-
jectives of Dimensional Modelling. In 2nd DMWD,
volume 2000.
Morrison, D. G. (1969). On the interpretation of dis-
criminant analysis. Journal of Marketing Research,
6(2):156–163.
Mudambi, S. and Schuff, D. (2010). What makes a helpful
online review? A study of customer reviews on Ama-
zon. com. MIS quarterly, 34(1):185–200.
Nottorf, F. (2013). Modeling the clickstream across mul-
tiple online advertising channels using a binary logit
DecisionSupportandOnlineAdvertising-DevelopmentandEmpiricalTestingofaDataLandscape
121

with bayesian mixture of normals. Electronic Com-
merce Research and Applications, (Article in Ad-
vance).
Nottorf, F. and Funk, B. (2013). The economic value of
clickstream data from an advertiser’s perspective.
Rossi, P. E., Allenby, G. M., and McCulloch, R. E. (2005).
Bayesian statistics and marketing. Wiley, Hoboken,
NJ.
Rutz, O. J. and Bucklin, R. E. (2011a). Does banner adver-
tising affect browsing for brands? clickstream choice
model says yes, for some. Quantitative Marketing and
Economics, pages 1–27.
Rutz, O. J. and Bucklin, R. E. (2011b). From generic to
branded: A model of spillover in paid search advertis-
ing. Journal of Marketing Research, 48(1):87–102.
Stonebraker, M. and Robertson, J. (2013). Big data is ’buz-
zword du jour;’ CS academics ’have the best job’.
Communications of the ACM, 56(9):10.
Stroh, F., Winter, R., and Wortmann, F. (2011). Method
Support of Information Requirements Analysis for
Analytical Information Systems. Business & Infor-
mation Systems Engineering, 3(1):33–43.
Winter, R. and Strauch, B. (2003). A method for
demand-driven information requirements analysis in
data warehousing projects. In Proceedings of the 36th
Annual Hawaii International Conference on System
Sciences, number section 2.
Winter, R. and Strauch, B. (2004). Information require-
ments engineering for data warehouse systems. In
Proceedings of the 2004 ACM symposium on Applied
computing - SAC ’04, New York, New York, USA.
ACM Press.
ICE-B2014-InternationalConferenceone-Business
122
