
Visual Odometry using the Global-appearance of Omnidirectional
Images
F. Amor´os, L. Pay´a, D. Valiente, A. Gil and O. Reinoso
System Engineering and Automation Dep., Miguel Hern´andez University,
Avda. de la Universidad, s/n. 03202, Elche (Alicante), Spain
Keywords:
Multi-scale Analysis, Global-appearance Descriptors, Visual Odometry, Robot Navigation.
Abstract:
This work presents a purely visual topologic odometry system for robot navigation. Our system is based on a
Multi-Scale analysis that allows us to estimate the relative displacement between consecutive omnidirectional
images. This analysis uses global appearance techniques to describe the scenes. The visual odometry system
also makes use of global appearance descriptors of panoramic images to estimate the phase lag between
consecutive images and to detect loop closures. When a previous mapped area is recognized during the
navigation, the system re-estimates the pose of the scenes included in the map, reducing the error of the path.
The algorithm is validated using our own database captured in an indoor environment under real dynamic
conditions. The results demonstrate that our system permits estimating the path followed by the robot with
accuracy comparing to the real route.
1 INTRODUCTION
In order to navigate autonomously, a mobile robot
should be equipped with one or several sensors that
gather the information of its surrounding environ-
ment. Additionally, it must interpret the data that
those sensors provide.
Normally, this information is used to build an in-
ternal representation of the navigation area in a map,
and it allows the robot to localize itself.
In the literature, we can find a wide variety of sen-
sors that provide the robot with information of the
surroundings. Among all the possibilities, vision sys-
tems have become popular sensors for robot control
due to the richness of the information they provide,
their relative low weight and cost, and the variety of
possible configurations. This work is focused on om-
nidirectional scenes obtained with a catadioptric sys-
tem, composed of a hyperbolic mirror and a CCD
camera.
A key aspect in visual navigationis the description
of the scenes. In this regard, two main categories can
be found: feature based and global-appearance de-
scriptors. The first approach is based on the extraction
and description of significant points or local regions
from the scene. It is possible to find many examples
of use of these descriptors applied to localization and
mapping tasks, such as features (Lowe, 2004; Lingua
et al., 2009), SURF (Murillo et al., 2007; Bay et al.,
2008), or Harris edge and corner detector (Gartshore
et al., 2002). On the other hand, global-appearance
descriptors try to describe the scene as a whole, with-
out the extraction of local features or regions. These
techniques have a special interest in unstructured and
changing environments where it may be difficult to
find patterns to recognize the scene. For example,
(Krose et al., 2007) demonstrate the robustness of
PCA (Principal Component Analysis) applied to im-
age processing; (Menegatti et al., 2004) take advan-
tage of the properties of the Discrete Fourier Trans-
form (DFT) applied to panoramic images in order to
build descriptors of the scene and, at last, (Kunttu
et al., 2004) describe the behaviour of a descriptor
based on Fourier transform and Wavelet filter in im-
age retrieving tasks.
Regarding the representation of the map, three
main approaches stood out: metric, topological and
hybrid techniques. Metric maps (Moravec and Elfes,
1985) include information of distances with respect
to a predefined coordinate system. In these maps, we
can know the position of the robot except for an un-
certainty associated with the sensor error. However,
they usually have a high computational cost.
In contrast, topological techniques use graph-
based representations of the environment. In those
maps, there are not absolute distances. Despite this
483
Amorós F., Payá L., Valiente D., Gil A. and Reinoso O..
Visual Odometry using the Global-appearance of Omnidirectional Images.
DOI: 10.5220/0005062604830490
In Proceedings of the 11th International Conference on Informatics in Control, Automation and Robotics (ICINCO-2014), pages 483-490
ISBN: 978-989-758-040-6
Copyright
c
2014 SCITEPRESS (Science and Technology Publications, Lda.)
fact, they usually contain enough information for a
robot to autonomously navigate within the environ-
ment. As an example, FAB-MAP (Cummins and
Newman, 2011) is a well-known topological SLAM
approach, based on SURF features extraction to de-
scribe the appearance of the image.
Hybrid techniques try to take advantage of both
topological and metric proposals. Normally, hybrid
maps use metric in order to build sub-maps of sepa-
rated areas, whereas topological relations are used in
order to connect the different areas of the map. It is
also possible to introduce the topological relations to
carry out loop closures in metric maps. An example of
hybrid SLAM algorithm is RatSLAM (Milford et al.,
2004).
In this work we propose a framework for the esti-
mation of the path of a robot using only visual infor-
mation. Comparing to other works, we make use only
of omnidirectional views and global appearance de-
scriptors to estimate the movement of the robot. We
describe our localization as topological, since no met-
ric information is provided. However, as shown in this
paper, our algorithm is able to describe the route path
of the robot with a layout similar to the real metric
distribution.
The paper is structured as follows: Next section
describes the use of the Multi-Scale analysis to om-
nidirectional images in order to obtain a topological
measure of displacement between scenes. Section 3
presents an algorithm to estimate the relative pose of
two omnidirectional images. In section 4 we explain
the application of this algorithm to navigation tasks,
including loop closures that improve the estimation of
the path. Section 5 includes the experimental database
and results. Finally, in Section 6 we summarize the
main ideas obtained in this work.
2 MULTI-SCALE ANALYSIS IN
OMNIDIRECTIONAL IMAGES
In this section, we describe a visual odometry sys-
tem that extends the use of the Multi-Scale analysis to
omnidirectional information. The Multi-Scale Anal-
ysis permits obtaining information about relative dis-
placement between two scenes using artificial zoom-
ing of plane projection images. In a previous work,
(Amor´os et al., 2013) we developed the use of Multi-
Scale analysis in topological map building and route
path estimation of a robot equipped with a fish-eye
camera. As stated in that work, the Multi-Scale anal-
ysis only works properly if the digital zooming is ap-
plied to a perspective image captured in a plane per-
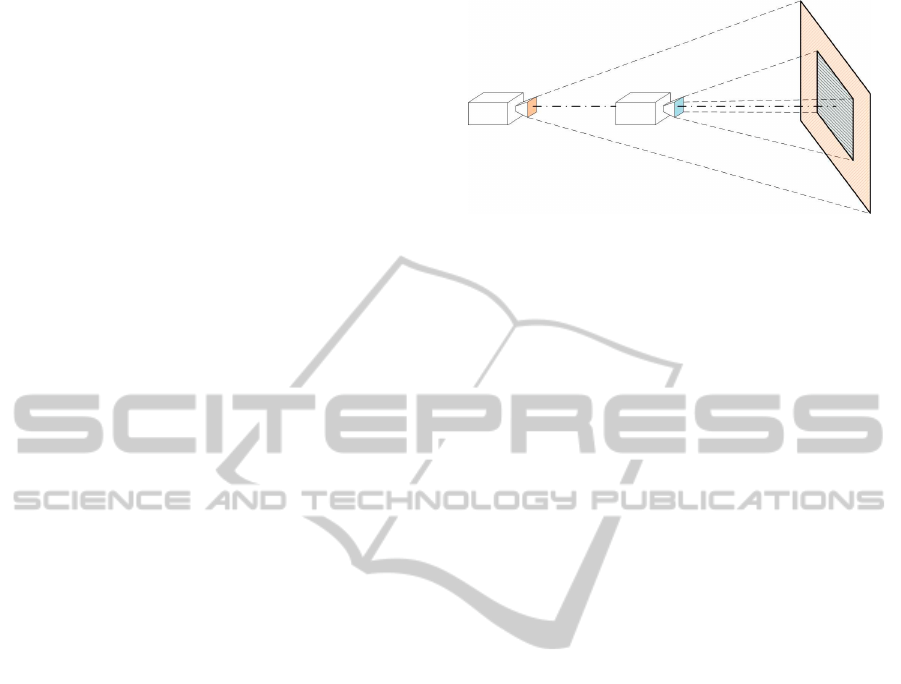
pendicular to the robot movement. Figure 1 shows
Figure 1: Visual field of two scenes captured by a visual
system with a direction of travel perpendicular to the pro-
jection plane.
the field of view of a camera when it moves forward
perpendicularly to its projection plane. It is possi-
ble to see that, the scene in the ahead position (rep-
resented in blue), correspondes to the central area of
the camera field of view when it is in the back posi-
tion (represented in orange). That way, if we select
the central area of the orange image and re-scale it to
the original image size (simulating a digital zoom),
the appearance regarding the second image is more
similar. The difference of scales between both images
provides information about the direction and magni-
tude of the displacement between the points where the
images were captured.
Our catadioptric system collects information of
the entire field of view around the mirror axis. Taking
advantage of the system calibration, it is possible to
find out the direction of the rays that arrive to the mir-
ror, and we can obtain projections using different ge-
ometries. For example, we can obtain the panoramic
view of the scene. In the same way, we can obtain
additional views by projecting the visual rays in some
planes which are parallel to the mirror axis (Fig. 2).
These perspective images are the projections that the
Multi-Scale analysis uses.
In an omnidirectional image, we can extract two
different plane projections which are perpendicular to
the robot direction of travel: one in the forward direc-
tion, and the other in the reverse one. Figure 3 shows
an example of the two plane projections we extract
from the image. The blue arrow points forward, and
the red one, backwards.
As the robot advances, it approaches the elements
located in front of it, and movesaway from the objects
located behind it. This turns into a zoom-in of the
front plane projection image, and a zoom-out of the
backwards projection image. Therefore, in the Multi-
Scale analysis, the scales of each orientation vary with
different sign. The zooming in the projections is car-
ried out by changing the focal distance of the projec-
tion plane. In Figure 4 we can see an example. The
central focal length corresponds to fc = 1.1, and the
ICINCO2014-11thInternationalConferenceonInformaticsinControl,AutomationandRobotics
484
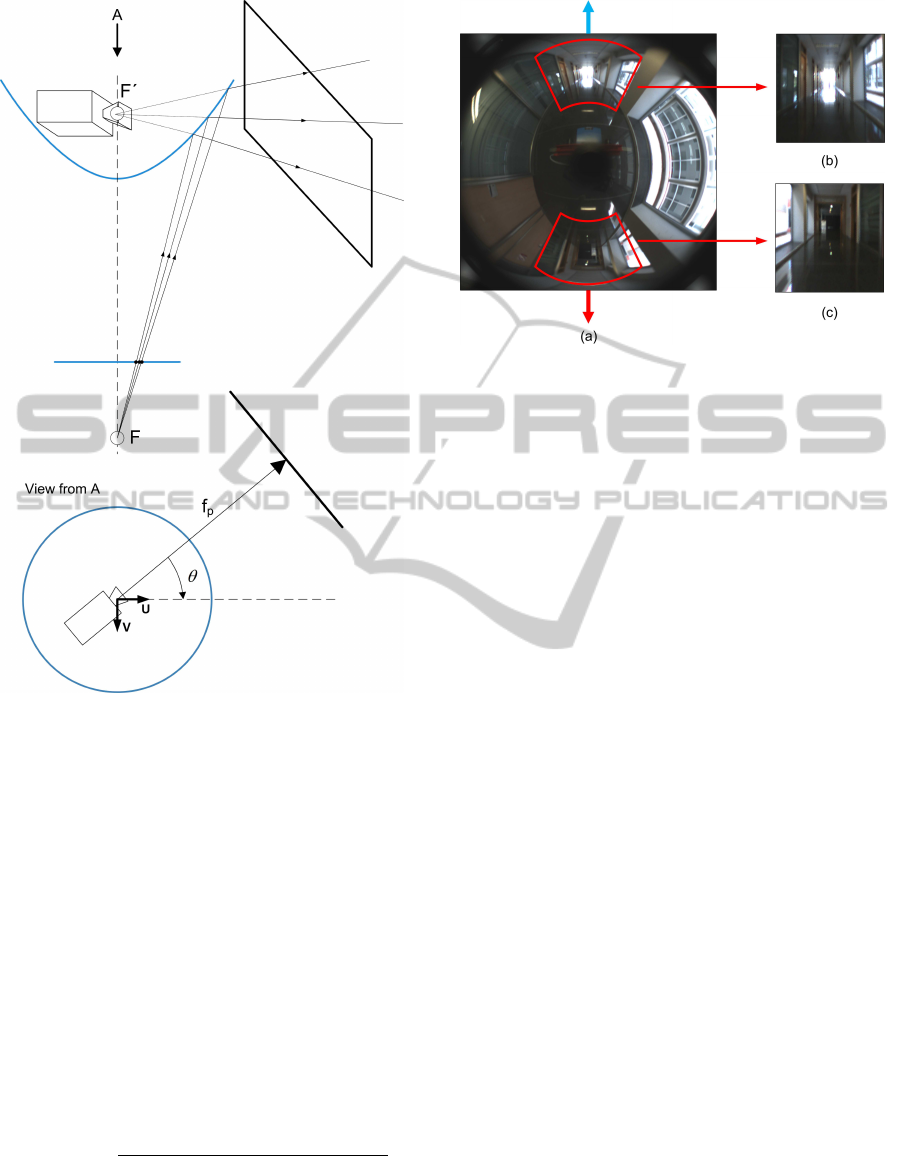
Figure 2: Representation of plane projection image from an
catadrioptic visual system.
focal changes are added in the forward direction, and
subtracted in reverse.
For each ∆fc, we compute the descriptor z
proj
∈
ℜ
1×L
. This vector is made up of the global-
appearance descriptors of both plane projection im-
ages. Taking into account the focal changes, z
proj
is
defined as:
z
proj,∆ f c
= [ z
forward, f c
central
+∆fc
, z
backward, f c
central
−∆fc
]
(1)
In order to estimate the relative displacement be-
tween two positions, denoted by i− 1 and i, the algo-
rithm computes the first position descriptor z1
i
proj,∆ fc
using different ∆ fc. Then, we compare them with
the descriptor of the second position without zoom-
ing (z2
proj,0
). The comparison is carried out using the
Euclidean distance:
d
i
proj
= min
s
L
∑
l=1
(z1
i
proj,∆ f c
(l))
2
− (z2
i−1
proj,0
(l))
2
!
∀ ∆ fc.
(2)
Figure 3: (a) Omnidirectional image, (b) forward and (c)
plane projections in the direction of travel.
Once the algorithm has carried out all the com-
parisons, we select the association with lower image
distance d
proj
. The focal difference of this associa-
tion (∆fc
i
) denotes the relative displacement between
scenes. Note that, since for the second image the algo-
rithm considers ∆ fc = 0, the focal difference between
images coincides with the ∆fc of the first image.
The absolute value |∆ fc
i
| is proportional to the
displacement magnitude, whereas its sign informs
about the direction of the movement (forward or re-
verse).
3 RELATIVE POSE ESTIMATION
USING CONSECUTIVE SCENES
In the previous section, we describe the Multi-Scale
analysis applied to omnidirectional images without
considering changes in the robot direction. However,
during a real navigation, the robot can change its di-
rection, introducing a phase lag between consecutive
images.
If we apply the Multi-Scale analysis to consecu-
tive images that present a phase lag (Figure 5 (b)), the
plane projections obtained in the direction of travel do
not present the same orientation, and their visual in-
formation would not contain the same elements of the
environment. Therefore, we must take into account
the phase change ∆θ to carry out a proper compari-
son.
Previous works (Murillo et al., 2013; Pay´a et al.,
2014) demonstrate that global-appearance descrip-
tors can cope with the problem of mobile location
and orientation estimation using omnidirectional in-
formation. Those techniques usually make use of
panoramic images. Moreover, independently of the
VisualOdometryusingtheGlobal-appearanceofOmnidirectionalImages
485
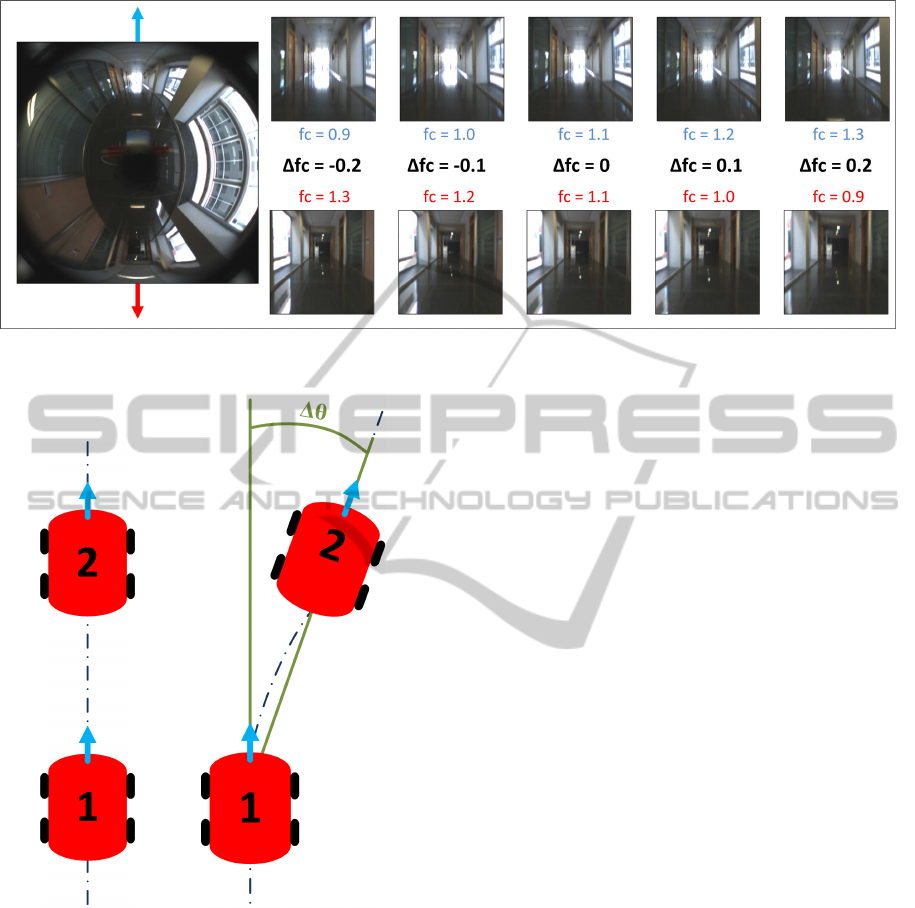
Figure 4: Change of focal length in the projective images in both forward and reverse direction in the Multi-Scale analysis.
(a) (b)
Figure 5: Example of different trajectories followed by the
robot. (a) Rectilinear trajectory and (b) trajectory with a
change of direction.
technique, we can obtain a measure of the certainty
in the estimation, by means of the euclidean distance
between phase descriptors (d
phase
).
We propose to take advantage of the ability of
global appearance descriptors to estimate the phase
lag (∆θ) between two scenes in order to determine the
directions of the plane projections to be able to com-
pare them using the Multi-Scale analysis.
Following the example in Figure 5 (b), the Multi-
Scale analysis would change first the orientation of
the plane projections of the first position, introducing
a phase lag ∆θ, with respect to the direction of travel.
That way, the plane projections of both positions will
have the same direction.
We define the pose vector [ x
i
y
i
θ
i
]
T
that includes
the coordinates on the ground plane and the orienta-
tion of the robot. When a new image arrives, we com-
pute the phase lag with the previous image, ∆θ, and
apply the Multi-Scale analysis, obtaining ∆ fc
i
. With
that information, we update the position of the robot:
x
i
y
i
θ
i
=
x
i−1
+ ∆x
i
y
i−1
+ ∆y
i
θ
i−1
+ ∆θ
, i = 1,...,n (3)
with
∆x
i
∆y
i
=
∆f c
i
· sin
θ
i
∆f c
i
· cos
θ
i
(4)
Therefore, we obtain a topological visual odome-
try system that allows the robot to estimate its current
position regarding the previous one.
4 APPLICATION TO
NAVIGATION TASKS
Used in a real navigation task, the visual odometry
system exposed in the previous section will accumu-
late the error in the pose estimation as each new image
arrives. To reduce this error, we include the detection
of previously-visited positions of the route in order to
carry out a loop closure that improves the estimation
of the path. At every iteration, the robot creates the
descriptor of the panoramic view of the current im-
age, and saves it to a database. On the other hand, it
estimates the pose of the current image n, [ x
n
y
n
θ
n
]
T
regarding the previous route pose n− 1 using Eq. 3.
ICINCO2014-11thInternationalConferenceonInformaticsinControl,AutomationandRobotics
486

Moreover, the algorithm compares the descrip-
tor of the panoramic view of the current image and
carries out a matching process with the previously
mapped locations. To that end, it calculates the Eu-
clidean distance of the current image descriptor and
the descriptors in the database.
z
i
pano
∈ ℜ
1xM
is the vector that contains the de-
scriptor of the i − th panoramic image. The image
distance between the current panoramic image (n) and
all the images included in the database is defined as:
d
i
pano
=
s
M
∑
m=1
(z
i
pano
(m))
2
− (z
n
pano
(m))
2
i = 1,. .., n. (5)
After that, the algorithm selects the association
with the minimum distance, and checks whether the
distance is lower than a fixed threshold, th
pano
:
min
d
i
pano
,i = 1, ... ,n− 20
< th
pano
(6)
If the condition is not satisfied, the algorithm in-
cludes the new pose [ x
n
y
n
θ
n
]
T
in the map, and it
waits for a new image to arrive.
On the contrary, if the condition is satisfied, the
robot supposes that the current position has been vis-
ited previously and carries out a loop closure correc-
tion, following these 3 steps:
1. Current Pose Estimation
When the algorithm detects a loop closure, the
current pose is re-estimated using the image
matched in the database (Eq. 6). i
loop
denotes the
coefficient of the matched map image. The cur-
rent pose [x
loop
, y
loop
, θ
loop
]
T
is now estimated
regarding i
loop
. For that purpose, we make use
again of Eq. 3, considering the images i
loop
and
n. It is important to highlight that the pose of i
loop
has lower uncertainty than the pose of n− 1 since
it has estimated in a previous iteration, and conse-
quently, its pose error is lower.
2. Phase Error Correction
We define the phase error as:
e
phase
= θ
loop
− θ
n
(7)
The algorithm propagates the correction of the er-
ror to the positions considered in the loop. This
correction is weighted with the uncertainty asso-
ciated in the phase estimation (d
phase
). The phases
of the poses included in the loop are re-estimated
as:
∆θ
i
= ∆θ
i
+e
phase
·
d
i
phase
∑
n
j=i
loop
d
j
phase
, i = i
loop
,. ..,n.
(8)
That way, the orientation of the last route pose is
the same that the estimated in the loop closure,
i.e.,
∆θ
n
= θ
loop
.
The correction of the phase implies a change in
the path coordinates:
x
i
y
i
θ
i
=
x
i−1
+
∆x
i
y
i−1
+
∆y
i
θ
i−1
+
∆θ
, i = i
loop
,. ..,n.
(9)
with
∆x
i
∆y
i
=
∆f c
i
· sin(
θ
i
)
∆f c
i
· cos(
θ
i
)
, i = i
loop
,. ..,n.
(10)
3. XY Positions Correction
Once we have re-estimated the poses of the route
included in the loop by correcting their phase, the
algorithm carries out a new error propagation us-
ing the XY coordinates of the pose estimated in
the loop closure [x
loop
, y
loop
]. The initial infor-
mation includes the position of the route with the
re-estimated phase [
x
i
,y
i
].
The XY position error is defined as:
e
x
e
y
=
x
loop
−
x
n
y
loop
−
y
n
(11)
The propagation of the XY correction is weighted
by the uncertainty in the relative displacement es-
timation in the Multi-Scale analysis d
i
proj
(Eq. 2).
Finally, the new coordinates of the route
x, y
T
are estimated as:
"
x
i
y
i
#
=
"
x
i−1
+ ∆x
i
y
i−1
+ ∆y
i
#
, i = i
loop
,. ..,n. (12)
with
∆x
i
∆y
i
=
∆x
i
+ e
x
·
d
i
proj
∑
n
j=i
loop
d
j
proj
∆y
i
+ e
y
·
d
i
proj
∑
n
j=i
loop
d
j
proj
(13)
After re-estimating the XY coordinates, the phase
values may change. For that reason, the algorithm
re-calculates them as:
θ
i
= arctan
y
i
− y
i−1
x
i
− x
i−1
!
(14)
VisualOdometryusingtheGlobal-appearanceofOmnidirectionalImages
487

(a) (b) (c)
Figure 6: Example of route path correction with the loop closure. (a) Detection of a previously navigated area, (b) correction
of phase estimations and (c) correction of XY coordinates and final layout.
Figure 6 shows the three steps in the loop closure.
In Figure 6 (a), the algorithm has detected a loop clo-
sure. Figure 6 (b), shows the route once the phase
error has been taken into account, and Figure 6 (c)
shows the final layout of the route after re-estimating
the XY positions.
As we can see in Eq. 6, the last 20 images are
not taken into account when considering the loop clo-
sure. Those scenes present a high similarity with the
current position scene, and would carry out a loop clo-
sure when, in fact, there is not.
5 EXPERIMENTS AND RESULTS
The objective of the experiments is to show that our
approach is able to estimate the path followed by a
robot using only visual information. Our experimen-
tal database is composed of a set of images captured
while the robot goes trough a route in a real indoor
office environment. The number of images is 1211,
captured with a frequency equal to 1Hz, with a ap-
proximate navigation speed equal to 0.1 m/s. The
scenes have been captured using a catadioptric vision
system made up of a CCD camera and a hyperbolic
mirror. The resolution of the images is 1280 × 960
pixels. We use two different projections of each om-
nidirectional image. On the one hand, the panoramic
projections allow us to estimate the phase lag between
consecutive positions, and to detect loop closures. On
the other, the Multi-Scale analysis uses plane projec-
tive images. The resolution of the panoramic views
is 128 × 512 pixels. Regarding the plane projection
images, its resolution is 256× 256 pixels. The acqui-
sition of the omnidirectional images has been carried
out using a robot Pioneer P3-AT, equipped with a laser
rangefinder.
Figure 7 shows the route followed by the robot.
Specifically, the robot navigates along a laboratory,
corridors and common areas of a building. The path
estimated with the laser data is shown in blue, which
is used as our ground truth. It should be pointed out
that there exist numerous windowsin the building that
cause important changes in the lighting conditions.
Moreover, the path includes a slope in the floor.
Figure 7: Route layout obtained from laser rangefinder
(Ground Truth).
Regarding the global descriptors, we use the
Fourier Signature (Menegatti et al., 2004) for both
the panoramic view and the plane projections. The
Fourier Signature is divided in two terms: the magni-
tudes of the transform, that permits associating scenes
(both the panoramic images during the loop closure
and the plane projections images in the Multi-Scale
analysis), and the arguments, that contain information
about the spatial distribution of the elements included
in the scene. Applied to panoramic images, the mag-
ICINCO2014-11thInternationalConferenceonInformaticsinControl,AutomationandRobotics
488
nitudes are invariant to rotations, and the arguments
allow us to estimate the phase lag between two scenes.
N denotes the number of magnitude components se-
lected in the Fourier Transform of each row, whereas
N
rot
is the number of arguments.
In the panoramic image, we set N
rot
= 32, and N
will be determined in a subsequent experiment. Re-
garding the plane projection image, the Multi-Scale
analysis shows a correct performance with N = 16 el-
ements in the image descriptor. The information of ar-
guments is not used in this case. Regarding the scales,
we use fc ∈ [1.0− 1.2], with ∆ fc = 0.01.
Since we use a topological approach, the estima-
tion we obtain is expected to be similar to the actual
trajectory except for a scale factor. Taking this into
account, to know the accuracy of the results, we mea-
sure the error using the Procrustes analysis (Kendall,
1989; Dryden and Mardia, 1998). This analysis re-
turns a standardized disparity measure µ ∈ [0,1] of the
shape difference between the ground truth and the es-
timated path. µ = 0 indicates that the reconstruction
of the route has exactly the same shape that the real
layout, i.e., there is no error.
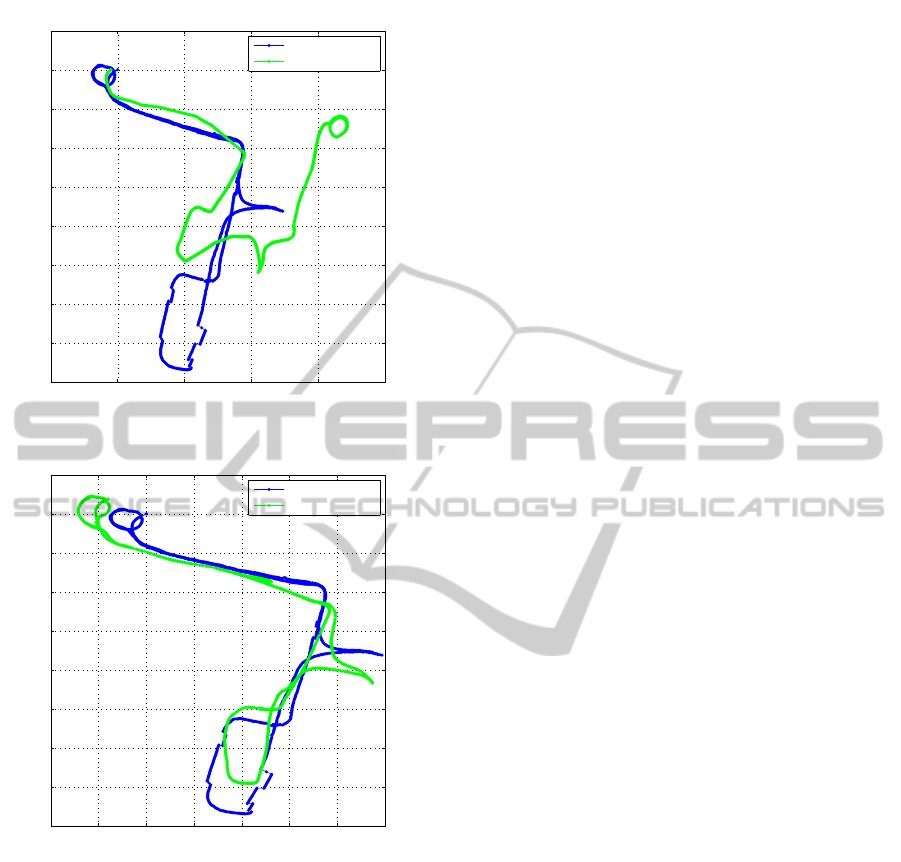
Without considering loop closures, the algorithm
accumulates the error associated to the pose estima-
tion. The Procrustes analysis returns µ = 0.5596. In
Fig. 8 (a) two different paths are represented : in blue,
the ground truth, and in green, the estimation of our
algorithm. In this representation, the scale of our esti-
mated path has been adapted to allow the comparison
with the ground truth, since the ground truth is in me-
ters, and our estimation is in ∆fc.
Table 1 shows the results for different values of N
(number of magnitude components per row selected
in the Fourier Signature of the panoramic image), and
the threshold th
pano
(Eq. 6). We can check that, in
all the configurations, the error is considerably lower
than the results when the algorithm does not consider
loop closures. We highlight the minimum error in
bold, obtained when N = 8 andth
pano
= 3.3. The esti-
mation of the path using those parameters is shown in
Fig. 8 (b). It is possible to check visually that our al-
gorithm estimates the robot path with accuracy com-
paring to the real layout when using loop closures.
6 CONCLUSIONS
In this work, we have presented a topological vi-
sual odometry system based on the global-appearance
of omnidirectional information. This system adapts
the Multi-Scale analysis, which provides a topolog-
ical measure of displacement between plane projec-
tion images, to omnidirectional images. Moreover, a
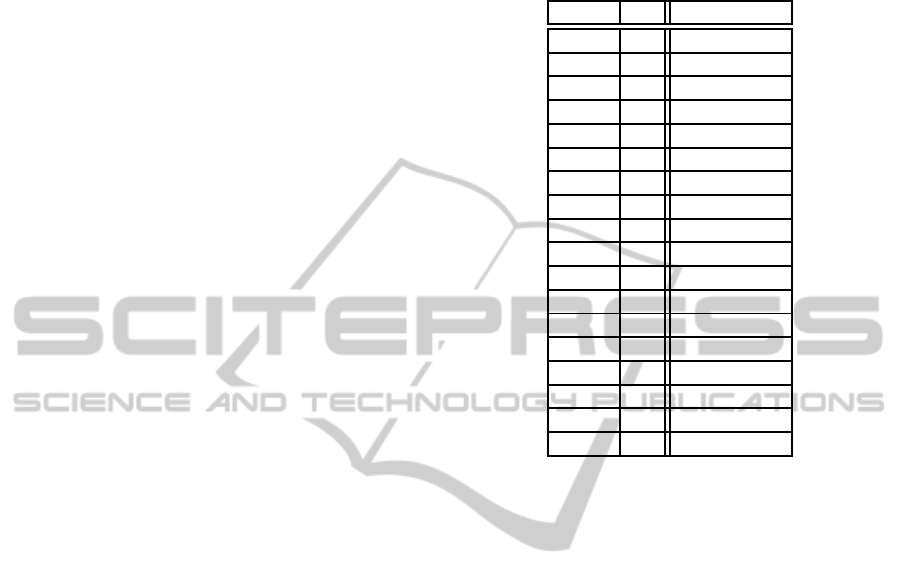
Table 1: Error in the route path estimation using Procrustes
Analysis (µ) varying the loop closure threshold (th
pano
) and
the localization descriptor parameter (N) using the Fourier
Signature.
th
pano
N µ
2,30 8 0,0505
2,30 16 0,0735
2,30 32 0,0574
2,50 8 0,0565
2,50 16 0,0948
2,50 32 0,0578
2,90 8 0,0485
2,90 16 0,0449
2,90 32 0,0935
3,10 8 0,0447
3,10 16 0,0550
3,10 32 0,0949
3,30 8 0,0383
3,30 16 0,0532
3,30 32 0,0424
3,50 8 0,4656
3,50 16 0,0744
3,50 32 0,0539
loop closure detection is introduced in the algorithm
to reduce the accumulated error of the system. The
loop closure also uses global appearance techniques
to determine if the current image matches with a pre-
viously visited area.
The experimental results demonstrate that our vi-
sual odometry system is able to estimate the path fol-
lowed by the robot with a similar layout to the real
one, except for a scale factor. Regarding the loop clo-
sure detection, it reduces considerably the error in the
path estimation. However, the results strongly depend
on the association image threshold. If this threshold is
too small, the image association is more reliable, but
we reduce the number of loop closures. On the con-
trary, if the threshold is excessively high, the system
might carry out false image association, and therefore,
erroneous loop closures.
The results of this method encourage us to con-
tinue the research in topological visual odometry sys-
tems using the global-appearance of images. It might
be interesting to extend this study to outdoor environ-
ments navigation. We can also consider the improve-
ment of the loop closure estimation, re-estimating
again the scene displacement with the Multi-Scale
analysis after the phase correction, or comparing the
results using different global-appearance descriptors.
VisualOdometryusingtheGlobal-appearanceofOmnidirectionalImages
489
−10 0 10 20 30 40
−40
−35
−30
−25
−20
−15
−10
−5
0
5
[m]
[m]
Without Loop Closure
Ground Truth
Estimated Path
(a)
−10 −5 0 5 10 15 20 25
−40
−35
−30
−25
−20
−15
−10
−5
0
5
[m]
[m]
With Loop Closure
Ground Truth
Estimated Path
(b)
Figure 8: Graphical representation of the ground truth route
and our visual odometry system path estimation (a) without
loop closure corrections and (b) with loop closure correc-
tions.
ACKNOWLEDGEMENTS
This work has been supported by the Spanish govern-
ment through the project DPI2010-15308.
REFERENCES
Amor´os, F., Pay´a, L., Reinoso, O., Mayol-Cuevas, W., and
Calway, A. (2013). Topological map building and
path estimation using global-appearance image de-
scriptors. In 10th Int. Conf. on Informatics in Con-
trol, Automation and Robotics (ICINCO 2013), pages
385–392, Reykjavik, Iceland. SciTePress.
Bay, H., Ess, A., Tuytelaars, T., and Van Gool, L. (2008).
Speeded-up robust features (surf). Comput. Vis. Image
Underst., 110(3):346–359.
Cummins, M. and Newman, P. (2011). Appearance-only
slam at large scale with fab-map 2.0. Int. J. Rob. Res.,
30(9):1100–1123.
Dryden, I. and Mardia, K. (1998). Statistical shape analy-
sis. Wiley series in probability and statistics. Wiley.
Gartshore, R., Aguado, A., and Galambos, C. (2002). In-
cremental map building using an occupancy grid for
an autonomous monocular robot. In 7th Int. Conf.
on Control, Automation, Robotics and Vision, 2002.
ICARCV 2002., volume 2, pages 613 – 618 vol.2.
Kendall, D. (1989). A survey of the statistical theory of
shape. volume 4, pages 87–99.
Krose, B., Bunschoten, R., Hagen, S., Terwijn, B., and
Vlassis, N. (2007). Visual homing in enviroments with
anisotropic landmark distrubution. In Autonomous
Robots, 23(3), 2007, pp. 231-245.
Kunttu, I., Lepisto, L., Rauhamaa, J., and Visa, A. (2004).
Multiscale fourier descriptor for shape-based image
retrieval. In Proceedings of the 17th International
Conference on Pattern Recognition, ICPR 2004, vol-
ume 2, pages 765 – 768 Vol.2.
Lingua, A., Marenchino, D., and Nex, F. (2009). Perfor-
mance analysis of the sift operator for automatic fea-
ture extraction and matching in photogrammetric ap-
plications. Sensors, 9(5):3745–3766.
Lowe, D. (2004). Distinctive image features from scale-
invariant keypoints. Int. J. Comput. Vision, 60(2):91–
110.
Menegatti, E., Maeda, T., and Ishiguro, H. (2004). Image-
based memory for robot navigation using properties
of omnidirectional images. Robotics and Autonomous
Systems, 47(4):251 – 267.
Milford, M., Wyeth, G., and Prasser, D. (2004). Simul-
taneous localisation and mapping from natural land-
marks using ratslam. In Australasian Conference
on Robotics and Automation, Canberra. Australian
Robotics and Automation Association Inc.
Moravec, H. and Elfes, A. (1985). High resolution maps
from wide angle sonar. In Proc. IEEE Int. Conf. on
Robotics and Automation, volume 2, pages 116 – 121.
Murillo, A., Guerrero, J., and Sagues, C. (2007). Surf fea-
tures for efficient robot localization with omnidirec-
tional images. In IEEE Int. Conf. on Robotics and
Automation, pages 3901 –3907.
Murillo, A., Singh, G., Kosecka, J., and Guerrero, J.
(2013). Localization in urban environments using
a panoramic gist descriptor. IEEE Transactions on
Robotics, 29(1):146–160.
Pay´a, L., Amor´os, F., Fern´andez, L., and Reinoso, O.
(2014). Performance of global-appearance descrip-
tors in map building and localization using omnidi-
rectional vision. Sensors, 14(2):3033–3064.
ICINCO2014-11thInternationalConferenceonInformaticsinControl,AutomationandRobotics
490
