
ECG-based Detection of Left Ventricle Hypertrophy
Gabriel Tozatto Zago
1
, Rodrigo Varejão Andreão
2
and Mário Sarcinelli Filho
3
1
Industrial Automation Department, Federal Institut of Espírito Santo, Linhares, Brazil
2
Electrical Engineering Department, Federal Institut of Espírito Santo, Vitória, Brazil
3
Graduate Program of Electrical Engineering, Federal University of Espírito Santo, Vitória, Brazil
Keywords: Left Ventricle Hypertrophy, Electrocardiogram, Segmentation.
Abstract: This works proposes an electrocardiogram based approach for left ventricle hypertrophy (LVH)
classification. LVH classification is based on features extracted from the ECG signal, where the main
features are the ones related to the QRS wave amplitude and duration. Instead of working on only one LVH
criteria, we employed a score which explores the complementarity of the best criteria through a fusion
strategy. The best criteria are the ones which discriminate normal and LVH ECGs according to the t-test.
We carried out experiments in a database with a group of fifty men, where a half has LVH. The gold
standard to detect LVH was the left ventricle mass index measured using echocardiography. Our approach
achieved a sensitivity of 69.7%, outperforming all LVH criteria.
1 INTRODUCTION
Left Ventricle Hypertrophy (LVH) is an important
risk factor for cardiovascular morbidity and
mortality, including sudden death (Kreger et al.,
1987; Haider et al., 1998). The causes of LVH
include obesity, increased blood viscosity, volume
and pressure overload, and also non-pathological
conditions, like in the case of some athletes where
LVH is a normal adaptation of the myocardium. In
chronic hypertension, which is characterized by
changes in pressure and blood volume, structural
changes in the myocardium usually occurs, leading
to an increase in the mass of the left ventricle (LV)
(Ganau et al. 1992). This mass increase can be
detected and quantified by the echocardiogram,
which is the gold standard for LVH. On the other
hand, the electrocardiogram (ECG) can also be
employed in LVH detection, although the diagnosis
is qualitative, suggesting the presence or absence of
LVH. In spite of that, the ECG is an exam widely
employed to assess the condition of the heart, taking
advantage of being easy to perform, noninvasive and
cheap. These advantages make the ECG analysis an
important step in the diagnosis of LVH.
Many criteria have been used to diagnose LVH
through ECG, most of them employing the
amplitude and duration of the QRS complex
(Hancock et al., 2009; Mazzaro et al., 2008), since
this wave reflects ventricular depolarization.
However, there is no agreement among experts
about which criterion is more reliable and should,
therefore, be used.
In this context, this work investigates the
correlation between the electrocardiographic
measurements and LVH. Furthermore, in order to
explore the complementarity of the criteria proposed
so far (Hancock et al., 2009; Mazzaro et al., 2008),
this work proposes an original score based on the
combination of the results of the best criteria. In our
experiments, the criteria are implemented and tested
in the same database composed of normal and LVH
ECGs. The results are then compared against the
echocardiogram report of the same individuals in the
database.
2 MATERIALS AND METHODS
2.1 Left Ventricle Hypertrophy
LVH is defined as the thickening of the walls of the
left ventricle, the main chamber of the heart. The
gold standard for LVH detection is the
echocardiogram, which uses ultrasound waves to
measure the thickness of the ventricle. The left
ventricle mass is then calculated by approximating
the geometry and density of this chamber. However,
the mass of the ventricle varies with the height of the
17
Tozatto Zago G., Andreão R. and Sarcinelli Filho M..
ECG-based Detection of Left Ventricle Hypertrophy.
DOI: 10.5220/0005069600170021
In Proceedings of the 2nd International Congress on Cardiovascular Technologies (CARDIOTECHNIX-2014), pages 17-21
ISBN: 978-989-758-055-0
Copyright
c
2014 SCITEPRESS (Science and Technology Publications, Lda.)

patient. This way, the left ventricle mass could
indicate LVH for a 1.60 m tall patient, but not for a
1.90 m one. As a consequence, the left ventricle
mass is indexed (LVMI) by height, or
.
, (1)
where is the left ventricle mass in grams and
is the height of the patient in meters.
The ECG is another exam employed for LVH
diagnosis. Besides being insensitive in detecting
anatomic LVH and limited to obtain a quantitative
measure of left ventricle mass, the ECG is used to
infer qualitatively if the left ventricle is
hypertrophied. A plenty of methods are used by the
physicians to detect LVH through the ECG. Most of
them uses the amplitude and the width of the QRS
complex (Hancock et al., 2009). However, there is
no agreement among the experts about which
method is the most reliable. The methods used by
the physicians can not keep specificity (rate of
normal patients correctly classified) and sensibility
(rate of LVH patients correctly classified) high at the
same time. Indeed, to classify most of the LVH
patients correctly some normal patients will also be
classified as LVH, and vice-versa.
In order to find out which is the best method to
detect LVH through the ECG, several methods yet
proposed in the literature are tested, including
additional characteristics extracted from the ECG, as
follows:
The peak amplitude of the QRS and T waves
in all 12 leads.
The duration of several intervals in the ECG
in all 12 leads.
The area of the QRS complex and of some
intervals in the ECG.
The angle of the electric axis of the heart.
The presence of the strain pattern (Roman et
al., 1987).
The main methods tested in this work are
described in (Hancock et al., 2009) and the ones that
achieved the best results are explained later in the
table of results.
2.2 ECG Processing
In order to build a fully automatic method to detect
LVH, the following steps are required:
ECG segmentation,
ECG feature extraction,
LVH patient classification.
The first step is based on an automatic
segmentation algorithm of the 12 lead ECG. In this
work, the segmentation provides the following ECG
features:
The beginning, peak and end of the QRS
complex,
The peak and end of the T wave.
The main feature is the peak of the QRS
complex. From the peak position in time, all the
other features are obtained. Our QRS peak detection
algorithm is based on (Hamilton, 2002). From the
QRS peak, a search for the onset and offset of the
QRS complex is performed backward in order to
find the plateau of the PQ interval, and forward until
finding a decrease in the slope just after the J point.
For the detection of the T wave peak, we have
employed an algorithm based on the Mexican Hat
Wavelet Transform. Among de ECG features, the
most difficult to detect precisely is the end of the T
wave (T wave offset). Even experienced experts
differ from each other when determining the end of
the T wave. Several algorithms have been proposed
so far to detect the end of such wave (Martínez,
2004; Zhou, 2009; Zhou 2011). We have chosen a
simple and accurate algorithm developed in (Zhang,
2006), which is based on the area under the T wave.
From the ECG segmentation, some features
related to amplitudes and intervals are extracted
from all 12-ECG leads. The whole set of features
include patient data like blood pressure and body
mass. It is important to emphasize that we have
included features from the R, S and T wave
amplitude and duration, the area under the QRS
complex, the QT interval and the interval between
the Q wave and the T wave peaks, the electrical axis
and the strain pattern, besides the features already
used so far by the cardiologists (Hancock et al.,
2009).
The extracted ECG features are then combined
according to each LVH criteria. Some selected
criteria are summarized below:
(Grant,
1957): the greatest sum of the R and S wave
amplitudes among the precordial
leads.
(Gubner and Ungerleider,
1943): the sum of the wave amplitude in
lead and the S wave amplitude in lead.
(Mazzaro et al., 2008): the highest
or peaks among the precordial leads
multiplied by the duration of the
complex in that lead.
CARDIOTECHNIX2014-InternationalCongressonCardiovascularTechnologies
18

(Gubner and Ungerleider, 1943): wave
amplitude in lead .
(Lewis, 1914):
the sum of the difference between the and
amplitudes in lead and the and
amplitudes in lead .
(Sokolow and Lyon, 1949): amplitude
of wave in lead .
: the area under the
complex in lead .
Systolic Pressure: physiological measure
contained in the database.
: the area under the
complex in lead .
:amplitude of the wave in lead .
When a criterion is satisfied, the ECG is
classified as LVH. All criteria require threshold
which separates LVH and normal ECGs. The
threshold is determined with the help of the ROC
curve, which is a technique to visualize, organize
and select classifiers based on their performance
(Fawcett, 2006). In this kind of two dimensional
plot, the Y axis is the True Positive Rate and the X
axis is the False Positive Rate. We have chosen the
threshold which satisfies a false positive rate of 25%
(specificity of 75%). This step is not necessary for
the criteria proposed in the literature because the
thresholds are already defined.
2.3 Score Fusion
The original method proposed in this paper consists
in fusing the methods explained earlier generating a
single score which is used to assess LVH. The
fusion strategy is based on the number of criteria
which exceeds the thresholds found on the previous
step. This way, the score is a number that represents
the probability that patient has LVH.
3 EXPERIMENTS
3.1 Database
The database used is a subset of the MONICA2
Database that follow the guidelines established by
the WHO MONICA Project (The World Health
Organization MONICA Project: monitoring trends
and determinants in cardiovascular diseases)
(Tunstall-Pedoe et al., 1994).
The study sample was chosen after a random
selection of householders in 1999, when 2068
subjects were invited to participate in the study,
from a population of 142,913 people of both genders
with ages ranging from 25 to 64 years. From the
selected subjects, 1661 agreed to participate in the
study and went to the Hospital Universitário
Cassiano Antonio Moraes in Vitória, Brazil, for
clinical and laboratory examination, so that the
prevalence of cardiovascular risk factors could be
determined.
In 2004 and 2005, these subjects were recruited
again for the continuation phase of the WHO
MONICA Project in Vitoria and underwent repeat
clinical and laboratory evaluation, in addition to
echocardiographic examination. From the initial
sample, 652 agreed to participate in the second
phase of the study.
The study published in (Angelo et al., 2007)
creates a subsample of normal subjects and realizes
a study of the LVMI (calculated through the
echocardiogram) in this group of healthy subjects.
The results show that the upper limit for the LVMI
(defined by the 95% percentile) are:
LVMI = 46.6 for the complete subset,
LVMI = 46.4 for the female subset,
LVMI = 47.7 for the male subset.
This way, patients with LVMI beneath those
values are considered normal. The subset used in
this paper is composed by 50 male subjects without
any kind of heart block, where 25 subjects have
LVMI greater than 47.7 and the other 25 subjects
have LVMI smaller than it. The subjects were
selected randomly following the requirement that the
age of the two groups were as close as possible
(normal:, 58.73,10.15 and LVH:,
59.27,8.99). This way differences in the age
wouldn’t compromise the analysis of the clinical
data.
3.2 Results and Discussion
First of all, we have assessed the performance of
each LVH criteria separately, as follows:
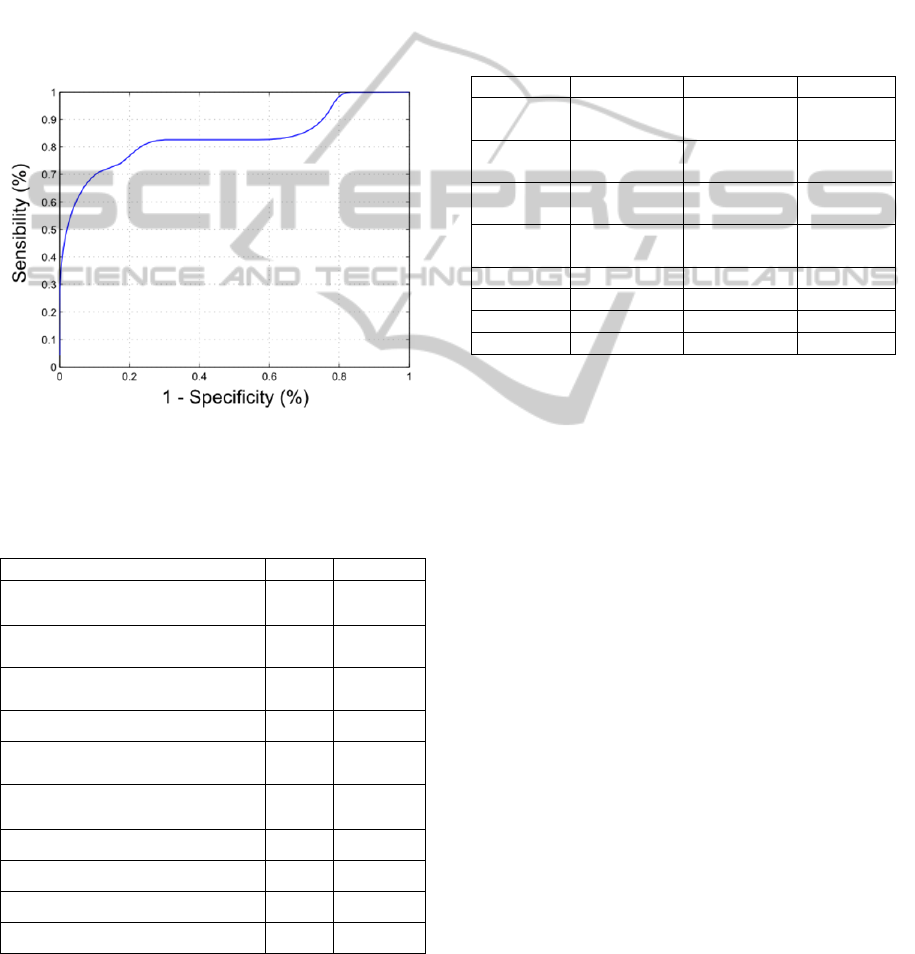
1. ROC curve: employing the ROC curve
method, we have analyzed the cost (False
Positive Rate, also shown as 1
) and the benefit (True Positive
Rate or sensibility) of the classifier. An
example of a ROC curve is shown in Figure
1.
2. Hypothesis test for separable groups: it was
carried out a paired t-test with the null
hypothesis that the difference between the
normal and the LVH groups (y-x) is a zero-
ECG-basedDetectionofLeftVentricleHypertrophy
19
mean normal distribution. If the hypothesis is
accepted with significance level of 5%, the
groups are non-separable.
Table 1 presents the results of the area under de
ROC curve (AUC) as well as the p-value for the
hypothesis test for separable groups. We observe the
best criteria for group separation are those related to
the QRS amplitude or duration. Thus, it is clear that
LVH causes much larger changes in the QRS
complex than in other ECG waves. It is also evident
that the features with lower p-value have higher
AUC, showing that they are good for group
separation, as expected.
Figure 1: ROC Curve for the method proposed in (Grant,
1957).
Table 1: Best ten LVH criteria sorted from the highest
AUCs (area under the ROC curve), which p-value
indicates difference between normal and LVH groups.
Feature AUC p-value
(Grant, 1957)
0.82 <0.001
(Gubner and Ungerleider, 1943)
0.81 <0.001
(Lewis,
1914)
0.81 <0.005
(Sokolow and Lyon, 1949)
0.80 <0.005
(Gubner and Ungerleider,
1943)
0.79 <0.001
(Mazzaro et al., 2008)
0.78 <0.001
0.77 <0.005
0.76 <0.005
0.74 <0.005
0.74 <0.005
Actually, the list of LVH criteria is bigger than
the one of Table 1. In fact, we have tested forty
different criteria, employing the features discussed
in the previous section. Considering all the tested
criteria, we carried out the score fusion for LVH
classification. The score fusion method can be
configured according to a sensibility or specificity
goal. In this article, we have selected two different
goals: high sensibility or high specificity. Our results
of score fusion are presented in Table 2, together
with the results obtained by Mazzaro (2008), who
uses a database of 1200 patients.
Table 2: Performance for LVH detection of several
methods.
Method Sensitivity
(%)
Specificity
(%)
Accuracy
(%)
Romhilt-
Estes
16.3 95.8 66.7
Sokolow-
Lyon
13.4 96.8 66.3
Cornell
voltage
18.8 96.8 68.3
Cornell
duration
22.2 96.0 69.0
Perugia 38.6 89.6 71.0
Mazzaro 35.2 88.7 68.7
Score > 10 82.6 69.6 60.3
Score > 18 69.7 95.6 62.3
From Table 2, we observe that the fusion score
developed here improves sensitivity and specificity.
While the criterion Romhilt-Estes shows sensitivity
of only 16.3% for a specificity of 95.8%, this work
(using the score equal to 18, for example) achieved
specificity of 95.6% and sensitivity of 69.7%, far
higher than the previous method.
The accuracy of the criteria presented by
Mazzaro (2008) is higher than the accuracy of the
score presented here, because the database there
used has much more normal than LVH patients
(higher specificity rates result in higher accuracy
rates). A meaningful difference in methodology
between this work and (Mazzaro, 2008) is that the
system implemented here, from ECG segmentation
till LVH classification, is fully automatic.
4 CONCLUSIONS
In this article, we presented a system for LVH
classification from 12-lead ECG records. A set of
features extracted from the ECG signal were used as
input for our classifier. Our experiments considered
different LVH criteria, most of them based on ECG
features. The gold standard for LVH classification
was the mass of the left ventricle obtained by
CARDIOTECHNIX2014-InternationalCongressonCardiovascularTechnologies
20

echocardiography examination, indexed to patient
height raised to 2.7 (
.
).
Our experiments pointed out that the features
that best correlate with LVMI are the ones related to
the QRS complex amplitude and duration.
Moreover, we have proposed a score which is based
on combination of results of several criteria. The
performance of our score was greater than the
criteria used by experts, with specificity and
sensitivity equal to 95.6% and 69.7%, respectively.
As future work, we plan to test our system in a
bigger database, in order to confirm the consistency
of our results. Furthermore, it would be interesting
to conduct a physiological analysis of the results
presented here to explain the reasons why those
ECG waves or features are modified by LVH.
Finally, our algorithm will be tested in a
telecardiology project where abnormal ECGs will be
prioritized to have a report from the cardiologist.
ACKNOWLEDGEMENTS
We thank CAPES, an agency of the Brazilian
Ministry of Education, for the financial support
provided.
REFERENCES
Angelo, L. C. S., Vieira, M. L. C., Rodrigues, S. L.,
Morelato, R. L., Pereira, A. C., Mill, J. G., e Krieger,
J. E., 2007. Echocardiographic reference values in a
sample of asymptomatic adult brazilian population.
Arquivos Brasileiros de Cardiologia, 89(3):184–190.
Fawcett, T., 2006. An introduction to roc analysis. Pattern
Recognition Letters, 27(8):861–874.
Ganau, A., Devereux, R. B., Roman, M. J., De Simone,
G., Pickering, T. G., e Saba, P. S., 1992. Patterns of
left ventricular hypertrophy and geometric
remodelling in essential hypertension. Journal of the
American College of Cardiology, 19(7):1550–1558.
Grant, R. P., 1957. Clinical Electrocardiography: The
Spatial Vector Approach. Gubner, R. e Ungerleider, H.
E. (1943). Electrocardiographic criteria of left
ventricular hypertrophy. Arch Intern Med, 72:196–
209.
Haider, A. W., Larson, M. G., Benjamin, E. J., e Levy, D.,
1998. Increased left ventricular mass and hypertrophy
are associated with increased risk for sudden death.
Journal of the American College of Cardiology,
32(5):1454–1459.
Hamilton, P., 2002. Open source ecg analysis. Computers
in Cardiology, volume 29, pages 101–104.
Hancock, E. W., Deal, B. J., Mirvis, D. M., Okin, P.,
Kligfield, P., e Gettes, L. S., 2009. Aha/accf/hrs
recommendations for the standardization and
interpretation of the electrocardiogram. part v:
Electrocardiogram changes associated with cardiac
chamber hypertrophy a scientific statement from the
american heart association electrocardiography and
arrhythmias committee, council on clinical cardiology;
the american college of cardiology foundation; and the
heart rhythm society. Journal of the American College
of Cardiology, 53(11):992–1002.
Kreger, B. E., Cupples, L. A., e Kannel,W. B., 1987. The
electrocardiogram in prediction of sudden death:
Framingham study experience. American Heart
Journal, 113(2 I):377–382.
Lewis, T., 1914. Observations upon ventricular
hypertrophy with especial reference preponderance of
one or other chamber. Heart, 5:367–403.
Martínez, J. P., Almeida, R., Olmos, S., Rocha, A. P., e
Laguna, P. (2004). A wavelet-based ecg delineator
evaluation on standard databases. IEEE Transactions
on Biomedical Engineering, 51(4):570–581.
Mazzaro, C. D. L., Costa, F. D. A., Bombig, M. T. N.,
Luna Filho, B., De Paola, Â. A. V., Carvalho, A. C. D.
C., Da Costa, W., Fonseca, F. A. H., e Póvoa, R. M.
D. S., 2008.Ventricular mass and electrocardiographic
criteria of hypertrophy: Evaluation of new score.
Arquivos Brasileiros de Cardiologia, 90(4):227–
231+249–253.
Roman, M. J., Kligfield, P., e Devereux, R. B., 1987.
Geometric and functional correlates of electrocardio-
graphic repolarization and voltage abnormalities in
aortic regurgitation. Journal of the American College
of Cardiology, 9(3):500–508.
Sokolow, M. e Lyon, T. P., 1949. The ventricular complex
in left ventricular hypertrophy as obtained by unipolar
precordial and limb leads. American Heart Journal,
37(2):161–186.
Tunstall-Pedoe, H., Kuulasmaa, K., Amouyel, P., Arveiler,
D., Rajakangas, A. M., e Pajak, A., 1994. Myocardial
infarction and coronary deaths in the world health
organization MONICA project: Registration
procedures, event rates, and case-fatality rates in 38
populations from 21 countries in four continents.
Circulation, 90(1):583–612.
Zhang, Q., Manriquez, A. I., Médigue, C., Papelier, Y., e
Sorine, M., 2006. An algorithm for robust and
efficient location of t-wave ends in electrocar-
diograms. IEEE Transactions on Biomedical
Engineering, 53(12):2544–2552.
Zhou, S. H., Helfenbein, E. D., Lindauer, J. M., Gregg, R.
E., e Feild, D. Q. (2009). Philips qt interval
measurement algorithms for diagnostic, ambulatory,
and patient monitoring ecg applications. Annals of
Noninvasive Electrocardiology, 14(SUPPL. 1):S3–S8.
Zhou, X. eWei, D. (2011). A multidifferentiator-based
approach to the reliable determination of t-wave offset
in electrocardiograms. Journal of electrocardiology,
44(3):330–339.
ECG-basedDetectionofLeftVentricleHypertrophy
21
