
SoC Processor Discovery for Program Execution Matching Using
Unsupervised Machine Learning
Avi Bleiweiss
Platform Engineering Group, Intel Corporation, Santa Clara, U.S.A.
Keywords:
SoC, Mixture Model, Clustering, Likelihood, Expectation-Maximization, KNN, Ranked Information Re-
trieval.
Abstract:
The fast cadence for evolving mobile compute systems, often extends their default processor configuration by
incorporating task specific, companion cores. In this setting, the problem of matching a compute program to
efficiently execute on a dynamically selected processor, poses a considerable challenge to employing tradi-
tional compiler technology. Rather, we propose an unsupervised machine learning methodology that mines a
large data corpus of unlabeled compute programs, with the objective to discover optimal program-processor
relations. In our work, we regard a compute program as a text document, comprised of a linear sequence of
bytecode mnemonics, and further transformed into an effective representation of a bag of instruction term fre-
quencies. Respectively, a set of concise instruction vectors is forwarded onto a finite mixture model, to identify
unsolicited cluster patterns of source-target compute pairings, using the expectation-maximization algorithm.
For classification, we explore k-nearest neighbor and ranked information retrieval methods, and evaluate our
system by simultaneously varying the dimensionality of the training set and the SoC processor formation. We
report robust performance results on both the discovery of relational clusters and feature matching.
1 INTRODUCTION
Mobile devices embody a system-on-a-chip (SoC)
circuit technology that integrates a diverse set of pro-
cessing elements, a shared memory subsystem, and
several communication components. The most basic
architectural configuration of SoC processors com-
prises a multi core CPU, a graphics processing unit
(GPU), and at least one image signal processor (ISP).
But in recent years, the landscape of SoC compute ca-
pacity transformed notably, with vendors advance to
add companion cores and application specific, com-
putation units. Of significance role model are Qual-
comm, who introduced a digital signal processor
(DSP), destined primarily for audio processing, Apple
announced a dedicated motion processor, formed as a
hub for manipulating sensor data, and Motorola added
computational cores, subscribing to natural language
processing (NLP) and contextual computing. This
trend of increased SoC processor divergence, while
holding compelling functional merits, raises nonethe-
less a power efficiency and utilization challenges, as
cores remain idling for extended periods of time.
Modern mobile computing platforms (Render-
script, 2011) (Augonnet, 2011), have since progressed
and are designed to ensure processors are utilized ef-
ficiently, by scheduling programs to run concurrently
on the SoC. More importantly, these frameworks pro-
mote a dynamic selection approach, to best match a
target processor for executing a bound compute pro-
gram, at runtime. However, we contend that deploy-
ing compiler technology to the program-processor
pairing task, on an individual program basis, is lim-
ited in its parametric scope and hence suboptimal.
Rather, we propose a discovery (Rajaraman and Ull-
man, 2011) method that extracts a statistical, proces-
sor relation model from a large data set of thousands
of compute programs, and incorporates both informa-
tion retrieval (Manning et al., 2008) and unsupervised
machine learning (Duda et al., 2001) techniques. In-
formation retrieval (IR) is fast becoming the domi-
nant form of data source access. Amongst many do-
mains, it encompasses the field of grouping a set of
documents that enclose non structured content, to be-
have similarly with respect to relevance to informa-
tion needs. Our work closely leverages IR practices
by realizing a compute program as a text document,
composed of a collection of instruction keywords, and
represented in a compact histogram of term frequen-
cies format. Furthermore, we are interested in uncov-
192
Bleiweiss A..
SoC Processor Discovery for Program Execution Matching Using Unsupervised Machine Learning.
DOI: 10.5220/0005070301920201
In Proceedings of the International Conference on Knowledge Discovery and Information Retrieval (KDIR-2014), pages 192-201
ISBN: 978-989-758-048-2
Copyright
c
2014 SCITEPRESS (Science and Technology Publications, Lda.)

Table 1: Dalvik bytecode operational categories, listing opcode mnemonics that are type and operand layout independent.
LoadStore Construction Jump Compare IfTest Test UnaryOp BinaryOp
move new-instance goto cmp if-eq, if-ne instance-of neg add, sub
const new-array packed-switch cmpl if-lt, if-le check-cast not mul, div
fill-array-data filled-new-array sparse-switch cmpg if-gt, if-ge cvt rem
array-length invoke and, or
get return xor
put throw shl, shr
ering the underlying cluster nature of a large set of
compute programs, to establish a concrete relation-
ship between a program partition to a specific, SoC
processor target. In this context, we use finite mixture
models (Mclachlan and Peel, 2000), recognized for
providing effective and formal statistical framework,
to cluster high dimensional data of continuous nature.
Finite mixture models are widely used in the do-
main of cluster analysis (Fraley and Raftery, 2002)
(Fraley and Raftery, 2007), and apply to a growing
application space, including web content search, gene
expression linking, and image segmentation. They
form an expressive set of classes for multivariate den-
sity estimation, and the entire observeddata set is rep-
resented by a mixture of either continuous or discrete,
parametric distribution functions. An individual dis-
tribution, often referred to as a component distribu-
tion, constitutes thereof a cluster. Traditionally, the
likelihood paradigm provides a mechanism for esti-
mating the unknownparametersof the mixture model,
by deploying a method that iterates over the max-
imum likelihood. Upon completion, the likelihood
function reflects the conformity of the model to the
incomplete observed data. One of the more broadly
used and well behaved technique to guarantee process
convergence, is the Expectation-Maximization (EM)
algorithm (Dempster et al., 1977) that scales well with
increased data set size. While not immediately ap-
plicable to our work, noteworthy is the research that
further extends the empirical likelihood paradigm to
a model, whose component dimension is unknown.
Hence, both model fitting and selection must be de-
termined from the data simultaneously, by using an
approximation based on any of the Akaike Informa-
tion Criterion (AIC) (Akaike, 1973), the Bayesian
Information Criterion (BIC) (Schwarz, 1978), or the
sum of AIC and BIC plus an entropy term (Ngatchou-
Wandji and Bulla, 2013).
Our work is inspired by the enormous data min-
ing potential of an ever growing corpus of many thou-
sands of compute programs, actively running on mo-
bile devices. Albeit challenged by strict, intellectual
property rules, we foresee our work and of many oth-
ers to follow, to drive free and publicly accessible,
large set of compute program source, over the web.
The main contribution of our work is a novel, statis-
tically driven system that combines IR and unsuper-
vised learning techniques, to discover instinctive pat-
terns from unlabeled data, to best match a program to
an SoC target processor. Unlike a more deterministic
compiler approach that treats programs individually,
and largely relies on a set of incomplete rules. The
remainder of this paper is organized as follows. We
overview the motivation for selecting an abstracted
representation of a compute program, leading to our
compact, instruction vector format, in section 2. Sec-
tion 3 reviews algorithms and provides theory to mul-
tivariate cluster analysis, discussing both the normal
mixture model foundation and the role of the EM
method in estimating model parameters. As section 4
outlines the classification schemes we conduct to rate
our system, including k-nearest neighbor and ranked
retrieval based. In section 5, we present our evalua-
tion methodology, and analyze quantitative results of
our experiments. We conclude with a summary and
future prospect remarks, in section 6.
2 INSTRUCTION VECTORS
Compute programs, executed on a destined proces-
sor, abide by an instruction set architecture (ISA).
The ISA defines a machine language that comprises
a set of opcodes and native commands, implemented
on a specific compute hardware. On a given archi-
tecture, some instructions run sequentially and oth-
ers are capable to execute concurrently. Semantically,
ISAs vary from a compute entity to another, but on
an instruction level, the underlying action performed
is rather resembling. This observation spurred com-
puter architects to seek a higher level abstraction and
a more portable intermediate representation of object
code, known as bytecode. Smalltalk, Java, and Mi-
crosoft’s Common Language Runtime (CLR) are ex-
amples of virtual machines (VM) that translate byte-
code onto native machine code, at runtime. Without
loss of generality, we selected for our work the Dalvik
VM (Dalvik, 2007) that was specifically created for
SoCProcessorDiscoveryforProgramExecutionMatchingUsingUnsupervisedMachineLearning
193

the widespread Android, mobile operating system.
Android was explicitly founded for devices with
severely constrained processing power, limited phys-
ical memory, and literally no swap space. Given the
extremely wide range of target environments, it is crit-
ical for the application platform to be abstracted away
from both the underlying operating system and hard-
ware devices. This motivated Dalvik, a VM based
runtime that executes files in a distinct format, opti-
mized for minimal memory footprint. The design of
the Dalvik executable format is primarily driven by
sharing data across classes, using type explicit, con-
stant pooling. Architecturally, the Dalvik VM is reg-
ister based and requires on average less executed in-
structions, compared to the traditional stack approach.
The Dalvik bytecode offers a rich set of opcodes that
operate on values, 32 or 64 bits, and on wider ob-
ject references. Opcode mnemonics disambiguate the
underlying operation by a name suffix that either in-
dicates the data type the instruction operates on, or
formalizes a unique operand layout.
In our work, a compute program is modeled af-
ter a text document, comprised of a list of Dalvik
opcode mnemonics. To better control the instruction
distribution in a program, we further partition byte-
code opcodes into eight operational categories (Ta-
ble 1). Move instructions copy the content from one
value or object baring register, to another. Whereas
the const opcode moves a literal value, a string or a
class reference to a register. Similarly, the get and
put instructions perform any of array, object or static
field load or store data transfers, respectively. For
construction, instructions instantiate non-array class
types, and both uninitialized and initialized typed ar-
rays. Divergent commands include an unconditional
jump to an instruction, a conditional branch based on
a packed or a sparse sequence of integral values, along
with function invocation and return constructs. As
if-test based compare and relational operations, con-
ditionally branch to a specified program offset. Test
commands check for a valid typed instance or a bound
cast, followed by both unary operations that incorpo-
rate type conversions, and binary commands that in-
clude arithmetic, logical, and shift operations.
One of the more simple and very effective text re-
trieval model is the bag of words (Baeza-Yates and
Ribeiro-Neto, 1999). In this model, the order of in-
structions, to appear in a compute program p, is ig-
nored. Rather, a program is represented as a term fre-
quency vector in N
|V|
, where |V| is the size of our in-
struction vocabulary, and each vector element retains
a count of instruction type occurrences in a program
p. For the objective of grouping programs to match a
target processor, the data type context of an opcode is
less informative, and thus we fix the type index to its
default. This leads to a vocabularyV, consisting of 39
unique instructions, as listed in Table 1. The program,
bag of instruction words representationis passed on to
our mixture model for clustering, and follows efficient
similarity calculations, directly from the well known
Vector Space Model (Salton et al., 1975).
3 PROGRAM CLUSTERING
Clustering procedures, based on finite mixture mod-
els, provide a flexible approach to multivariate statis-
tics. They become increasingly preferred over heuris-
tic methods, owing to their robust mathematical basis.
Mixture models standout in admitting clusters to di-
rectly identify with the components of the model. To
model our system probability distribution of compute
program features, we deploy the well established,
Normal (Gaussian) Mixture Model (GMM) (Mclach-
lan and Basford, 1988) (Mclachlan and Peel, 2000),
known for its parametric, probability density func-
tion that is represented as a weighted sum of Gaussian
component densities. GMM parameters are estimated
from our incomplete training data, composed of bags
of instruction words, using the iterative Expectation-
Maximization (EM) (Dempster et al., 1977) algo-
rithm.
3.1 Normal Mixture Model
Let X = {x
1
,x
2
,...,x
n
} be our observed collection of
compute programs, each represented as an instruction
count vector I ∈ N
d
, where d is the size of our instruc-
tion vocabulary. An additive mixture model, defines a
weighted sum of k components, whose density func-
tion is formulated by equation 1:
p(x|Θ) =
k
∑
j=1
w
j
p
j
(x|θ
j
), (1)
where w
j
is a mixing proportion, signifying the prior
probability that an observed program x, belongs to the
j
th
mixture component, or cluster. Mixing weights,
satisfy the constraints
∑
k
j=1
w
j
= 1, and w
j
≥ 0. The
component probability density function, p
j
(x|θ
j
), is
a d-variate distribution, parameterized by θ
j
. Most
commonly, and throughout this work, p
j
(x|θ
j
) is the
multivariate normal (Gaussian) density (equation 2),
characterized by its mean vector µ
j
∈ R
d
and a co-
variance matrix Σ
j
∈ R
dxd
. Hence, θ
j
= (µ
j
,Σ
j
), and
the mixture parameter vector Θ = {θ
1
,θ
2
,....,θ
k
}.
1
(2π)
d
2
p
|Σ
j
|
exp(−
1
2
(x− µ
j
)
T
Σ
−1
j
(x− µ
j
)) (2)
KDIR2014-InternationalConferenceonKnowledgeDiscoveryandInformationRetrieval
194

Compute programs, distributed by mixtures of
multivariate normal densities, are members of clus-
ters that are centered at their means, µ
j
, whereas the
cluster geometric feature is determined by the covari-
ance matrix, Σ
j
. For efficient processing, our covari-
ance matrix is diagonal, Σ
j
= diag(σ
2
j1
,σ
2
j2
,...,σ
2
jd
),
and hence clusters are of an ellipsoid shape, each
nonetheless of a distinct dimension. To fit the nor-
mal mixture parameters onto a set of training feature
vectors, we use the maximum likelihood estimation
(MLE) principal. Furthermore, in regarding the set of
compute programs as forming a sequence of n inde-
pendent and identically distributed data samples, the
likelihood corresponding to a k-component mixture,
becomes the product of their individual probabilities:
L(Ψ|X) = Π
n
i=1
k
∑
j=1
w
j
p
j
(x
i
|θ
j
), (3)
where Ψ = {Θ,w
1
,w
2
,...,w
k
}. However, the multi-
plication of possibly thousands of fractional probabil-
ity terms, incurs an undesired numerical instability.
Therefore, by a practical convention, MLE operates
on the log-likelihood basis. As a closed form solu-
tion to the problem of maximizing the log-likelihood,
the task of deriving Ψ analytically, based on the ob-
served data X, is in many cases computationally in-
tractable. Rather, it is common to resort to the stan-
dard, expectation-maximization(EM) algorithm, con-
sidered the primary tool for model based clustering.
3.2 Expectation-Maximization
To add more flexibility in describing the distribu-
tion P(X), the EM algorithm introduces new in-
dependences via k-variate hidden variables Z =
{z
1
,z
2
,...,z
n
}. They mainly capture uncertainty in
cluster assignments, and are estimated in conjunction
with the rest of the parameters. The combined ob-
served and hidden portions, form the complete data
set Y = (X,Z), where z
i
= {z
i1
,z
i2
,...z
ik
} is an unob-
served vector, with indicator elements
z
ic
=
(
1, if x
i
belongs to cluster c
0, otherwise.
(4)
EM is an iterative procedure, alternating between
the expectation (E) and maximization (M) steps (Al-
gorithm 1). For the hidden variables z
i
, the E step
estimates the posterior probabilities w
ic
that object x
i
belongs to a mixture cluster c, giventhe observed data
and the current state of the model parameters
w
ic
=
w
c
p
c
(x
i
|µ
c
,Σ
c
)
∑
k
j=1
w
j
p
j
(x
i
|µ
j
,Σ
j
)
. (5)
Algorithm 1: EM.
1: input: observed data X, hidden data Z
2: output: log-likelihood l
3: initialize parameters w
j
,µ
j
,Σ
j
∀ j ∈ {1,2, ...,k}
4: repeat
5: — E Step —
6: l
prev
= l
7: for i = 1 to n do
8: for c = 1 to k do
9: compute posterior probability w
ic
10: end for
11: end for
12: — M Step —
13: for j = 1 to k do
14: for i = 1 to n do
15: integrate parameters w
j
,µ
j
,Σ
j
16: end for
17: normalize parameters w
j
,µ
j
,Σ
j
18: end for
19: compute log-likelihood l
20: until |l − l
prev
| ≤ epsilon
21: return l
Then the M step maximizes the joint distribution of
both the observed and hidden data, and parameters are
fitted to maximize the expected log-likelihood, based
on the conditional probabilities, w
ic
, computed in the
E step. The E step and M step are iterated until con-
vergence, after which a program observation, x
i
, is as-
signed to a cluster, corresponding to the highest con-
ditional or posterior probability. EM typically per-
forms well, once the observed data reasonably con-
forms to the mixture model, and by ensuring robust
selection of random values, assigned to starting pa-
rameters, the algorithm warrants convergence to ei-
ther a local maximum or a stationary value.
4 PROCESSOR CLASSIFICATION
Our classification model for processor discovery is
implemented in two alternative methods. A k-
nearest neighbor (KNN) (Cormen et al., 1990) base-
line model, and a similarity based, ranked informa-
tion retrieval (RIR) (Wang et al., 2012) approach. The
compute program, bag of instruction words represen-
tation feeds well to both techniques that pursue effec-
tive, vector proximity calculations.
In KNN, we compute the Euclidean-squared dis-
tance between a test instruction vector against all vec-
tors of our training program set, previously clustered
into processor related groups. Distances are sorted
in a non descending order and placed on a priority
queue, with the queue element storing both the dis-
SoCProcessorDiscoveryforProgramExecutionMatchingUsingUnsupervisedMachineLearning
195

Table 2: Total instructions executed in our experiments, as a function of ascending number of compute programs.
Programs 100 500 1000 2000 2500 5000 7500 10000
Instructions 51,561 247,295 515,050 1,028,647 1,277,993 2,532,709 3,744,372 5,033,266
tance and a training cluster id, for reference. Pur-
posed for testability, our system lets the number of
closest neighbors, selected from the top of the queue,
be a user set, varying parameter. For each test instruc-
tion vector,we apply a normalized majority rule to the
nearest samples, and derive a processor score. This
score is further accumulated and averaged for each
cluster, and the matching processor corresponds then
to the highest average scoring, cluster id.
To fit the RIR search model, we combine the log-
frequency and the inverse program frequency weights
of a selected instruction term, to form the t f.id f
weighting scheme. t f.id f increases with the occur-
rences of an instruction type in a program, and also
with the rarity of an instruction in our training pro-
gram collection. Each compute program is now rep-
resented by a real-valued vector ∈ R
|V|
, of t f.id f
weights. In subscribing to the Vector Space Model
(Salton et al., 1975), programs are ranked based on a
similarity measure applied to a weighted term, query
and training instruction vectors. All weighted instruc-
tion vectors are further length normalized, using L2-
norm, expressed as k~xk
2
=
q
∑
i
x
2
i
. Dividing a vec-
tor by its L2-norm makes it a unit vector, and hence
programs of short and long instruction sequences of
scaled terms, have now comparable weights that in-
fer feature closeness. Respectively, we adopted the
widely used cosine similarity metric, defined as the
dot product of a query instruction vector, q, and a
training instruction vector, p, both length normalized:
cos(~q,~p) = ~q·~p =
|V|
∑
i=1
q
i
p
i
. (6)
For each cluster, we compute the cosine similarity
scores between a query, or a test instruction vector and
each of the training program vectors, and place them
on a priority queue. As the queue entry comprises a
pair of score and a reference cluster id. This process
searches for top M, a system set variable, strongly cor-
related pairs of programs, and ranks them by a prob-
ability of relevance (Zhu et al., 2011). We then com-
pute the average precision (AP) of an individual query
vector, and average the APs per cluster, to yield the
desired mean average precision (MAP) measure. The
matching processor coincides with the cluster id that
achieved the highest MAP among clusters.
5 EMPIRICAL EVALUATION
To validate our system in practice, we have imple-
mented a software library that realizes SoC processor
discovery in several stages. Our library commences
with constructing a collection of compute programs,
composed of the Dalvik selected, bytecode instruc-
tions. Each of the linearly executed programs are then
converted into a bag of instruction words representa-
tion, employing a concise, feature vector dimension-
ality of 39 elements, the size of our instruction vocab-
ulary. The collection of instruction vectors is next fed
into our mixture model module for processor match-
ing grouping, and clusters created are cross validated
to measure our system discovery performance.
1
10
100
1000
10000
100000
1000000
1 10 100
Frequency
Rank
100
500
1000
2000
2500
5000
7500
10000
Figure 1: Zipf law power curves for instruction distribution,
parametrized by an ascending, program collection size.
5.1 Experimental Setup
First we build our compute program set for training.
The collection dimension is a system level, user set-
table parameter that takes discrete values in a wide
range of 100 to 10000 programs, while letting indi-
vidual program size to vary randomly, in the span of
10 to 1000 bytecode instructions. As a function of a
non decreasing number of compute programs, Table 2
depicts the total number of instructions executed, ex-
tending a large gamut from several ten thousands up
to a handful of million instructions. In constructing
the synthetic programs, we made an effort to abide by
a more practical, and real world executable. Hence,
instruction categories (Table 1) are each assigned a
unique distribution weight, awarding highest prece-
dence to load and store instruction types, followed by
a more moderate presence rank, attached to binary op-
KDIR2014-InternationalConferenceonKnowledgeDiscoveryandInformationRetrieval
196
0
0.1
0.2
0.3
0.4
0.5
1000 2500 5000 7500 10000
Fractional Share
Programs
P0
P1
P2
(a) Three processors.
0
0.1
0.2
0.3
0.4
0.5
1000 2500 5000 7500 10000
Fractional Share
Programs
P0
P1
P2
P3
(b) Four processors.
0
0.1
0.2
0.3
0.4
0.5
1000 2500 5000 7500 10000
Fractional Share
Programs
P0
P1
P2
P3
P4
(c) Five processors.
0
0.1
0.2
0.3
0.4
0.5
1000 2500 5000 7500 10000
Fractional Share
Programs
P0
P1
P2
P3
P4
P5
(d) Six processors.
0
0.1
0.2
0.3
0.4
0.5
1000 2500 5000 7500 10000
Fractional Share
Programs
P0
P1
P2
P3
P4
P5
P6
(e) Seven processors.
0
0.1
0.2
0.3
0.4
0.5
1000 2500 5000 7500 10000
Fractional Share
Programs
P0
P1
P2
P3
P4
P5
P6
P7
(f) Eight processors.
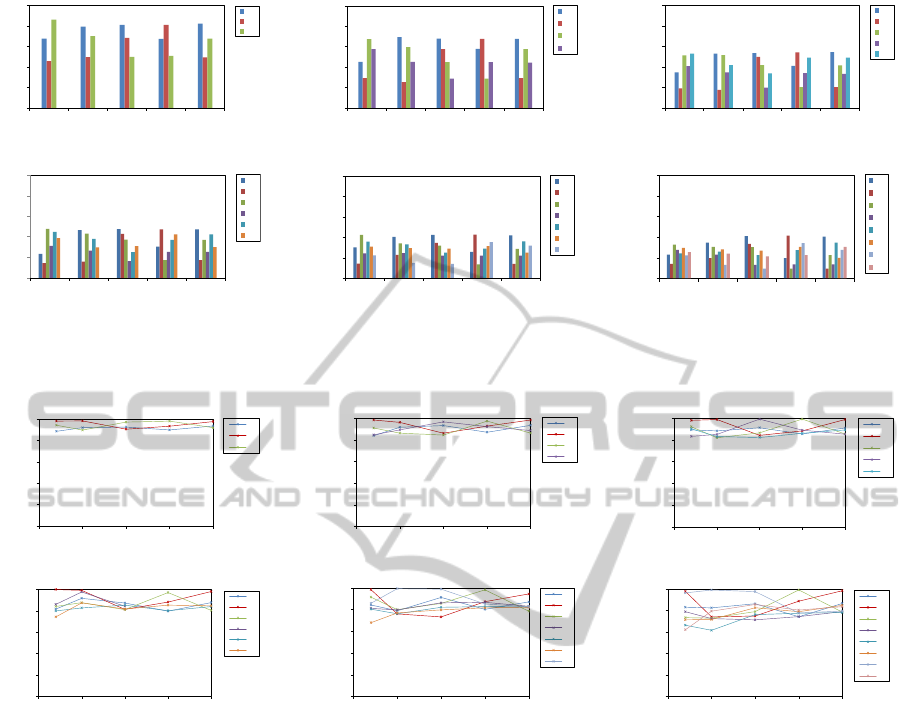
Figure 2: Program-processor relation: showing for each individual processor the cluster distribution, in fractional share of the
training set, as a function of an ascending, program collection size, across our experimental, SoC processor configurations.
0
0.2
0.4
0.6
0.8
1
0 2500 5000 7500 10000
Average Majority
Programs
P0
P1
P2
(a) Three processors.
0
0.2
0.4
0.6
0.8
1
0 2500 5000 7500 10000
Average Majority
Programs
P0
P1
P2
P3
(b) Four processors.
0
0.2
0.4
0.6
0.8
1
0 2500 5000 7500 10000
Average Majority
Programs
P0
P1
P2
P3
P4
(c) Five processors.
0
0.2
0.4
0.6
0.8
1
0 2500 5000 7500 10000
Average Majority
Programs
P0
P1
P2
P3
P4
P5
(d) Six processors.
0
0.2
0.4
0.6
0.8
1
0 2500 5000 7500 10000
Average Majority
Programs
P0
P1
P2
P3
P4
P5
P6
(e) Seven processors.
0
0.2
0.4
0.6
0.8
1
0 2500 5000 7500 10000
Average Majority
Programs
P0
P1
P2
P3
P4
P5
P6
P7
(f) Eight processors.
Figure 3: KNN classification: showing for each individual processor the normalized, average majority vote, as a function of
an ascending, program collection size, across our experimental, SoC processor configurations.
erations, and the remainder of instruction subclasses
are all granted an equal, yet lower, occupancypriority.
The setting of the number of SoC compute units is
explicit, and exposed by our software to the user as a
system varying property. Our empirical compute ele-
ment count is broad, starting at the minimum required
set of three, and incrementally increases up to eight
processors. In our experiments, we strike a reasonable
balance between computation time and conducting a
qualitative search, for either proximity or relevance.
For the KNN baseline classification, we vote out ten
nearest neighbor samples, closest to a stated, test in-
struction vector. Similarly, in RIR, we inspect top ten
relevant programs, relative to a query program vector.
We use the hold out method with cross validation to
rate the performance of our system. Formally, our li-
brary sets up random resampling mode, and each clus-
ter of programs becomes a two-way data split of train
and test collections, owning 80/20 percent shares, re-
spectively. The scores we obtained by each of KNN
and RIR classification methods, fully met our study
performance objectives. For the sake of presentation
conciseness, and to avoid similar information of dif-
ferent metrics, we only report an already exhaustive
compilation of KNN based classification results.
5.2 Experimental Results
We study the impact of concurrently varying our pro-
gram training set size and the number of SoC proces-
sors, on our discovery system performance.
To understand how instruction terms are dis-
tributed across our entire training collection of com-
pute program content, we use the Zipf law. The law
states that the collection frequency, cf
i
, of the i
th
most
common term, is proportional to 1/i. For training sets
SoCProcessorDiscoveryforProgramExecutionMatchingUsingUnsupervisedMachineLearning
197
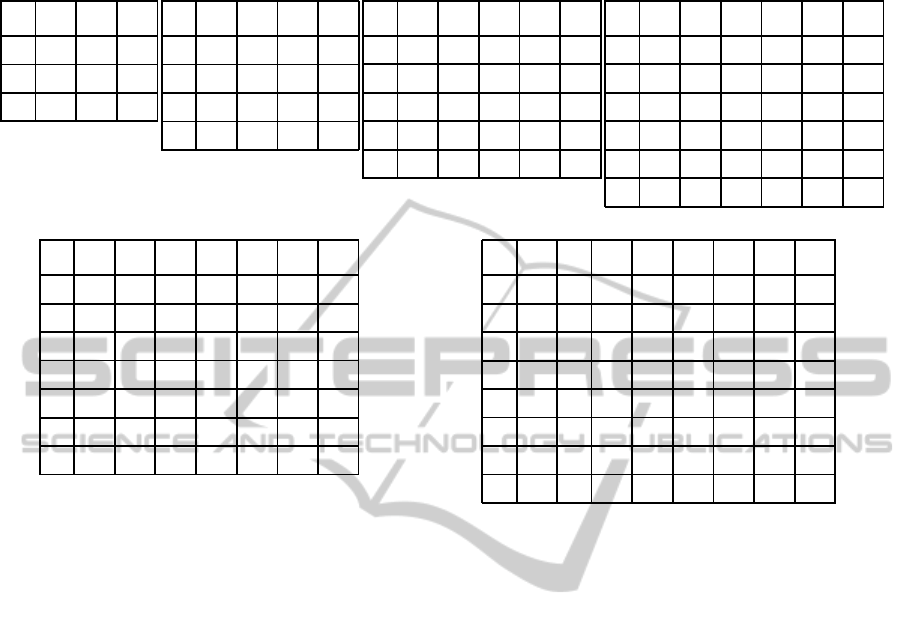
Table 3: Confusion matrices: shown for a 10000 program collection, across our experimental, SoC processor configurations.
(a) Three processors.
P0 P1 P2
P0 789 0 35
P1 0 494 2
P2 5 14 659
(b) Four processors.
P0 P1 P2 P3
P0 656 0 24 0
P1 0 294 0 1
P2 0 0 528 51
P3 0 25 2 417
(c) Five processors.
P0 P1 P2 P3 P4
P0 516 0 0 0 31
P1 0 206 0 0 0
P2 0 0 386 26 7
P3 0 29 1 304 0
P4 2 0 11 0 480
(d) Six processors.
P0 P1 P2 P3 P4 P5
P0 435 0 0 0 37 0
P1 0 175 0 0 0 0
P2 0 0 327 0 5 39
P3 0 18 0 234 0 3
P4 1 0 29 0 393 0
P5 0 0 2 16 0 283
(e) Seven processors.
P0 P1 P2 P3 P4 P5 P6
P0 388 0 0 0 30 0 0
P1 0 138 0 3 0 0 0
P2 0 0 249 0 0 30 8
P3 0 18 0 203 0 0 0
P4 5 0 0 0 333 0 23
P5 0 0 0 23 0 227 0
P6 0 0 17 0 3 0 299
(g) Eight processors.
P0 P1 P2 P3 P4 P5 P6 P7
P0 372 0 0 0 33 0 0 0
P1 0 95 0 0 0 0 0 0
P2 0 0 204 0 0 23 0 0
P3 0 18 0 120 0 0 0 0
P4 6 0 0 0 306 0 0 34
P5 0 0 0 12 0 188 0 0
P6 0 0 18 0 0 0 252 8
P7 0 0 0 0 1 0 10 296
of increasing discrete sizes, we plot the frequency of a
bytecode instruction type against its frequency rank,
in a log-log scale (Figure 1). Noting our instruction
vocabulary is made of 39 unique words, in total. Our
data shown to consistently fit the law, with the ex-
ception of the extremely low frequency terms. This
is likely a side effect of our implementation that pro-
duces rare instruction words we attribute to program
sparseness, more noticeable for programs of lower in-
struction count. The slopes of the training set curves
are however less steeper than the line predicted by the
law, indicating a more evenly distribution of instruc-
tion words, across programs. Staircase shaped plots,
directly cast to our inherent, non linear instruction dis-
tribution in a provided program, by attaching higher
occupancy to instruction category of a greater rank.
Here on, we discuss several facets of our system
performance, characterized by varying the SoC pro-
cessor composition. To ensure robust cross valida-
tion for SoC configurations of up to eight processors,
our produced clusters must be of dimensionality that
reasons statistically. Hence, our evaluation uniformly
starts at a training collection size of 1000 programs.
First, we analyze the quality of program-processor re-
lational clustering. This is manifested by both the de-
sign choice of representing a compute program as a
bag of instruction words, and more importantly, by
the effectiveness of our GMM implementation. Fig-
ure 2 shows for each individual processor, the clus-
ter distribution in terms of fractional share of the ex-
ercised program training set, as a function of a non
decreasing, program collection size, and across our
experimental, SoC processor configurations. A key
observation of our results is the preserved cluster pat-
tern in a proportional scale, as the number of proces-
sors increases, consistently for any selected training
set dimension. This supports our hypothesis that a
program-processor relation, strongly depends on the
blend of instructions in a compute program, and less
so on the order of execution, and further affirms our
design choice for an instruction vector, feature model.
Figure 3 shows for each individual processor, the
KNN classification results measured in normalized,
average majority vote, as a function of a non decreas-
ing, training set size, and spans our experimental, SoC
processor formations. The average voting score we
report is calculated across our randomly selected, in-
struction vectors for the test held partition, of each of
the program clusters. As a function of program col-
lection expansion, baseline classification performance
remains relatively flat, and mostly immune to SoC
processor configuration. On the other hand, with in-
creased SoC processor count, the group of individual
performance curves tends to spread across a wider in-
terval of classification rates, demonstrating a reason-
ably acceptable, moderate drop of program-processor
KDIR2014-InternationalConferenceonKnowledgeDiscoveryandInformationRetrieval
198

0
0.2
0.4
0.6
0.8
1
0 2500 5000 7500 10000
F1-Score
Programs
P0
P1
P2
(a) Three processors.
0
0.2
0.4
0.6
0.8
1
0 2500 5000 7500 10000
F1-Score
Programs
P0
P1
P2
P3
(b) Four processors.
0
0.2
0.4
0.6
0.8
1
0 2500 5000 7500 10000
F1-Score
Programs
P0
P1
P2
P3
P4
(c) Five processors.
0
0.2
0.4
0.6
0.8
1
0 2500 5000 7500 10000
F1-Score
Programs
P0
P1
P2
P3
P4
P5
(d) Six processors.
0
0.2
0.4
0.6
0.8
1
0 2500 5000 7500 10000
F1-Score
Programs
P0
P1
P2
P3
P4
P5
P6
(e) Seven processors.
0
0.2
0.4
0.6
0.8
1
0 2500 5000 7500 10000
F1-Score
Programs
P0
P1
P2
P3
P4
P5
P6
P7
(f) Eight processors.
Figure 5: Classification F1-Score: extracted from confusion matrices; showing for each individual processor the performance
rates, as a function of an ascending, program collection size, across our experimental, SoC processor configurations.
relation scale. Figure 4 further illustrates area-under-
curve (AUC), integrated for each group of respective,
processor performance curves, and shows an almost
linear descent of the majority vote, at a mild, end-
to-end decline of 15 percent, from 0.94 to 0.79, as we
increment SoC compute elements, from three to eight.
As part of the classification process, we have con-
structed confusion matrix data (Kohavi and Provost,
1998), for each of our experimental combinations of
training set dimension and SoC processor configu-
ration. This provides complementary assessment on
precision, recall, and accuracy measures of our sys-
tem. Table 3 shows confusion matrix instances for
a 10000 program collection, as a function of an as-
cending number of SoC processors. Matrices ap-
pear sparse and largely diagonally biased, with corre-
lated actual and predicted classification. Nonetheless,
both false positives and false negatives do surface oc-
casionally. The classification F1-Score for our sys-
tem, have been extracted from confusion matrix data,
and Figure 5 shows for each individual processor,
the scores as a function of a non decreasing, training
0.75
0.8
0.85
0.9
0.95
3 4 5 6 7 8
Average Majority
Processors
Figure 4: KNN classification: integrated area-under-curve
(AUC), shown for a group of individual, processor perfor-
mance curves, as a function of a non decreasing, SoC pro-
cessor count.
set dimension, and across our empirical, SoC proces-
sor configurations. Scores are intentionally depicted
in the 0 to 1 range, to emphasize the relative rather
than the absolute performance behavior of a processor
group configuration. Similarly, Figure 6 presents our
system level accuracy, derived from confusion matrix
data, as a function of a non decreasing, training set
size, and parametrized by the SoC processor count.
Accuracy rates top at as high as 0.97, for a three pro-
cessor setting, and decline gracefully down to 0.87,
for our largest tried, eight processor SoC.
Statistical measures, obtained from confusion ma-
trix data, outline an alternate, system performance
perspective that markedly concurs with the direct
KNN, classification assessment (Figure 3). Corre-
spondingly, we benefited from this for analyzing the
RIR method, in searching a ranked program list, for
relevancy. Finally, for running time, KNN holds a
slight advantage over RIR, in avoiding the normaliza-
tion of the instruction vector.
6 CONCLUSIONS
We have demonstrated the apparent potential in de-
ploying information retrieval and unsupervised ma-
chine learning methods, to accomplish the discov-
ery of program-processor relations from unchartered
data, and facilitate optimal code execution. Our pro-
posed solution is generic and scalable, to properly ad-
dress the evident SoC evolution into a many cores sys-
tem, and markedly contrasts the more limited, com-
piler optimization techniques, often intended towards
an individual compute program. Each of our cluster
analysis and classification results, consistently affirm
our design choice for representing a compute program
SoCProcessorDiscoveryforProgramExecutionMatchingUsingUnsupervisedMachineLearning
199

by an effective bag of instruction words, attaching
more weight to the mixture of instruction types, rather
than the order of execution.
0.85
0.88
0.91
0.94
0.97
1
1000 2500 5000 7500 10000
Accurcay
Programs
3
4
5
6
7
8
Figure 6: System accuracy: extracted from confusion ma-
trices; shown as a function of an ascending, program col-
lection size, and parametrized by the SoC processor count.
The clustering process we devise bins compute
programs into classes, each identified as a unique vir-
tual processor. Much like a VM that compiles byte-
code to machine code, our system proceeds to as-
sign virtual to physical processing elements, a step
that is both device and SoC vendor specific, and is
based on mapping architecture properties attached to
each virtual cluster. As evident from our confusion
matrix data, there is the small statistical likelihood
for a program to be paired with a less-than-optimal
SoC compute entity. While the runtime performance
of this match might be below efficiency expectation,
program execution however, warrants functional cor-
rectness. Typically, extending the training program
collection and relabeling is one reasonable mitigating
practice to reduce false positive occurrences.
By endorsing a data type independent bytecode,
we assumed symmetric SoC processors, each capa-
ble of executing the entire, defined Dalvik ISA. This
premise is substantiated for the majority of instruc-
tion types, but not for all. For example, double pre-
cision format, might be supported natively on some
cores, but other compute elements may resort to a
less efficient, software emulation. To address this, we
plan to augment our instruction vocabulary, by adding
double data type annotations to the binary arithmetic
mnemonics, and let our GMM module abide by the
processor support level, in forming program clusters.
A direct progression of our work is to assume no
prior knowledge of the number of SoC compute el-
ements, and discover both the model fitting and the
selection dimension directly from the incomplete pro-
gram training set, using a combination of Akaike and
Bayesian information criteria. We look forward to a
more wide spread and publicly available repository
of compute programs, to allow for extending our ex-
periments, and pursue more real world, machine code
executables. Lastly, we envision our software to be
incorporated seamlessly in a mobile application plat-
form, to effectively perform the classification task of
processor target selection, at execution runtime.
ACKNOWLEDGEMENTS
We would like to thank the anonymous reviewers for
their insightful and helpful feedback.
REFERENCES
Akaike, H. (1973). Information theory and an extension of
the maximum likelihood principle. In International
Symposium on Information Theory, pages 267–281,
Budapest, Hungary.
Augonnet, C. (2011). Scheduling Tasks over Multicore Ma-
chines Enhanced with Accelerators: a Runtime Sys-
tem’s Perspective. PhD thesis, Universit´e Bordeaux
1, 351 cours de la Lib´eration — 33405 TALENCE
cedex.
Baeza-Yates, R. and Ribeiro-Neto, B., editors (1999). Mod-
ern Information Retrieval. ACM Press Series/Addison
Wesley, Essex, UK.
Cormen, T. H., Leiserson, C. H., Rivest, R. L., and
Stein, C. (1990). Introduction to Algorithms. MIT
Press/McGraw-Hill Book Company, Cambridge, MA.
Dalvik (2007). Bytecode for Dalvik VM.
http://source.android.com/devices/tech/dalvik/
dalvik-bytecode.html.
Dempster, A. P., Laird, N. M., and Rubin, D. B. (1977).
Maximum likelihood from incomplete data via the
EM algorithm. Royal Statistical Society, 39(1):1–38.
Duda, R. O., Hart, P. E., and Stork, D. G. (2001). Unsu-
pervised learning and clustering. In Pattern Classifi-
cation, pages 517–601. Wiley, New York, NY.
Fraley, C. and Raftery, A. E. (2002). Model-based
clustering, discriminant analysis and density estima-
tion. Journal of the American Statistical Association,
97(458):611–631.
Fraley, C. and Raftery, A. E. (2007). Bayesian regulariza-
tion for normal mixture estimation and model-based
clustering. Journal of Classification, 24(2):155–181.
Kohavi, R. and Provost, F. (1998). Glossary of terms. Ma-
chine Learning, 30(2):271–274.
Manning, C. D., Raghavan, P., and Schutze, H. (2008). In-
troduction to Information Retrieval. Cambridge Uni-
versity Press, Cambridge, United Kingdom.
Mclachlan, G. J. and Basford, K. E. (1988). Mixture Mod-
els: Inference and Applications to Clustering. Marcel
Dekker, New York, NY.
Mclachlan, G. J. and Peel, D. (2000). Finite Mixture Mod-
els. John Wiley and Sons, New York, NY.
Ngatchou-Wandji, J. and Bulla, J. (2013). On choosing a
mixture model for clustering. Journal of Data Sci-
ence, 11(1):157–179.
KDIR2014-InternationalConferenceonKnowledgeDiscoveryandInformationRetrieval
200

Rajaraman, R. and Ullman, J. D. (2011). Mining of Massive
Datasets. Cambridge University Press, New York,
NY.
Renderscript (2011). Renderscript compute platform.
http://developer.android.com/guide/topics/renderscript/
compute.html.
Salton, G., Wong, A., and Yang, C. S. (1975). A vector
space model for automatic indexing. Communications
of the ACM, 18(11):613–620.
Schwarz, G. (1978). Estimating the dimension of a model.
The Annals of Statistics, 6(2):461–464.
Wang, C., Bi, K., Hu, Y., Li, H., and Cao, G. (2012).
Extracting search-focused key n-grams for relevance
ranking in web search. In Web Search and Data Min-
ing (WSDM), pages 343–352, Seattle, WA.
Zhu, S., Wu, J., Xiong, H., and Xia, G. (2011). Scaling up
top-k cosine similarity search. Data and Knowledge
Engineering, 70(1):60–83.
SoCProcessorDiscoveryforProgramExecutionMatchingUsingUnsupervisedMachineLearning
201
