
Markerless Motion Tracking in Evaluation
of Hurdle Clearance Parameters
Krzysztof Przednowek
1
, Tomasz Krzeszowski
2
, Janusz Iskra
3
and Krzysztof Wiktorowicz
2
1
Faculty of Physical Education, University of Rzeszow, Rzeszow, Poland
2
Faculty of Electrical and Computer Engineering, Rzeszow University of Technology, Rzeszow, Poland
3
Faculty of Physical Education and Physiotherapy, Opole University of Technology, Opole, Poland
Keywords:
Hurdle Clearance, Computer Vision, Particle Swarm Optimization, Markerless Motion Tracking.
Abstract:
In this study, implementation of markerless method of human body motion tracking as a tool of measurement
of hurdle clearance kinematic parameters was presented. The analysis involved 5 hurdle runners at various
training levels. Recording of video sequences was carried out under simulated starting conditions of a 110 m
hurdle race. Kinematic parameters were determined based on the analysis of images recorded with a 100 Hz
monocular camera. The suggested method does not involve using any special clothes, markers or estimation
support techniques. In the study, the basic numerical characteristics of twenty estimated parameters were
presented. The accuracy of determined hurdle clearance parameters was verified by comparison of estimated
poses with the ground truth pose. As the quality criterion, the MAE (Mean Absolute Error) was adopted. In
the distance parameters, the least error was obtained for the distance between the center of mass (CM) and
the hurdle at the first hurdle clearance phase (MAE = 22.0 mm). For the angular parameters, the least error
was obtained for the leg angle at the first hurdle clearance phase (MAE = 3.1
◦
). The level of computed errors
showed that the presented method can be used for estimation of hurdle clearance kinematic parameters.
1 INTRODUCTION
Hurdling is a group of athletic events in which tech-
nical preparation plays a significant role. The hurdle
race technique involves running over 10 hurdles that
are from 0.84 to 1.07 m high (depending on the par-
ticular event). In those races, the estimation of tech-
nique is focused mainly on evaluation of particular
hurdles passing stages. Those stages are a complex
form of dynamic motion (Iskra, 2012). The exist-
ing kinematic studies of hurdle races include mostly
the analysis of selected parts of race. The most com-
monly analysed race element is the so called ”hurdle
clearance” (
ˇ
Coh, 2003;
ˇ
Coh et al., 2008; McDonald,
2003). Among the above-mentioned studies, the most
interesting is the research conducted by
ˇ
Coh (
ˇ
Coh,
2003) describing the technique of running over the
hurdle used by the world-record holder Colin Jack-
son. The kinematic 3D analysis regarded the run over
the fourth and fifth hurdle. It was carried out using the
ARIEL (Ariel Dynamics Inc., USA) tool. The video
material was recorded with two 50 Hz cameras. The
conducted research allowed for an accurate determi-
nation of the selected kinematic parameters of hurdle
clearance. The same author also described a biome-
chanical analysis of the 100 m hurdles performed by
Brigita Bukovec, the medallist of the Olympic Games
in Atlanta (
ˇ
Coh et al., 1998). In this paper kinematic
and kinetic analysis of parameters of start, starting ac-
celeration up to the first hurdle, the velocity dynamics
between the hurdles and the technique of taking the
sixth hurdle were estimated. In study a 2D video sys-
tem (Ariel Performance Analysis System) was used.
The all sequences were recorded with three synchro-
nized cameras with a frequency of 50Hz. Another pa-
per describes the study concerning 3D biomechanical
analysis of sprint hurdles (Salo et al., 1997). To esti-
mate the parameters ”Kine analysis” software and two
cameras (25 Hz) were used. The study involved two
groups of men and two groups of women at differ-
ent levels of training. The main objective of the study
was to determine the level and comparison of selected
kinematic parameters in the analysed groups.
In the biomechanical research of sports events,
various computer vision methods play a more and
more important role. Motion detection and tracking
methods are used among others in analysis of ath-
letic jumps (Ramasso et al., 2009; Panagiotakis et al.,
129
Przednowek K., Krzeszowski T., Iskra J. and Wiktorowicz K..
Markerless Motion Tracking in Evaluation of Hurdle Clearance Parameters.
DOI: 10.5220/0005080601290136
In Proceedings of the 2nd International Congress on Sports Sciences Research and Technology Support (icSPORTS-2014), pages 129-136
ISBN: 978-989-758-057-4
Copyright
c
2014 SCITEPRESS (Science and Technology Publications, Lda.)

2006). Chinese researchers (Xian-jie et al., 2004)
suggested using computer vision for technique eval-
uation of athletes jumping on a trampoline. Another
solution that uses computer vision techniques is sys-
tem for tracking players in indoor team games e.g.
handball (Per
ˇ
s and Kovacic, 2000). The next study
(Taki et al., 1996) presented a motion analysis system
of soccer games. The main goal of this paper was to
evaluate the teamwork quantitatively based on move-
ment of the players in game. Another study proposes
motion tracking of a tennis racket using a monocular
camera and markerless technique (Elliott et al., 2014).
Whereas the work by (Sheets et al., 2011) makes use
of a markerless motion capture system to test for kine-
matic differences at the lower back, shoulder, elbow,
wrist, and racquet between the flat, kick, and slice
serves. In the study seven male NCAA Division 1
players were tested on an outdoor court in daylight
conditions. The next application showed that the peri-
odic motion descriptor can successfully classify four
sports types: sprint, long-distance running, hurdling
and canoeing. The experimental results were per-
formed using video material from the 1992 Barcelona
Olympic Games (Cheng et al., 2004).
In this study, the markerless method of human
body motion tracking was used; it makes it possible
to obtain kinematic parameters for hurdle clearance
analysis. The above-mentioned parameters are deter-
mined based on the analysis of the sequence of images
captured with a monocular camera. An important as-
pect is the fact, that the suggested method does not
involve using any special clothes, markers or other es-
timation support techniques. To the best of our knowl-
edge, this is the first attempt to measurement of hurdle
clearance kinematic parameters with markerless mo-
tion tracking algorithm.
2 ARTICULATED HUMAN
MOTION TRACKING
The purpose of tracking is to determine the current
pose of a human body which reflects as closely as
possible to the real pose. It should be noted that
capturing the three-dimensional position of a human
body is a very difficult task that requires compli-
cated computations (John et al., 2010; Kwolek et al.,
2012). The main problems include: high dimen-
sional search space that in issues involving motion
tracking can comprise of up to some dozen dimen-
sions; noise occurring in the image and a large vari-
ability in appearance of the tracked humans and en-
vironment. A significant problem is also the com-
plexity of human motion and the fact that particu-
lar parts of the body often are obscured. The situa-
tion gets even more complicated when images from
only a monocular camera are available. In such case,
problems concerning the depth estimation cause ad-
ditional difficulty. Research teams solve the above-
mentioned issues in many different ways. The most
common method is making use of simplified human
body models (Deutscher and Reid, 2005; John et al.,
2010; Krzeszowski et al., 2012), uniform background
(Deutscher and Reid, 2005), and also properly se-
lected clothes of the tracked human body in order to
facilitate the determination of distinctive features. In
the process of tracking, the particle filter algorithm
(Sidenbladh et al., 2000) or its modified versions are
often used (Deutscher and Reid, 2005). Those algo-
rithms require, however, a significant number of parti-
cles in order to find the correct solution, what directly
impacts the time needed for computations. Therefore,
in the human body motion tracking process, particle
swarm optimization algorithms (Kennedy and Eber-
hart, 1995; John et al., 2010; Kwolek et al., 2012),
are more and more often used, because they enable a
more effective exploration of the search space.
2.1 3D Human Body Model
The 3D model is used for simulation of human body
motion and determination of its current pose, i.e. po-
sition and orientation in space as well as the angles
between the joints. The model used in this research
is based on the kinematic tree structure consisting
of 11 segments; each of them is represented using a
truncated cone (Krzeszowski et al., 2012; Deutscher
and Reid, 2005), Fig. 1. The space, in that the
model operates, is determined by the number of de-
grees of freedom (DoF). Each segment can include
up to three DoFs that define its orientation; an ex-
ception is the pelvis that can contain three additional
segments defining the model translation. For track-
ing the human body motion, models for which the
number of DoFs ranges from 26 (Krzeszowski et al.,
2012; Kwolek et al., 2012) to over 30 (Deutscher and
Reid, 2005) are usually used; the model suggested in
this paper includes 17 DoFs. Restriction of the search
space is possible, since a concrete problem is consid-
ered, i.e. application of tracking system in order to
obtain data for hurdle clearance over the distance of
110 m. If you know how the tracked human body
would move, you will be able to make some addi-
tional assumptions. For example, you can assume that
the hurdle runner will move perpendicularly to the
camera and will not change its direction. The use of
similar assumptions allowed for a significant reduc-
tion of the search space, which has a great impact on
icSPORTS2014-InternationalCongressonSportSciencesResearchandTechnologySupport
130

0
1
4
2
3
5
9
7
6
8
10
Pelvis (0) - 3 DoF
Spine (1) - 1 DoF
Head (2) - 1 DoF
Right Upper Arm (6) - 2 DoF
Right Forearm (9) - 1 DoF
Left Upper Arm (7) - 2 DoF
Left Forearm (10) - 1 DoF
Right Upper Leg (3) - 2 DoF
Right Lower Leg (5) - 1 DoF
Left Upper Leg (4) - 2 DoF
Left Lower Leg (8) - 1 DoF
Figure 1: 3D human body model (left), hierarchical struc-
ture (right).
the complexity of the problem under consideration.
The discussed model is fully customizable, and
its parametrisation includes a hierarchical structure as
well as the length and width of the individual seg-
ments. At the moment, both the model configuration
and pose of the human body in the first frame of a
sequence of images are selected manually.
2.2 Tracking Algorithm
In the motion tracking process, the particle swarm op-
timization algorithm (PSO) (Kennedy and Eberhart,
1995), was used; its usefulness in solving problems
related to the estimation of human pose has been re-
peatedly confirmed (John et al., 2010; Krzeszowski
et al., 2012; Kwolek et al., 2012). In that algorithm,
particle swarm is used in order to find the best solu-
tion; each of the particles represents a hypothetical
solution of the problem. During the estimation, parti-
cles explore the search space and exchange informa-
tion. In the ordinary PSO algorithm each i-th particle
contains the current position x
i
, velocity v
i
, and its
best position pbest
i
. Moreover, the particles have ac-
cess to the best global position gbest, which has been
found by any particle in the swarm. The d-th com-
ponent of velocity and position of each particle are
updated based on the following equations:
v
k+1
i,d
= ω[v
k
i,d
+ c
1
r
1,d
(pbest
i,d
− x
k
i,d
)
+ c
2
r
2,d
(gbest
d
− x
k
i,d
)] (1)
x
k+1
i,d
= x
k
i,d
+ v
k+1
i,d
(2)
where ω is constriction factor, c
1
, c
2
are positive
constants and r
1,d
, r
2,d
are uniformly distributed ran-
dom numbers. Selection of the best position for i-
th particle (pbest
i
) and best global position (gbest)
are based on the fitness function value, which will be
discussed in the next subsection. In our application
the position of i-th particle represents the hypotheti-
cal state (pose) of an athlete.
In the standard PSO algorithm, initialization of
particles in the swarm takes place based on the state
(pose) estimated within the period of time t − 1. In
the suggested implementation, apart from the pose
from the period of time t −1 there are also used four
predefined poses, which correspond with the selected
phases that are characteristic for the hurdle clearance
analysis (see P
2
, P
3
, P
4
i P
5
on Fig. 3). The intro-
duced modification enables a more precise estimation
in case of the above mentioned characteristic phases
and increases the probability of a correct pose estima-
tion when one of the human body parts gets lost.
2.3 Fitness Function
The fitness function formulate the degree of similarity
between the real and the estimated human pose. The
fitness function used in this study is based on two sum
components. The first of them is determined based on
the extracted human silhouette, whereas the other one
was based on the edge distance map (John et al., 2010;
Krzeszowski et al., 2012). The value of the function
is determined based on the following equation:
f (x) = 1 − (a f
1
(x) + b f
2
(x)) (3)
where x is the human body pose and a, b are exper-
imentally chosen weighting factors. The f
1
(x) func-
tion defines the degree of overlap of the rendered 3D
model with the extracted silhouette, whereas f
2
(x)
is determined by comparison of the 3D model edges
with the image, including the map with pixel dis-
tances from the nearest edge. Figure 2 presents ex-
emplary images with the extracted person.
For human silhouette extraction (Fig. 2(b))
the background subtraction algorithm (Zivkovic and
van der Heijden, 2006) was used. The second image
used in the fitness function, i.e. the edge distance map
(Fig. 2(e)), is determined based on the image with
extracted edges (Fig. 2(c)), from which edges not
belonging to the tracked human body were removed
(Fig. 2(d)).
(a) (b) (c) (d) (e)
Figure 2: Person extraction. (a)-input image, (b)-
foreground, (c)-edges, (d)-masked edges, (e)-edge distance
map.
MarkerlessMotionTrackinginEvaluationofHurdleClearanceParameters
131
α
1
α
2
α
5
α
4
h
1
h
2
1.067 m
h
3
h
4
h
5
w
1
w
2
w
4
w
5
x
1
x
2
x
4
x
5
β
3
γ
3
γ
4
P
1
P
2
P
3
P
4
P
5
γ
2
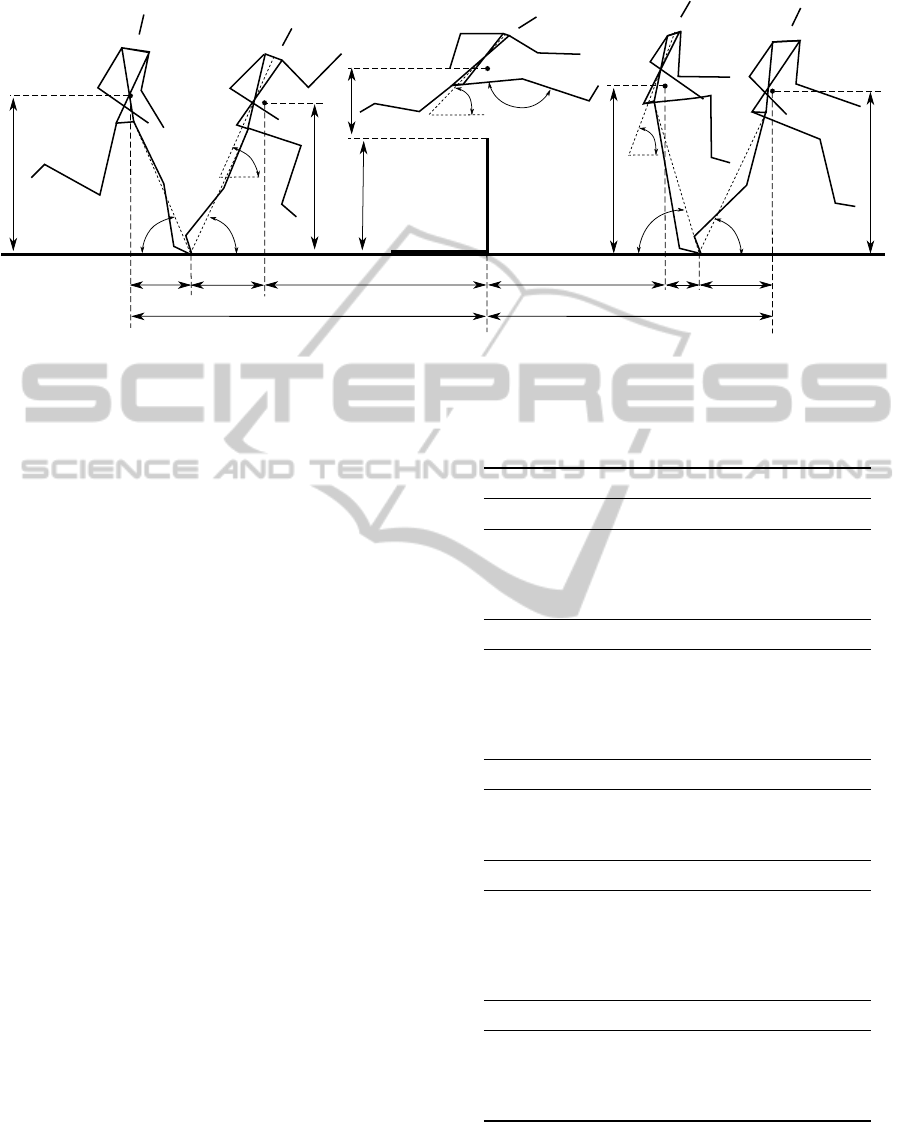
Figure 3: Hurdle clearance. P
1
- take-off phase (braking), P
2
- take-off phase (propulsion), P
3
- flight phase, P
4
- landing
phase (braking), P
5
- landing phase (propulsion).
2.4 Data Collection
The analysis involved five hurdlers at different train-
ing levels. Among recorded contestants there was a
four times Polish runner-up and twice Polish Youth
Champion at 400 m hurdles. The study was carried
out at sports facilities at Opole University of Tech-
nology. Registration was made in the athletics hall
with four tartan tracks. Throughout the research, the
sequence of passing the fourth hurdle in the regula-
tion conditions of 110 m race (height: 1.067 m, dis-
tance between the hurdles: 9.14 m) was captured. As
shown in the previous studies (
ˇ
Coh, 2003), according
to the race speed curve, the speed between the third
and fifth hurdle is the greatest and the technique of
passing the hurdles is independent of the low start dif-
ficulty and increasing fatigue. The analysis included
21 parameters that are presented in Fig. 3. The pa-
rameters were selected based on the literature review
(Iskra, 2012;
ˇ
Coh, 2003;
ˇ
Coh et al., 2008). In the
analysis, 13 distance parameters and eight angle pa-
rameters were taken into account. The description of
the specified parameters is shown in Table 1. The se-
quences were captured with industrial 100 Hz Basler
Ace acA645-100gc camera.
3 EXPERIMENTAL RESULTS
The markerless motion tracking method was evalu-
ated on five video sequences with hurdle runners. The
quality of tracking was made by analyses carried out
both through qualitative visual evaluations as well as
using of ground truth data. Ground truth data were
Table 1: Description of parameters; units: h, w, x [mm],
α, γ, β [
◦
].
Parameter Description
P
1
- take-off phase (braking)
h
1
height of CM
α
1
angle of the leg (ground contact)
x
1
CM to foot distance
w
1
CM to hurdle distance
P
2
- take-off phase (propulsion)
h
2
height of CM
α
2
angle of the leg (ground contact)
x
2
CM to foot distance
w
2
CM to hurdle distance
γ
2
angle of inclination of the torso
P
3
- flight phase
h
3
height of CM (over the hurdle)
γ
3
angle of inclination of the torso
β
3
angle of the attacking leg
P
4
- landing phase (braking)
h
4
height of CM
α
4
angle of the leg (ground contact)
x
4
CM to foot distance
w
4
CM to hurdle distance
γ
4
angle of inclination of the torso
P
5
- landing phase (propulsion)
h
5
height of CM
α
5
angle of the leg (ground contact)
x
5
CM to foot distance
w
5
CM to hurdle distance
obtained by manually matching 3D model to athletes
on the images containing of five phases characteris-
tic for hurdle clearance analysis (Fig. 3). In Fig. 4
icSPORTS2014-InternationalCongressonSportSciencesResearchandTechnologySupport
132

Figure 4: Motion history for athlete 1, number of frames:
92 (for better readability, only every fourth frame is shown),
duration of video sequence: 0.911 s.
the motion tracking history for the selected athlete
was presented. In order to increase the legibility of
the generated trace, every fourth recorded frame was
presented. The entire sequence was composed of 92
frames, which corresponds to a duration 0.911 s.
The precise detection of the selected hurdle clear-
ance stages was presented for three chosen athletes
(Fig. 5). As one can observe, projected 3D model
matches athletes on images reasonably well. From
the analysis it follows, that the algorithm provides sat-
isfactory detection of lower limbs whereas there are
some problems with estimation of the correct pose of
arms. Those problems arise in consequence of the
mutual covering of particular parts of body, and they
are extremely difficult to eliminate while a monocu-
lar camera is used. However, it should be emphasized
that in the conducted research, no parameters asso-
ciated with upper limbs motion were taken into ac-
count. In consequence, incorrect arms motion track-
ing does not impact the measurement of analysed pa-
rameters. In the case of lower body there are diffi-
culties in tracking between phases P3 and P4. It may
happen that one of the legs is ’lost’ (tracking is failed),
such a situation can be observed in Figure 5 for the
athlete 5, frame #61. However, due to the use in the
process of initializing the particles of four predefined
poses (Section 2.2), the algorithm is able to correct
the error in subsequent frames and estimate the cor-
rect posture (Fig. 5, athlete 5, frame #68). Also in
this case, the cause of tracking errors are difficulties
in estimating the position of a human body pose on
the basis of images from a monocular camera.
Numerical characteristics of 21 measured kine-
matic hurdle clearance parameters are presented in
Table 2. This table gives an accurate description of the
variables under consideration and their basic statis-
tics, i.e. the arithmetic mean of ¯x, the minimum value
min, the maximum value max, standard deviation sd
and coefficient of variation:
V =
sd
¯x
· 100% (4)
The analysis shows that the average length of hur-
dle clearance was approximately 3525.2 mm (x
2
, w
2
,
Table 2: Characteristics of kinematic parameters; units:
h, w, x [mm], α, γ, β [
◦
].
Param. min max sd ¯x V [%]
P
1
h
1
764.0 1040.0 76.2 927.9 8.2
α
1
65.4 46.1 3.6 55.7 6.4
x
1
239.0 534.5 59.8 378.9 15.8
w
1
2249.0 2741.0 153.8 2551.0 6.0
P
2
h
2
952.4 1196.0 59.0 1098.0 5.4
α
2
70.2 97.4 7.3 81.1 9.0
x
2
167.3 589.6 104.4 407.3 25.6
w
2
1304.0 1717.0 107.8 1538.0 7.0
γ
2
55.7 81.4 6.3 68.5 9.2
P
3
h
3
228.7 437.9 61.6 319.4 19.3
γ
3
34.1 56.1 4.7 46.0 10.3
β
3
119.9 173.0 14.8 146.6 10.1
P
4
h
4
967.2 1193.0 59.4 1093.0 5.4
α
4
99.4 15.1 13.8 81.3 14.0
x
4
18.4 433.2 88.5 236.7 37.4
w
4
1180.0 1486.0 73.1 1344.0 5.4
γ
4
44.1 74.9 7.8 57.4 13.5
P
5
h
5
903.4 1124.0 63.9 1008.0 6.3
α
5
54.5 94.3 7.7 68.2 11.4
x
5
194.6 811.7 109.7 606.5 18.1
w
5
1663.0 1958.0 73.0 1807.0 4.0
x
4
, w
4
). The taking off distance was 364.6 mm longer
than the landing distance. The trunk inclination an-
gle in landing position was at the level of 57.4
◦
. The
greatest variability was observed for distance param-
eters between the center of gravity and the spot where
the foot touched the ground. The measured values are
consistent with the sport level of the researched group.
The next step included determination of the er-
ror level of particular parameters. Values computed
by using the implemented algorithm were compared
with the values of the theoretical ground truth refer-
ence model (model manually adjusted to the analysed
images). The quality criterion was defined for each
parameter as:
e
j
= |
ˆ
X
j
− X
j
|, (5)
MAE =
1
N
N
∑
j=1
e
j
, (6)
where e
j
- absolute error, N - total number of data,
ˆ
X
j
- estimated value (determined by the algorithm), X
j
-
ground truth value, MAE - mean absolute error. The
MarkerlessMotionTrackinginEvaluationofHurdleClearanceParameters
133
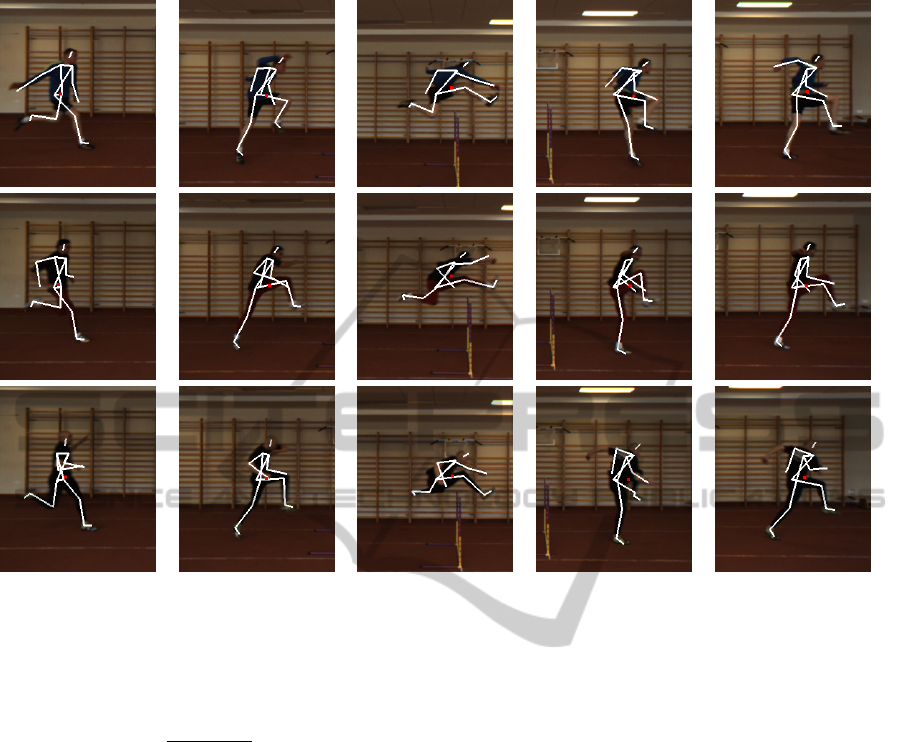
Figure 5: Tracking results on the three video sequences. First row - athlete 1 in frames #6, 21, 44, 70, 76, second row - athlete
3 in frames #6, 21, 39, 64, 69, third row - athlete 5 in frames #5, 20, 38, 61, 68.
normalized mean absolute error was calculated from
formula:
NMAE =
MAE
max − min
· 100%, (7)
where max - maximum value of parameter, max - min-
imum value of parameter.
Table 3 includes the minimum error min(e
j
), max-
imum error max(e
j
), standard deviation sd(e
j
) and
the average error, defined as MAE and NMAE. The
error analysis revealed that among all distance param-
eters, estimation of distance between CM and the spot
where the foot is touching the ground at the moment
of leaving the hurdle (landing) is determined with the
greatest error (x
4
). That error was MAE = 135.5 mm.
It is however, worth noting that for that parameter, the
least difference from ground truth was only 1.8 mm.
The CM height parameters featured relatively small
values of MAE (27.1 − 66.8 mm), the CM distance
from the hurdle (w
1
) at the P
1
phase was determined
with the least error. The accuracy of parameters esti-
mation was also defined by the MAE error. The angle
of the front leg at the 1st stage (α
1
) features the least
error (3.1
◦
), whereas the trunk angle during landing
(γ
4
) is determined with the greatest error (10.0
◦
).
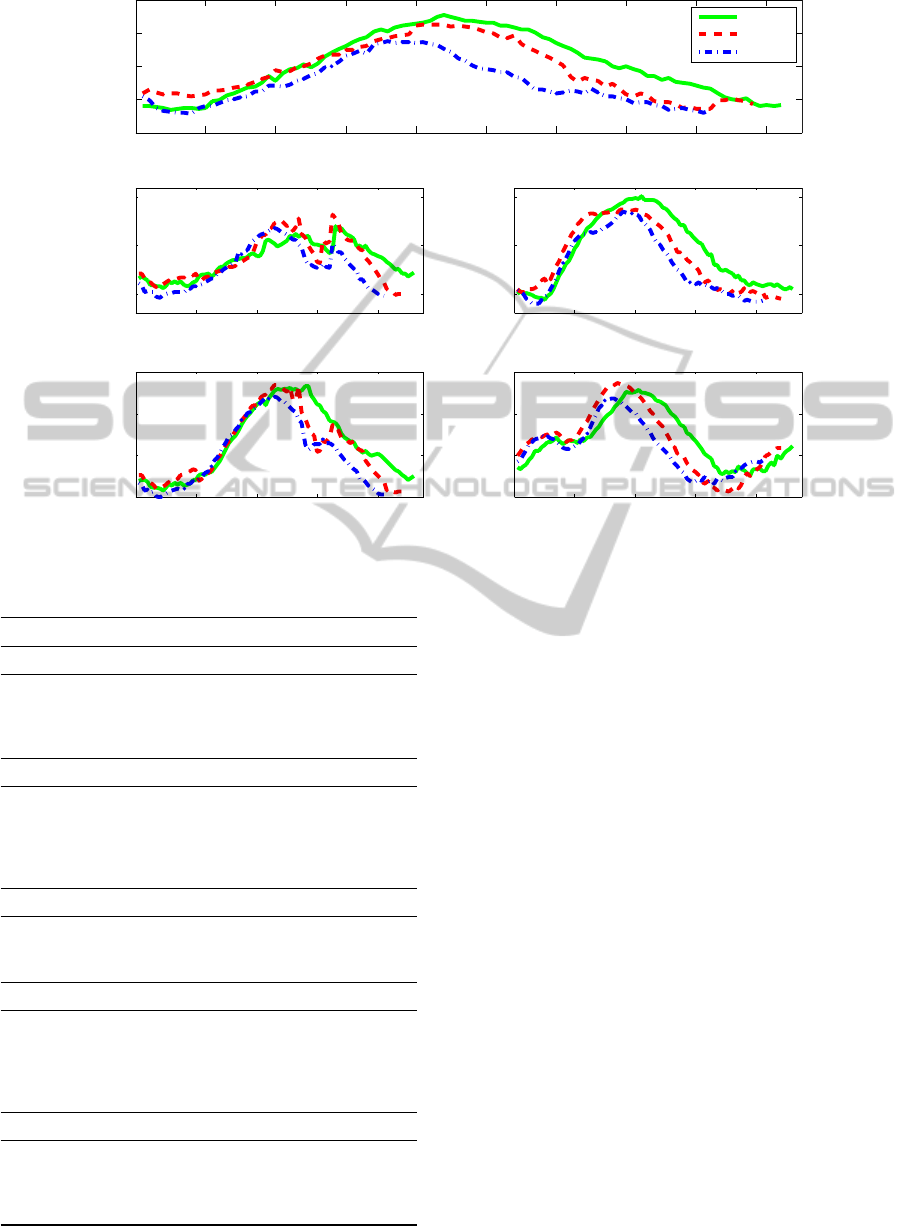
The paper focuses on the analysis of five key
phases of hurdles clearance, however, the presented
algorithm can also be used for the analysis of hur-
dler’s motion during the entire sequence. Figure 6
shows the trajectory of the center of mass, knees and
feet for three selected hurdlers. All of the presented
trajectories are of similar nature, nevertheless, some
differences arising, inter alia, from different body
built and technical level of individual athletes etc. can
be noticed. For example hurdler 1 shows the highest
position of the center of mass for most of the flight
and his flight time is the longest (about 50 frames),
which can be observed by analysing the trajectory of
feet. By contrast the flight time of the fifth athlete is
the shortest, approximately 40 frames.
4 CONCLUSIONS
In this paper, markerless method of human body mo-
tion tracking was presented. Experimental results
on five various sequences of hurdle runners demon-
strate the effectiveness of the approach. The quality
of tracking was made by analyses carried out both
through qualitative visual evaluations as well as using
of ground truth data. Ground truth data were obtained
icSPORTS2014-InternationalCongressonSportSciencesResearchandTechnologySupport
134
0 10 20 30 40 50 60 70 80 90
800
1000
1200
1400
1600
frame number
h [mm]
center of mass
0 20 40 60 80
500
1000
1500
frame number
h [mm]
knee of trail leg
0 20 40 60 80
500
1000
1500
frame number
h [mm]
knee of lead leg
0 20 40 60 80
0
500
1000
1500
frame number
h [mm]
foot of trail leg
0 20 40 60 80
0
500
1000
1500
frame number
h [mm]
foot of lead leg
athlete 1
athlete 3
athlete 5
Figure 6: The trajectory of movment of center of mass, knees and foots for three selected athletes.
Table 3: Errors; units: h, w, x [mm], α, γ, β [
◦
].
Param. min(e
j
) max(e
j
) sd(e
j
) MAE NMAE[%]
P
1
h
1
0.5 95.9 29.0 37.0 13.4
α
1
0.1 7.1 1.8 3.1 16.1
x
1
4.2 113.3 28.3 41.3 14.0
w
1
1.8 58.7 14.6 22.0 4.5
P
2
h
2
6.5 141.2 30.4 66.8 27.4
α
2
0.1 18.9 5.1 5.5 20.2
x
2
1.8 364.9 83.0 105.2 7.8
w
2
2.9 77.3 18.9 32.3 24.9
γ
2
0.2 9.3 2.4 3.5 13.5
P
3
h
3
0.6 103.0 25.4 27.1 12.9
γ
3
0.0 12.1 3.4 4.5 20.5
β
3
0.4 27.2 5.6 7.0 13.2
P
4
h
4
0.7 107.5 26.5 41.2 18.2
α
4
0.5 57.5 9.4 7.6 9.0
x
4
1.8 232.1 63.9 135.5 18.2
w
4
0.7 173.6 44.8 55.7 32.7
γ
4
0.1 25.8 6.9 10.0 32.5
P
5
h
5
1.2 97.6 27.4 38.4 17.5
α
5
0.1 14.9 3.8 4.0 10.1
x
5
6.1 235.9 56.1 99.0 16.0
w
5
3.9 128.9 30.5 59.3 20.1
by manually matching 3D model to athletes on the
images. The error analysis indicated that, there are
reasons for using presented method for measurement
of hurdle clearance kinematic parameters. The pro-
posed system of estimating kinematic parameters can
be used in assessing the progress of training and tech-
nical preparation of hurdlers. With a simple method
of determining the parameters of hurdle clearance the
progress and impact of training means of hurdle races
can be monitored. Further work will focus on the use
of data obtained for the analysis of more kinematic
parameters as well as dynamic parameters of hurdle
clearance. In further works a multi-camera system is
also going to be tested.
REFERENCES
Cheng, F., Christmas, W., and Kittler, J. (2004). Periodic
human motion description for sports video databases.
In Proceedings of the Pattern Recognition, 17th Inter-
national Conference on (ICPR’04) Volume 3 - Volume
03, ICPR ’04, pages 870–873, Washington, DC, USA.
IEEE Computer Society.
ˇ
Coh, M. (2003). Biomechanical analysis of Colin Jackson’s
hurdle clearance technique. New studies in athletics,
1:33–40.
ˇ
Coh, M., Dolenec, A., Tomazin, K., and Zvan, M. (2008).
Dynamic and kinematic analysis of the hurdle clear-
MarkerlessMotionTrackinginEvaluationofHurdleClearanceParameters
135

ance technique. In
ˇ
Coh, M., editor, Biomechanical
Diagnostic Methods in Athletic Training, pages 109–
116. University of Ljubljana.
ˇ
Coh, M., Kostelic, J., and Pintaric, S. (1998). A biomechan-
ical model of the 100 m hurdles of brigita bukovec.
Track Coach, 142:4521–4529.
Deutscher, J. and Reid, I. (2005). Articulated body motion
capture by stochastic search. Int. J. Comput. Vision,
61(2):185–205.
Elliott, N., Choppin, S., Goodwill, S. R., and Allen, T.
(2014). Markerless tracking of tennis racket motion
using a camera. Procedia Engineering, 72(0):344 –
349. The Engineering of Sport 10.
Iskra, J. (2012). Scientific research in hurdle races. AWF
Katowice.
John, V., Trucco, E., and Ivekovic, S. (2010). Markerless
human articulated tracking using hierarchical particle
swarm optimisation. Image and Vision Computing,
28(11):1530–1547.
Kennedy, J. and Eberhart, R. (1995). Particle swarm opti-
mization. In Proc. of IEEE Int. Conf. on Neural Net-
works, volume 4, pages 1942–1948. IEEE Press, Pis-
cataway, NJ.
Krzeszowski, T., Kwolek, B., Michalczuk, A., witoski, A.,
and Josiski, H. (2012). View independent human gait
recognition using markerless 3d human motion cap-
ture. In Bolc, L., Tadeusiewicz, R., Chmielewski, L.,
and Wojciechowski, K., editors, Computer Vision and
Graphics, volume 7594 of Lecture Notes in Computer
Science, pages 491–500. Springer Berlin Heidelberg.
Kwolek, B., Krzeszowski, T., Gagalowicz, A., Woj-
ciechowski, K., and Josiski, H. (2012). Real-time
multi-view human motion tracking using particle
swarm optimization with resampling. In Perales, F. J.,
Fisher, R. B., and Moeslund, T. B., editors, Articu-
lated Motion and Deformable Objects, volume 7378
of Lecture Notes in Computer Science, pages 92–101.
Springer Berlin Heidelberg.
McDonald, C. (2003). The angular momentum of hurdle
clearance. Track Coach, 1(1):1–1.
Panagiotakis, C., Grinias, I., and Tziritas, G. (2006). Auto-
matic human motion analysis and action recognition
in athletics videos. In 14th European Signal Process-
ing Conf. Citeseer.
Per
ˇ
s, J. and Kovacic, S. (2000). A system for tracking
players in sports games by computer vision. Elek-
trotehni
ˇ
cni vestnik, 67(5):281–288.
Ramasso, E., Panagiotakis, C., Rombaut, M., Pellerin, D.,
Tziritas, G., et al. (2009). Human shape-motion analy-
sis in athletics videos for coarse to fine action/activity
recognition using transferable belief model. Elec-
tronic Letters on Computer Vision and Image Anal-
ysis, 7(4):32–50.
Salo, A., Grimshaw, P. N., and Marar, L. (1997). 3-d biome-
chanical analysis of sprint hurdles at different compet-
itive levels. Medicine and science in sports and exer-
cise, 29(2):231–237.
Sheets, A. L., Abrams, G. D., Corazza, S., Safran, M. R.,
and Andriacchi, T. P. (2011). Kinematics differences
between the flat, kick, and slice serves measured us-
ing a markerless motion capture method. Annals of
Biomedical Engineering, 39(12):3011–3020.
Sidenbladh, H., Black, M. J., and Fleet, D. J. (2000).
Stochastic tracking of 3d human figures using 2d im-
age motion. In In European Conf. on Computer Vi-
sion, pages 702–718.
Taki, T., Hasegawa, J., and Fukumura, T. (1996). Develop-
ment of motion analysis system for quantitative evalu-
ation of teamwork in soccer games. In Image Process-
ing, 1996. Proceedings., International Conference on,
volume 3, pages 815–818 vol.3.
Xian-jie, Q., Zhao-qi, W., and Shi-hong, X. (2004). A novel
computer vision technique used on sport video. In The
12th International Conference in Central Europe on
Computer Graphics. UNION Agency-Science Press.
Zivkovic, Z. and van der Heijden, F. (2006). Efficient
adaptive density estimation per image pixel for the
task of background subtraction. Pattern Recogn. Lett.,
27(7):773–780.
icSPORTS2014-InternationalCongressonSportSciencesResearchandTechnologySupport
136
