
Discovering New Gene Functionalities from Random Perturbations of
Known Gene Ontological Annotations
Giacomo Domeniconi
1
, Marco Masseroli
2
, Gianluca Moro
1
and Pietro Pinoli
2
1
DISI, Universit
`
a degli Studi di Bologna, Via Venezia 52, 47523, Cesena, Italy
2
DEIB, Politecnico di Milano, Piazza L. Da Vinci 32, 20133 Milan, Italy
Keywords:
Gene Ontology, Biomolecular Annotation Prediction, Bioinformatics, Knowledge Discovery, Supervised
Learning, Data Representation.
Abstract:
Genomic annotations describing functional features of genes and proteins through controlled terminologies
and ontologies are extremely valuable, especially for computational analyses aimed at inferring new biomed-
ical knowledge. Thanks to the biology revolution led by the introduction of the novel DNA sequencing tech-
nologies, several repositories of such annotations have becoming available in the last decade; among them, the
ones including Gene Ontology annotations are the most relevant. Nevertheless, the available set of genomic
annotations is incomplete, and only some of the available annotations represent highly reliable human curated
information. In this paper we propose a novel representation of the annotation discovery problem, so as to
enable applying supervised algorithms to predict Gene Ontology annotations of different organism genes. In
order to use supervised algorithms despite labeled data to train the prediction model are not available, we
propose a random perturbation method of the training set, which creates a new annotation matrix to be used to
train the model to recognize new annotations. We tested the effectiveness of our approach on nine Gene Ontol-
ogy annotation datasets. Obtained results demonstrated that our technique is able to improve novel annotation
predictions with respect to state of the art unsupervised methods.
1 INTRODUCTION
Prediction of associations between items and features
characterizing them is a common machine learning
task which is often performed in several application
domains, including bioinformatics. When the consid-
ered features are described through controlled termi-
nologies, particularly if their terms are related into
taxonomies or ontologies, such task well supports
knowledge discovery. In bioinformatics, several ter-
minologies and ontologies are available to describe
structural and functional features of biomolecular en-
tities. Among them, the most developed and relevant
is the well known Gene Ontology (GO) (GO Consor-
tium et al., 2001). The association of its terms to
biomolecular entities, mainly genes and proteins, is
widely used to annotate, and thus characterize, them.
The GO comprises three sub-ontologies, which
overall include nearly 40,000 controlled terms
that characterize species-independent Biological Pro-
cesses (BP), Molecular Functions (MF) and Cellular
Components (CC). Structured as a Directed Acyclic
Graph (DAG) of terms hierarchically related, mainly
through ”is a” or ”part of” relationships, the GO is
designed to capture orthogonal features of genes and
proteins. In its DAG, each node represents a GO term
and each directed edge from a node a to a node b rep-
resents a relationship that exists from a child term a
to its parent term b.
In modern, high-throughput and computationally
intensive molecular biology, controlled biomolecular
annotations are very valuable. Yet, some of them are
less reliable, or may even be incorrect, since com-
putationally inferred without human curator supervi-
sion, or due to biomolecular knowledge improvement
since their annotation. Besides, available biomolecu-
lar annotations are incomplete, given the many gene
and protein features of numerous organisms still to
be discovered and annotated. In this context, com-
putational methods that can estimate incorrectness of
available annotations and predict new annotations are
paramount. Particularly, the ones that provide ranked
lists of inferred annotations can, for instance, quicken
the curation process by focusing it on the prioritized
novel annotations (Pandey et al., 2006).
In this work, in order to discover new GO term an-
107
Domeniconi G., Masseroli M., Moro G. and Pinoli P..
Discovering New Gene Functionalities from Random Perturbations of Known Gene Ontological Annotations.
DOI: 10.5220/0005087801070116
In Proceedings of the International Conference on Knowledge Discovery and Information Retrieval (KDIR-2014), pages 107-116
ISBN: 978-989-758-048-2
Copyright
c
2014 SCITEPRESS (Science and Technology Publications, Lda.)

notations of different organism genes based on avail-
able GO annotations, we apply different supervised
algorithms and benchmark them with an unsupervised
method previously used to this purpose. To apply
supervised algorithms to the prediction problem, we
propose to assign labels to the originally unlabeled
GO annotations based on a random perturbation of
the annotation matrix that switches off some known
annotations. In so doing, we create a training ma-
trix with missing annotations; thus, we can train the
model to recognize new annotations. This allows ap-
plying powerful supervised methods to available gene
annotations and predicting new gene function anno-
tations with better performance than the previously
used unsupervised methods. Although sophisticated
techniques exist to predict gene functions by leverag-
ing multiple heterogeneous data sources, simpler an-
alytical frameworks using faster methods based only
on available annotations proved to be effective and
very useful, as here confirmed.
The rest of the paper is organized as follows.
Section 2 reports an overview of other works about
biomolecular annotation prediction. Section 3 de-
scribes the annotation datasets used in our experi-
ments. Section 4 exposes the methods used to predict
new annotations. Section 5 illustrates the performed
experiments and reports their results, benchmarking
them with those of another work. Finally, in Section
6 we discuss our contribution and foresee possible fu-
ture developments.
2 RELATED WORKS
Different methods have been proposed to predict
biomolecular annotations.
In (King et al., 2003), decision trees and Bayesian
networks were suggested to learn patterns from avail-
able annotation profiles and predict new ones. Along
this line, Tao and colleagues (Tao et al., 2007) im-
proved by using a k-nearest neighbour (k-NN) clas-
sifier to make a gene inherit the annotations that are
common among its nearest neighbour genes in a gene
network. Such an inheritance is regulated by the func-
tional distance between genes, based on the semantic
similarity of the GO terms used to annotate them.
Novel gene annotations can also be inferred based
on multiple data sources. In (Barutcuoglu et al.,
2006), gene expression levels from microarray exper-
iments are used to train a Support Vector Machine
(SVM) classifier for each gene annotation to a GO
term; consistency among predicted annotation terms
is then enforced through a Bayesian network mapped
onto the GO structure. Conversely, in (Raychaudhuri
et al., 2002) and (P
´
erez et al., 2004), the authors took
advantage of textual information by mining the litera-
ture and extracting keywords that are then mapped to
GO concepts. This approach has the disadvantage to
require a preparatory data integration step in order to
be performed; this both adds complexity to the frame-
work and reduces its flexibility.
In (Khatri et al., 2005) and (Done et al., 2010),
Khatri and colleagues suggested a prediction algo-
rithm based on the Singular Value Decomposition
(SVD) method of the gene-to-term annotation ma-
trix, which is implicitly derived from the count of
co-occurrences between pairs of terms in the avail-
able annotation dataset. This prediction method based
on basic linear algebra was then extended in (Chicco
et al., 2012), by incorporating gene clustering based
on gene functional similarity computed on Gene On-
tology annotations. It was further enhanced by au-
tomatically choosing its main parameters, including
the SVD truncation level, based on the evaluated
data (Chicco and Masseroli, 2013). The SVD has
also been used with annotation co-occurrence weights
based on gene-term frequencies (Done et al., 2007)
and (Pinoli et al., 2014b). Being based on simple
matrix decomposition operations, these methods are
independent of both the chosen organism and func-
tion term vocabulary involved in the annotation set.
Anyway, obtained results highlighted their poor per-
formance in terms of accuracy.
Other methods based on evaluation of co-
occurrences exist; in particular the ones related to La-
tent Semantic Indexing (LSI) (Dumais et al., 1988),
which have been originally proposed in Natural Lan-
guage Processing. Among them, the probabilistic
Latent Semantic Analysis (pLSA) (Hofmann, 1999)
gives a well defined distribution of sets of terms as
an approximation of the co-occurrence matrix. It uses
the latent model of a set of terms to increase robust-
ness of annotation prediction results. In (Masseroli
et al., 2012) and (Pinoli et al., 2013), pLSA proved
to provide general improvements with respect to
the truncated SVD method of Khatri and colleagues
(Khatri et al., 2005).
In bioinformatics, topic modeling has been lever-
aged also by using the Latent Dirichlet Allocation
(LDA) algorithm (Blei et al., 2003). In (Bicego et al.,
2010) and (Perina et al., 2010), LDA was used to sub-
divide expression microarray data into clusters. Be-
sides, they defined a new model able to consider a
given dependence between genes; this dependence is
introduced in the model through a variable that rep-
resents a categorization of the genes and that can be
inferred from a priori knowledge on the evaluated
genes. Very recently, Pinoli et al. (Pinoli et al., 2014a)
KDIR2014-InternationalConferenceonKnowledgeDiscoveryandInformationRetrieval
108

Table 1: Quantitative characteristics of the nine considered annotation datasets. Figures refer to the sum of direct and indirect
annotations not inferred from electronic annotation, i.e. without IEA evidence code.
Gallus gallus Bos taurus Danio rerio
CC MF BP CC MF BP CC MF BP
# considered genes 260 309 275 497 540 512 430 699 1,528
# considered terms 123 134 610 207 226 1,023 131 261 1,176
# annotations (July 2009) 3,442 1,927 8,709 7,658 3,559 18,146 4,813 4,826 38,399
# annotations (May 2013) 3,968 2,507 10,827 9,878 5,723 24,735 5,496 6,735 58,040
∆ annotations between GPDW versions
#∆ annotations 526 580 2,118 2,220 2,164 6,589 683 1,909 19,641
%∆ annotations 15.28 30.10 24.32 29.00 60.80 36.31 14.19 39.56 51.15
took advantage of the LDA algorithm, together with
the Gibbs sampling (Griffiths, 2002) (Casella and
George, 1992) (Porteous et al., 2008), to predict gene
annotations to GO terms. These methods strongly
overcome the ones based on linear algebra, but the
complexity of the underlying model and the slowness
of the training algorithms make these approaches ill-
suited when the size of the dataset grows.
In summary, previously proposed methods for
biomolecular annotation prediction either are general
and flexible, but provide only limited accuracy mainly
due to the simple model used, or improve prediction
performance by either leveraging a complex integra-
tive analytical framework, which often is difficult and
time consuming to be properly set up, or adopting
a more complex model, which in turn significantly
slows the prediction process in particular in the usual
case of many data to be evaluated.
3 GENOMIC DATASETS
In order to have easy access to subsequent versions
of gene annotations to be used as input to the con-
sidered algorithms or to evaluate the results that they
provide, we took advantage of the Genomic and Pro-
teomic Data Warehouse (GPDW) (Canakoglu et al.,
2012). In GPDW several controlled terminologies
and ontologies, which describe genes and gene prod-
ucts related features, functionalities and phenotypes,
are stored together with their numerous annotations
to genes and proteins of many organisms. These data
are retrieved from several well known biomolecular
databases. In the context of developing and testing
machine learning methods on genomic annotations,
GPDW is a valuable source since it is quarterly up-
dated and old versions are kept stored. We lever-
aged this feature in our method evaluation by consid-
ering differed versions of the GO annotations of the
genes of three organisms. In GPDW they are avail-
able with additional information, including an evi-
dence code that describes how reliable the annotation
is. We leveraged it by filtering out the less reliable
annotations, i.e. those with Inferred from Electronic
Annotation (IEA) evidence, from the datasets used for
our evaluation. Table 1 gives a quantitative descrip-
tion of the considered annotations.
In GPDW, as in any other biomolecular database,
only the most specific controlled annotations of each
gene are stored. This is because, when the controlled
terms used for the annotation are organized into an
ontology, as for the GO, biologists are asked to an-
notate each gene only to the most specific ontology
terms representing each of the gene features. In this
way, when a gene is annotated to a term, it is implic-
itly indirectly annotated also to all the more generic
terms, i.e. all the ancestors of the feature terms in-
volved in its direct annotations. This is called anno-
tation unfolding.
All direct and indirect annotations of a set of genes
can be represented by using binary matrices. LetG be
the set of genes of a certain organism and T a set
of feature terms. We define the annotation matrix A ∈
{0, 1}
|G|×|T |
as the matrix whose columns correspond
to terms and rows to genes. For each gene g ∈ G and
for each term t ∈ T , the value of the A(g,t) entry of
the annotation matrix is set according to the following
rule:
A(g,t) =
1, if g is annotated either to t
or to any of t descendants
0, otherwise
(1)
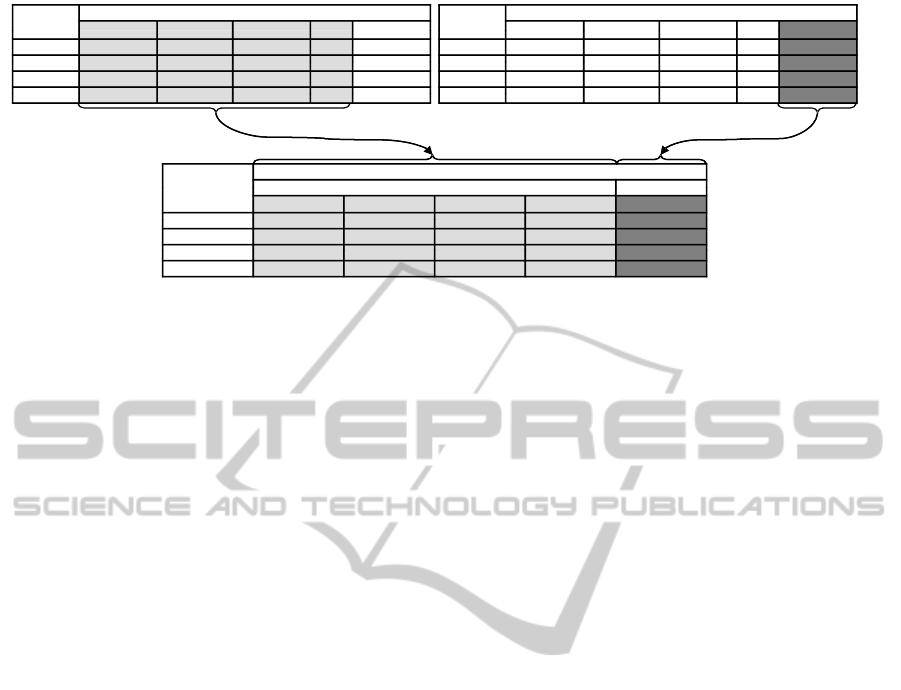
Examples of two versions of these matrices are shown
in Figure 1a and 1b, where A
1
is an updated version
of A
0
. Each GPDW update contains some number
of new discovered annotations, namely new 1 in the
matrix.
DiscoveringNewGeneFunctionalitiesfromRandomPerturbationsofKnownGeneOntologicalAnnotations
109
A
0
GO terms (Outdated version)
GO:0043226 GO:0005575 GO:0005623 GO:005737
A
1
GO terms (Updated version)
GO:0043226 GO:0005575 GO:0005623 GO:005737GO:0043226 GO:0005575 GO:0005623 … GO:005737
Gene
1
0 1 0 … 0
Gene 1 0 0 0
GO:0043226 GO:0005575 GO:0005623 … GO:005737
Gene
1
0 1 1 … 1
Gene 1 0 1 0Gene
2
1 0 0 … 0
… … … … … …
G 0 1 1 1
Gene
2
1 0 1 … 0
… … … … … …
G 1 1 1 1Gene
n
0 1 1 … 1 Gene
n
1 1 1 … 1
M
t GO 005737
GO terms
features label
M
t=GO:005737
features label
GO:0043226 GO:0005575 GO:0005623 … GO:005737
Gene 0 1 0 1Gene
1
0 1 0 … 1
Gene
2
1 0 0 … 0
… … … … … …
Gene
n
0 1 1 … 1
(a)
(b)
(c)
Figure 1: Illustrative diagram of the data representation. The data set (c) is created with an older annotation version A
0
(a) for
the features and an uptdated version A
1
(b) for the labels.
4 ANNOTATION DISCOVERY
METHODS
4.1 Data and Problem Modelling
Given a feature term t, we want to predict if a gene
g is likely to be, or not to be, annotated to that term
t, i.e. if the element A(g, t) of the annotation matrix
is likely to be 1, or 0. This can be modelled as a su-
pervised problem, in which the predicted class is a
term, i.e. a column of the matrix, that can be 0 or
1 according to the presence or absence of annotation
between the gene and the term, while all other annota-
tions of the gene represent the features of the record,
as in Figure 1c. Considering that predictions must be
made for all the terms t ∈ T , i.e. all the columns of the
matrix, the problem can be modeled as a supervised
multi-label classification, with the difference that we
do not have a distinct set of features and labels, but
we have a set of terms that are both classes and fea-
tures. To address this problem, we use the most com-
mon approach in the literature, i.e. transform it into a
set of binary classification problems, which can then
be handled using single-class classifiers. Henceforth,
for simplicity of exposition, we will refer to a single
supervised task concerning the discovery of a new an-
notation of the gene g to the term t (for instance the
term GO:005737 in Figure 1), which is then repeated
iteratively for all other genes and terms.
Let’s now see how to assign a label to each in-
stance of the data model. Given an annotation matrix,
our proposal is to use as input a version of the ma-
trix with less annotations (referred as outdated matrix,
since it may resemble an outdated annotation dataset
version); then, to derive from such input matrix the
features of the data model, and consider as label of
each record the presence or absence of an annotation
in a more complete matrix (referred as updated ma-
trix, since it may resemble a newer annotation dataset
version). This representation is sketched in Figure 1.
Given the feature term t considered for the prediction,
called class-term, the representation of the data is cre-
ated by taking as features, for each gene, all the anno-
tations to all the other terms in an outdated version of
the matrix A
0
, while the label is given by the value
of the class-term in the updated version of the matrix
A
1
. Henceforth, we refer to this representation matrix
as M
t
, where t is the class-term of the model.
This data representation is exactly the same as that
of a supervised classification problem represented in
a Vector Space Model. Thus, a classic supervised task
could be envisaged by subdividing this new matrix M
t
horizontally and using a part of the genes to train the
model and the remaining part to test it. In this domain,
however, this approach is not applicable because it
implies the availability of at least the part of the up-
dated matrix to train the model, but new datasets are
only released as a whole and not partially. Thus, the
purpose is to predict which annotations are missing
in the entire matrix, rather than on some part of it.
The data representation matrix M
t
requires informa-
tion from two different annotation dataset versions.
Thus, since the aim is to make predictions over the en-
tire dataset, to train the model we use a matrix M
train
t
that is created by using the information from both the
latest version currently available at training time, i.e.
A
1
, and an older version of the matrix with missing
annotations, i.e. A
0
. With this two different versions
of the matrices, the training set is created by using
the features derived from the outdated version A
0
and
the labels from the updated one A
1
. Then, the vali-
dation of the classification model has to be made by
discovering new annotations, missing in the current
state of the matrix. Therefore, the features regarding
the current version A
1
and labeled with the values of
KDIR2014-InternationalConferenceonKnowledgeDiscoveryandInformationRetrieval
110

a future updated matrix A
2
are used to create the val-
idation matrix M
validation
t
. The training and validation
data representation process is sketched in Figure 2.
A
0
GO terms
Other terms t
Gene
1
Gene
1
Gene
2
…
Gene
M
t
train
features label
Training set
Gene
n
Gene
1
Gene
2
…
A
1
GO terms
Other terms t
Gene
1
Gene
n
Gene
2
…
Gene
n
Validation set
GO terms
M
t
valid
features label
Gene
1
G
A
2
GO terms
Other terms t
Gene
1
G
Gene
2
…
Gene
n
Gene
2
…
Gene
n
Figure 2: Illustrative diagram of the dataset representation
for the prediction model of the annotations to a term t. The
training set (M
train
) is created with an older annotation ver-
sion A
0
for the features and the current annotation version
A
1
for the labels. Similarly, the validation set (M
valid
) is
created using A
1
and a future updated annotation matrix A
2
.
4.2 Random Perturbation
The supervised problem modelling described in the
previous subsection requires, at training time, two
versions of the annotation matrix to create the super-
vised model, i.e. A
0
and A
1
. However, biologists typ-
ically have available only the most updated version of
the annotation matrix, not keeping stored the outdated
versions for space reasons, given the large amount of
data. Thus, with reference to Figure 1, there is avail-
able only one version of the matrix, i.e. only the cur-
rent version A
1
, with which the training data repre-
sentation M
train
t
is created.
To overcome the problem just mentioned, we start
from the observation that also the input matrix A
1
contains missing annotations. Therefore, we could
use only this matrix to obtain the representation M
t
,
assuming A
0
= A
1
. However, the classification model
will have to discover new gene-term annotations start-
ing from an outdated matrix; thus, it will be more
effective if it is trained with a training set in which
the features are taken from an outdated matrix, with
a greater number of missing annotations than the ma-
trix version from which the labels of the instances are
obtained. If we consider that the annotations of genes
to features are discovered by teams of biologists that
work independently from each other, a reasonable hy-
pothesis is that the new annotations discovered by the
entire scientific community, on the whole, do not have
any kind of bond or rule. This should be equivalent
to a random process of discovery of new annotations.
Such considerations led to our thesis that new gene
annotations can be better discovered by artificially in-
creasing the number of missing annotations in the in-
put matrix A
0
. Since, as mentioned, usually only the
input matrix A
1
is available, this can be achieved by
randomly deleting known annotations in the matrix
A
1
to obtain a new matrix A
0
artificially perturbed.
Thus, to get the data to train the classification
model, we propose to randomly perturb the matrix A
1
to create a new matrix A
0
, in which some annotations
are eliminated with a probability p. In this way we
obtain the matrix A
0
= random perturbation(A
1
, p).
Formally, for each gene g and term t, the perturbation
is done as follows:
A
0
(g,t) =
0 if A
1
(g,t) = 1 ∧ random 6 p
1 if A
1
(g,t) = 1 ∧ random > p
0 if A
1
(g,t) = 0
(2)
Once the perturbed matrix A
0
is generated, to en-
sure its correctness with respect to the unfolding of
the annotations, the matrix A
0
is corrected by switch-
ing to 0 also all the annotations to the same gene of
all the descendants of the ontological terms with mod-
ified gene annotation; we call this process perturba-
tion unfolding. It is important to note that, depending
on this correction, the percentage of the actual modi-
fied annotations of the matrix A
0
will hence be greater
than the percentage derived from p. The overall data
representation process is the same as that shown in
Figure 2, with the difference that the matrix A
0
is cre-
ated by perturbing randomly A
1
.
Considering the annotation unfolding in the GO,
in order to avoid trivial predictions (i.e. 1 if a child
is 1), in the set of features of the dataset M
t
all the
descendants or ancestors of the term t are not taken
into consideration. Once created the training matrix
M
train
t
, we can use any supervised algorithm, capa-
ble of returning a probability distribution, to train the
prediction model and then validate it with M
validation
t
.
The predicition model provides a probability distribu-
tion pd(g,t), called likelihood, concerning the pres-
ence of an annotation of the gene g to the term t.
To provide predictions of only new annotations, only
those annotations that were missing in the outdated
version of the matrix are taken into account. The su-
pervised process described above is repeated for all
the terms t ∈ T , giving as final output a list of predic-
tions of new gene annotations ordered according to
their likelihood; the illustrated annotation discovery
workflow is sketched in Figure 3.
DiscoveringNewGeneFunctionalitiesfromRandomPerturbationsofKnownGeneOntologicalAnnotations
111
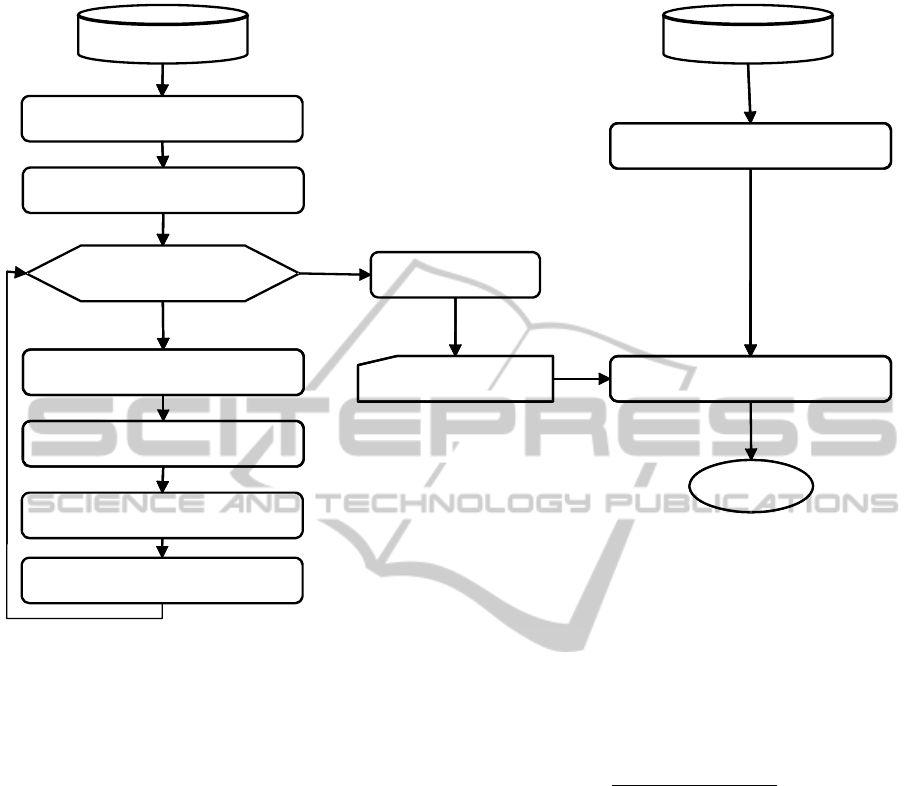
Updated GPWDOutdated GPWD
Retrieve the Annotation matrix A
1
(excluding IEAs)
Retrieve the updated Annotation
matrix A (excluding IEAs)
Perturb randomly the matrix
with
probability p,
obtaining
A
0
2
For each term
Apply the likelihood
correction
Create the training set with A
0
for
the features and A
1
for the labels
Count the confirmed predictions
List of predicted
t ti
Train the supervised model
anno a ons
Create the validation set with A
0
for
the features
Result
Make predictions
t T
∈
Then
A
1
the
matrix
Figure 3: Workflow of the training and validation processes.
4.3 Likelihood Correction
As shown above, the output of the supervised model
is a list of predicted annotations, each one with a like-
lihood degree. According to the hierarchical structure
of GO, when a gene is annotated to an ontological
term, it must be also annotated to all the ancestors of
that term; this constraint is also known as True Path
Rule (Tanoue et al., 2002). The supervised classifier,
however, provides a likelihood for each gene anno-
tation regardless of the predictions of the annotation
of other GO terms to the same gene. This can result
in possible cases of anomalies in which a gene shall
be annotated to a term, but not to one or more of its
ancestor terms, thus violating the True Path Rule. To
obtain a likelihood that takes into account the hierar-
chy of the terms, once obtained the likelihood of each
gene-term association, we proceed as follows:
1. For each novel gene-term annotation, to the prob-
ability given by the model we add the average of
all the probabilities of the novel annotations of the
gene to all the ancestors of the term. Note that,
since the classification model provides in output a
probability distribution ranging between 0 and 1,
the hierarchical likelihood of each gene-term an-
notation shall be between 0 and 2, as follows:
pd
H
(g,t) =
∑
t
a
∈ancestors(t)
pd(g,t
a
)
|ancestors(t)|
+ pd(g,t) (3)
2. Once the likelihood is made hierarchical, the cor-
rection of the possible anomalies regarding the
True Path Rule is taken into account. An iterative
process is carried on from the leaf terms to the
root term of the hierarchy, upgrading each likeli-
hood with the maximum likelihood value of the
descendant terms, as follows:
l(g,t) = max{pd
H
(g,t), max
t
c
∈children(t)
{pd
H
(g,t
c
)}}
(4)
In such a way, for each ontology term, the like-
lihood of a gene to be annotated to that term is
always greater than or equal to the likelihood of
the gene to be annotated to the term descendants.
4.4 Evaluation
In our experiments we tested the effectiveness of su-
pervised models in discovering new functional gene
KDIR2014-InternationalConferenceonKnowledgeDiscoveryandInformationRetrieval
112

Table 2: Validation results of the predictions obtained by varying the supervised algorithm used to build the prediction model.
The results show, for each of the nine considered datasets, the amount of the top 250 predicted gene annotations to the GO BP,
MF and CC terms that have been found confirmed in the updated GPDW version. The setup of these experiments was done
with random perturbation of the training matrix with probability p = 0.05. The first column (SIM) reports the results obtained
in (Pinoli et al., 2014b) with the SIM best configuration. Each result is reported as the average and corresponding standard
deviation of 10 experiments repeated by changing the random perturbation seed. In bold the best result for each dataset.
Dataset
SIM IBk J48 Logistic NB RF SMO
Gallus g. - BP
86 58.6±20.2 47.2±4.7 32.7±6.8 25.4±4.4 52.7±12.1 28.7±9.3
Gallus g. - MF
24 58.0±5.6 79.7±12.7 40.0±10.4 14.2±1.6 54.4±9.6 50.7±14.3
Gallus g. - CC
50 81.5±8.2 73.4±8.5 31.9±6.4 23.5±3.7 55.2±11.3 29.6±4.0
Bos t. - BP
55 48.9±6.8 49.7±5.1 37.0±6.5 28.4±4.2 62.4±7.6 31.2±4.6
Bos t. - MF
28 58.2±4.4 58.8±10.5 27.5±4.3 15.7±2.9 57.5±11.2 36.9±4.4
Bos t. - CC
91 112.0±9.7 94.3±9.8 38.2±5.3 8.2±2.0 93.7±10.4 48.4±6.8
Danio r. - BP
35 70.9±15.9 59.8±6.1 31.0±4.8 25.2±3.3 58.1±5.1 16.6±2.3
Danio r. - MF
35 77.5±10.3 75.8±7.1 54.4±11.0 41.2±2.7 83.1±9.6 79.7±8.7
Danio r. - CC
44 81.5±8.5 69.3±8.7 27.6±7.6 26.2±6.6 92.3±11.0 30.2±6.6
Total
447 647.1 608.8 320.3 207.9 609.4 352.0
Table 3: Validation results of the predictions obtained using IBk as supervised algorithm and varying the probability p of
random perturbation of the training matrix. The results show, for each of the nine considered datasets, the amount of the
top 250 predicted gene annotations to the GO BP, MF and CC terms that have been found confirmed in the updated GPDW
version. Each result is reported as the average and corresponding standard deviation of 10 experiments repeated by changing
the random perturbation seed. In bold the best result for each datasets.
Dataset
p = 0 p = 0.05 p = 0.10 p = 0.15 p = 0.20 p = 0.25 p = 0.30
Gallus g. - BP
42 58.6±20.2 54.8±16.2 51.3±12.5 55.9±10.4 50.2±10.2 47.4±9.7
Gallus g. - MF
50 58.0±5.6 61.8±11.0 59.5±13.0 58.3±10.2 63.6±13.5 64.2±8.4
Gallus g. - CC
75 81.5±8.2 77.5±9.7 82.2±8.1 78.1±7.5 73.3±13.2 78.8±12.0
Bos t. - BP
43 48.9±6.8 51.7±10.1 50.4±8.4 53.1±9.6 52±12.5 52.2±15.4
Bos t. - MF
58 58.2±4.4 62.7±7.7 71.4±10.9 73±12.6 74.7±11.6 77.0±13.0
Bos t. - CC
108 112.0±9.7 114.3±11.0 118.6±13.0 118.1±13.0 119.0±13.1 116.7±22.0
Danio r. - BP
55 70.9±15.9 70.6±16.5 74.8±13.9 85.7±25.6 83.1±16.3 90.6±19.4
Danio r. - MF
76 77.5±10.3 72.5±7.1 67.7±10.1 62.0±7.6 58.4 ±8.7 51.4±15.1
Danio r. - CC
79 81.5±8.5 84.7±8.7 90.7±10.0 85.6±13.5 83.3±14.5 75.8±19.9
Total
586 647.1 650.6 666.6 669.8 661.6 654.1
annotations from the available annotations. Since the
proposed method is applicable to any supervised algo-
rithm that returns a probability distribution, we tested
different types of existing algorithms in order to mea-
sure their effectiveness, in particular: Support Vector
Machines, nearest neighbors, decision trees, logistic
regressions and naive bayes, using the implementa-
tions provided by Weka
1
in its 3.7.9 version. In the
experiments we tested the Weka classifiers: IBk (with
k = 3), J48, Logistic, Naive Bayes (NB), Random For-
est (RF) and SMO. For each algorithm we used the
default parameter settings provided by Weka; no tun-
ing of parameters has been done for time reasons.
We measured the effectiveness of the predictions
in the same way it was done in (Pinoli et al., 2014b),
in order to be able to directly compare our results with
those in that work; the overall procedure was as fol-
lows.
1
http://www.cs.waikato.ac.nz/ml/weka/.
1. We extracted the input annotations from an out-
dated version of the GPDW (July 2009), exclud-
ing from those annotations the ones less reliable,
i.e. with IEA evidence code.
2. We randomly perturbed the unfolded annotation
matrix to get a modified version of it, with some
missing annotations.
3. By running the prediction algorithm, we got a list
of predicted annotations ordered by their confi-
dence value (i.e. their corresponding likelihood
l(g,t)).
4. We selected the top P predictions (we use P =
250) and we counted how many of these P pre-
dictions were found confirmed in the updated ver-
sion of the GPDW (May 2013 version), regardless
their evidence code.
5. For each experiment, steps 2, 3, 4 were repeated
10 times by varying the random seed. The effec-
DiscoveringNewGeneFunctionalitiesfromRandomPerturbationsofKnownGeneOntologicalAnnotations
113
tiveness of each experiment was determined by
averaging the counts obtained in all the experi-
ment repetitions.
We depict the training and validation procedure work-
flows in Figure 3.
5 RESULTS
Table 2 shows the results obtained by varying the su-
pervised algorithm used to train the prediction model,
always using a fixed random perturbation probability
p = 0.05. Considering that the best result obtained in
(Pinoli et al., 2014b) was a total of 447 correct predic-
tions, Table 2 shows that, with the proposed method, 3
out of 6 of the tested algorithms outperform the results
obtained in (Pinoli et al., 2014b). These results are
excellent if we consider that they are obtained with-
out any tuning of the algorithm parameters, therefore
there is margin to improve them with an appropriate
tuning. According to the results in Table 2, we can in-
fer that using the standard parameterization provided
by Weka, the algorithm that obtains the best results is
IBk, with an improvement of 44.8% compared with
the results of (Pinoli et al., 2014b). IBk results also
6.2% better than Random Forest and 6.3% better than
J48, the only other two supervised algorithms consid-
ered that result better than (Pinoli et al., 2014b).
The proposed method introduces a new parame-
ter: the probability p of the random perturbation of
the training matrix. Table 3 shows the results obtained
by varying the probability p and using the best super-
vised algorithm from Table 2, namely IBk. These re-
sults show that the best predictions are obtained with
p = 0.2. Considering the perturbation unfolding, this
p value leads to a perturbed matrix A
0
with more
than 20% of annotations less than in A
1
(empirically
they are about 30% less). Such percentage is very
close to the average value of the variation of num-
ber of annotations between A
2
and A
1
, i.e. 33.4%,
notable in Table 1. Moreover, the probability p that
gets the best results for each dataset seems to have a
relationship with the dataset annotation variation be-
tween A
2
and A
1
. This result leads to the conjectures
that i) representing new annotations randomly leads
to train a classifier able to predict the actual new an-
notations between two different annotation versions;
ii) the more the amount of artificial missing annota-
tions introduced in the training set is comparable to
the actual missing annotations in the validation set,
the more the predictions are accurate. Another result
deducible from Table 3 is that using p = 0, namely
the annotation matrix is not perturbed (A
0
= A
1
), we
get anyway good results, higher than those in (Pinoli
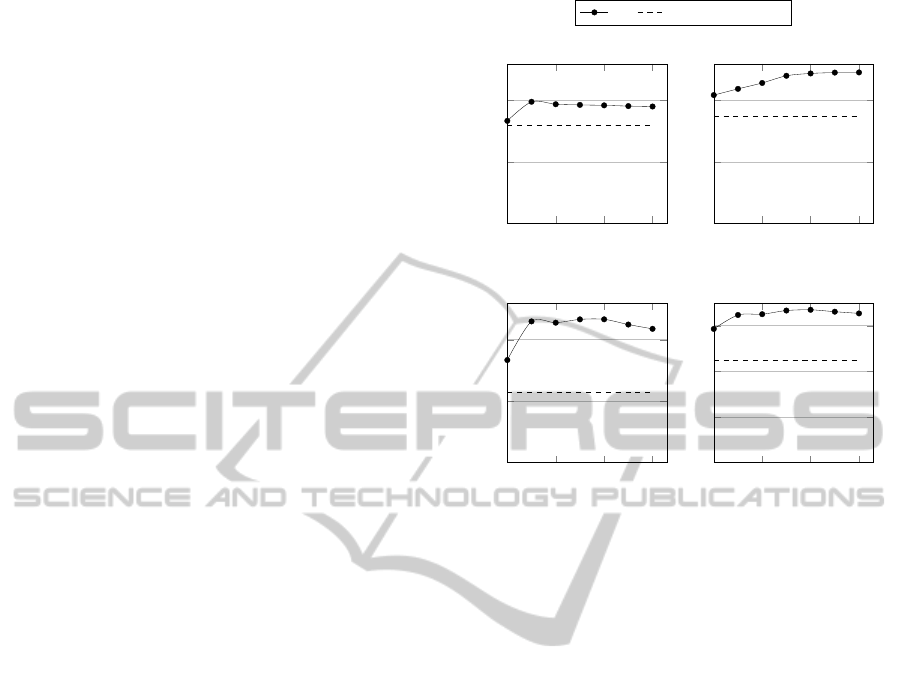
0 0.1 0.2 0.3
0
100
200
Probability of perturbation
# Predictions
A. Gallus gallus
IBk Pinoli et al. 2013b
0 0.1 0.2 0.3
0
100
200
Probability of perturbation
B. Bos taurus
0 0.1 0.2 0.3
0
100
200
Probability of perturbation
# Predictions
C. Danio Rerio
0 0.1 0.2 0.3
0
200
400
600
Probability of perturbation
D. Total
Figure 4: Validation results of the predictions obtained by
varying the probability of perturbation p, compared with
those obtained in (Pinoli et al., 2014b). The results show,
for each organism in the A, B and C charts, the sum of the
predicted annotations that have been found confirmed in the
updated GPDW version of the three GO ontologies. The
chart D shows the total values for all the organism.
et al., 2014b). This is important since it allows to
avoid the parameter p and the tuning of the system
for any considered dataset when not top performance
is required. For a graphical view, the results discussed
are also shown in Figure 4, grouped by considered
organism. Our approach outperforms the best accu-
racy achieved in (Pinoli et al., 2014b) of 49.66%, in
particular we obtain the highest improvement for big
datasets, i.e. in the Danio rerio dataset there is an
improvement of 104.56% of the correct annotations
predicted.
6 DISCUSSION AND
CONCLUSIONS
The method proposed in this paper discovers new GO
term annotations for genes of different organisms,
based on available GO annotations of these genes,
outperforming the state of the art. Our approach is
based on the labeling of each ontological term of an
outdated annotation profile of a gene with a label
taken from an updated version of the gene annota-
tion profile. In this way the model is trained to rec-
KDIR2014-InternationalConferenceonKnowledgeDiscoveryandInformationRetrieval
114

ognize the presence of novel gene annotations using
the obsolete annotation profile of the gene. The appli-
cation of this method requires two different versions
of the annotation matrix to build representations of
the training data. However, biologists typically have
available only the most updated version of the gene
annotation matrix. Given this constrain, we have pro-
posed a method to represent the training data using
a single annotation matrix as input. It is based on
creating a different annotation matrix, representing an
older version of the input one, by perturbing the input
one in order to randomly remove some of its annota-
tions. This allows the use of supervised algorithms
even in datasets without labels and the comparison
of supervised algorithm results with those obtained
by unsupervised methods on the same originally un-
labeled datasets.
Obtained results are very encouraging, since they
show a great improvement compared with unsuper-
vised techniques. Furthermore, these results could be
even better with an appropriate tuning of the parame-
ters of the supervised algorithms used; our purpose is
to thoroughly investigate this aspect in the future.
From the obtained results we can see that by in-
creasing the number of perturbed (removed) annota-
tions, the results improve, reaching a peak when the
number of artificial missing annotations in the train-
ing set is comparable to the number of those in the
validation set, i.e. when the variety of missing an-
notations has been fully mapped in the training set.
Furthermore, it is noteworthy also the case where we
do not perturb the training matrix, avoiding the tuning
of the parameter p, which gets anyway good results.
We plan to further verify the effectiveness of the pro-
posed approach, also applying weighting schemes on
the data representation.
ACKNOWLEDGEMENTS
This research is part of the “GenData 2020” project
funded by the Italian MIUR. The authors would like
to thank Claudio Sartori for the useful discussions
about data mining algorithms.
REFERENCES
Barutcuoglu, Z., Schapire, R. E., and Troyanskaya, O. G.
(2006). Hierarchical multi-label prediction of gene
function. Bioinformatics, 22(7):830–836.
Bicego, M., Lovato, P., Oliboni, B., and Perina, A. (2010).
Expression microarray classification using topic mod-
els. In Proceedings of the 2010 ACM Symposium on
Applied Computing, pages 1516–1520. ACM.
Blei, D. M., Ng, A. Y., and Jordan, M. I. (2003). Latent
dirichlet allocation. the Journal of machine Learning
research, 3:993–1022.
Canakoglu, A., Ghisalberti, G., and Masseroli, M. (2012).
Integration of biomolecular interaction data in a ge-
nomic and proteomic data warehouse to support
biomedical knowledge discovery. In Computational
Intelligence Methods for Bioinformatics and Bio-
statistics, pages 112–126. Springer.
Casella, G. and George, E. I. (1992). Explaining the gibbs
sampler. The American Statistician, 46(3):167–174.
Chicco, D. and Masseroli, M. (2013). A discrete optimiza-
tion approach for svd best truncation choice based
on roc curves. In Bioinformatics and Bioengineering
(BIBE), 2013 IEEE 13th International Conference on,
pages 1–4. IEEE.
Chicco, D., Tagliasacchi, M., and Masseroli, M. (2012).
Genomic annotation prediction based on integrated in-
formation. In Computational Intelligence Methods
for Bioinformatics and Biostatistics, pages 238–252.
Springer.
Done, B., Khatri, P., Done, A., and Draghici, S. (2007). Se-
mantic analysis of genome annotations using weight-
ing schemes. In Computational Intelligence and
Bioinformatics and Computational Biology, 2007.
CIBCB’07. IEEE Symposium on, pages 212–218. IET.
Done, B., Khatri, P., Done, A., and Draghici, S. (2010).
Predicting novel human gene ontology annotations us-
ing semantic analysis. IEEE/ACM Transactions on
Computational Biology and Bioinformatics (TCBB),
7(1):91–99.
Dumais, S. T., Furnas, G. W., Landauer, T. K., Deerwester,
S., and Harshman, R. (1988). Using latent semantic
analysis to improve access to textual information. In
Proceedings of the SIGCHI conference on Human fac-
tors in computing systems, pages 281–285. ACM.
GO Consortium et al. (2001). Creating the gene ontology
resource: design and implementation. Genome re-
search, 11(8):1425–1433.
Griffiths, T. (2002). Gibbs sampling in the generative model
of latent dirichlet allocation. Standford University,
518(11):1–3.
Hofmann, T. (1999). Probabilistic latent semantic index-
ing. In Proceedings of the 22nd annual international
ACM SIGIR conference on Research and development
in information retrieval, pages 50–57. ACM.
Khatri, P., Done, B., Rao, A., Done, A., and Draghici, S.
(2005). A semantic analysis of the annotations of the
human genome. Bioinformatics, 21(16):3416–3421.
King, O. D., Foulger, R. E., Dwight, S. S., White, J. V.,
and Roth, F. P. (2003). Predicting gene function from
patterns of annotation. Genome research, 13(5):896–
904.
Masseroli, M., Chicco, D., and Pinoli, P. (2012). Proba-
bilistic latent semantic analysis for prediction of gene
ontology annotations. In Neural Networks (IJCNN),
The 2012 International Joint Conference on, pages 1–
8. IEEE.
Pandey, G., Kumar, V., and Steinbach, M. (2006). Compu-
DiscoveringNewGeneFunctionalitiesfromRandomPerturbationsofKnownGeneOntologicalAnnotations
115

tational approaches for protein function prediction: A
survey. Technical report, Minneapolis, MN, USA.
P
´
erez, A. J., Perez-Iratxeta, C., Bork, P., Thode, G., and An-
drade, M. A. (2004). Gene annotation from scientific
literature using mappings between keyword systems.
Bioinformatics, 20(13):2084–2091.
Perina, A., Lovato, P., Murino, V., and Bicego, M. (2010).
Biologically-aware latent dirichlet allocation (balda)
for the classification of expression microarray. In Pat-
tern Recognition in Bioinformatics, pages 230–241.
Springer.
Pinoli, P., Chicco, D., and Masseroli, M. (2013). Enhanced
probabilistic latent semantic analysis with weighting
schemes to predict genomic annotations. In Bioinfor-
matics and Bioengineering (BIBE), 2013 IEEE 13th
International Conference on, pages 1–4. IEEE.
Pinoli, P., Chicco, D., and Masseroli, M. (2014a). Latent
dirichlet allocation based on gibbs sampling for gene
function prediction. In Proceedings of the Interna-
tional Conference on Computational Intelligence in
Bioinformatics and Computational Biology, pages 1–
7. IEEE Computer Society.
Pinoli, P., Chicco, D., and Masseroli, M. (2014b). Weight-
ing scheme methods for enhanced genome annota-
tion prediction. In Computational Intelligence Meth-
ods for Bioinformatics and Biostatistics (CIBB), 2013
10th International Meeting on, pages 76–89. LNBI,
Springer International Publishing.
Porteous, I., Newman, D., Ihler, A., Asuncion, A., Smyth,
P., and Welling, M. (2008). Fast collapsed gibbs sam-
pling for latent dirichlet allocation. In Proceedings
of the 14th ACM SIGKDD international conference
on Knowledge discovery and data mining, pages 569–
577. ACM.
Raychaudhuri, S., Chang, J. T., Sutphin, P. D., and Altman,
R. B. (2002). Associating genes with gene ontology
codes using a maximum entropy analysis of biomedi-
cal literature. Genome Research, 12(1):203–214.
Tanoue, J., Yoshikawa, M., and Uemura, S. (2002). The
genearound go viewer. Bioinformatics, 18(12):1705–
1706.
Tao, Y., Sam, L., Li, J., Friedman, C., and Lussier, Y. A.
(2007). Information theory applied to the sparse gene
ontology annotation network to predict novel gene
function. Bioinformatics, 23(13):i529–i538.
KDIR2014-InternationalConferenceonKnowledgeDiscoveryandInformationRetrieval
116
