
On the Importance of Flow Direction in Business Process Models
Kathrin Figl and Mark Strembeck
Institute for Information Systems and New Media,
WU - Vienna University of Economics and Business, Welthandelsplatz 1, Vienna, Austria
Keywords: Model Layout, Reading Direction, Flow Direction, Business Process Models.
Abstract: In today’s modeling practice we can observe a convention to model business processes from left-to-right or
from top-to-bottom. Even though the choice of flow direction changes the visual appearance of a process
model significantly, this convention is barely discussed by standard documents and modeling guidelines. In
addition, most recommendations related to the flow direction are neither based on scientific claims nor on
empirical evidence regarding their effectiveness in terms of readability. In this position paper, we discuss
the importance of process model flow direction from a scientific viewpoint. In particular, we give a
comprehensive overview of theoretical perspectives which offer explanations why a left-to-right flow
direction for process models should be superior to other directions.
1 INTRODUCTION
Over the past decades business processes have
developed into an essential means for the
specification of the operational procedures in
business companies and other professional
organizations (see, e.g., Weske, 2007). Therefore,
such processes do also directly affect the software
systems that need to support the corresponding
process flows.
In recent years, so called process-aware
information systems (PAIS) emerged (see, e.g.,
Dumas et al., 2005) that facilitate the definition,
execution, and monitoring of process flows.
However, real-world process descriptions may
become fairly complex. For example, a process flow
may include sequential as well as parallel task
executions. In addition, we often have loops where
certain tasks are performed repeatedly. Moreover, a
process description has to consider certain
conditions that determine which of several
alternative tasks needs to be performed in a certain
situation.
Thus, in order to correctly define the
corresponding process flows and communicate them
to the different stakeholders, we need an expressive
and comprehensible means to illustrate process
descriptions. In this context, different graphical
process modeling languages emerged, each of which
provides a customized symbol set. A number of
recent publications investigated the impact of
different graphical symbols on process model
comprehension (see, e.g., Figl et al., 2013a, Figl et
al., 2013b). However, aside from symbol set design,
a number of additional notational factors exist that
may influence process model comprehension (see,
e.g., Mendling et al., 2012, Reijers et al., 2011).
One of the comprehension factors that has not
been intensively investigated yet is the modeling
direction. In principle, process flows can be modeled
from the left-hand side to the right-hand side or vice
versa. Or they can be modeled from top-to-bottom or
vice versa. For instance, the example models from
the BPMN (Business Process Model and Notation)
standard (Object Management Group, 2013a) and
the example models of activity diagrams from the
UML standard (Object Management Group, 2013b)
are typically modeled from left-to-right. Other
modeling directions are rather uncommon.
Figure 1 shows an excerpt of four process
models, which are structurally and semantically
equivalent, but use different flow directions.
While other layout factors of models (Effinger et
al., 2011, Schrepfer et al., 2009) and their
relationship to model understanding have already
been investigated, to the best of our knowledge no
theoretical discussion of flow direction has so far
been undertaken. To fill this research gap, this paper
presents a cumulative body of relevant knowledge
and discusses the theoretical impact of different flow
directions on process model comprehension.
132
Figl K. and Strembeck M..
On the Importance of Flow Direction in Business Process Models.
DOI: 10.5220/0005090401320136
In Proceedings of the 9th International Conference on Software Engineering and Applications (ICSOFT-EA-2014), pages 132-136
ISBN: 978-989-758-036-9
Copyright
c
2014 SCITEPRESS (Science and Technology Publications, Lda.)
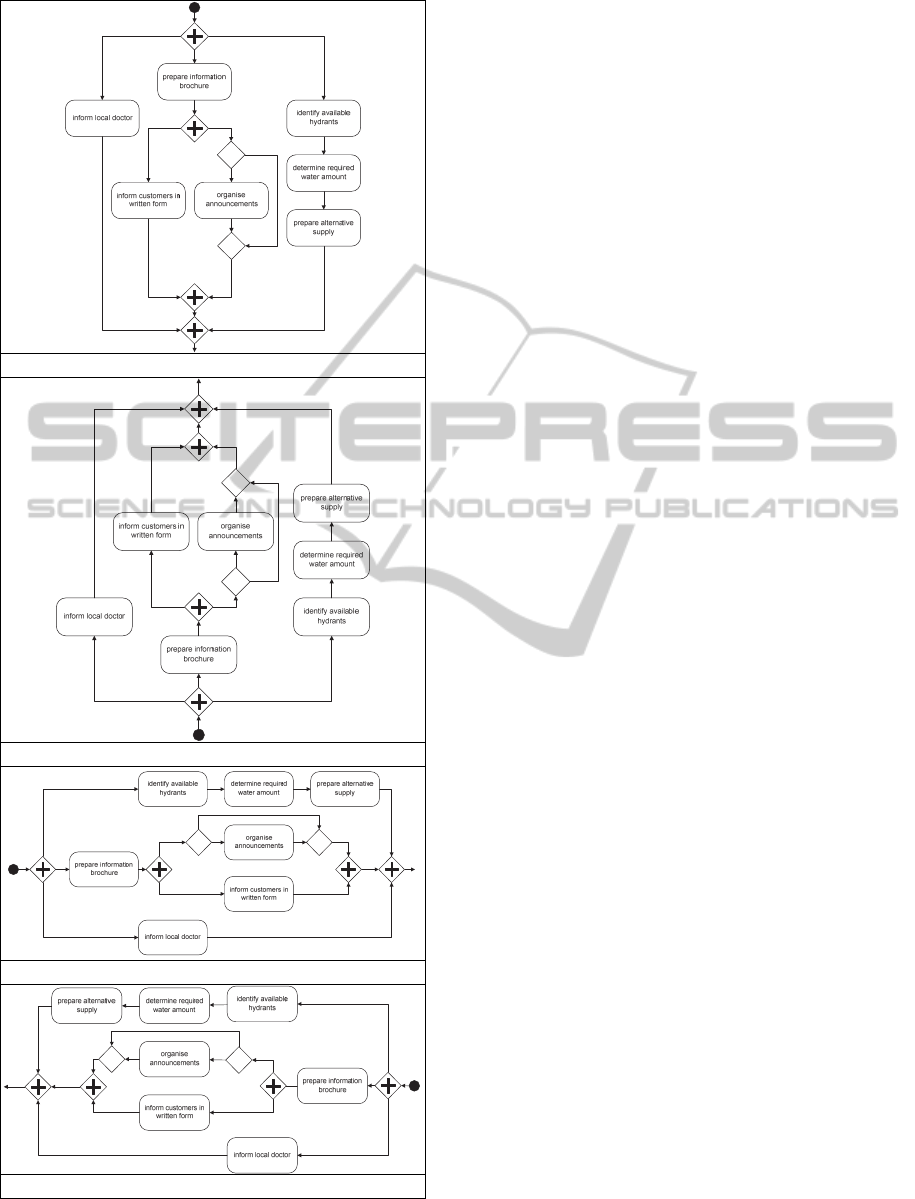
top-to-bottom
bottom-to-top
left-to-right
right-to-left
Figure 1: Detail of a BPMN process model in different
flow directions.
2 MODELLING STANDARDS
AND CONVENTIONS
Basic information about recommended flow
directions in process models can be found in
standard documents or in scientific publications on
such notations. Petre (2006) describes such
information as secondary notation - “things which
are not formally part of a notation which are
nevertheless used to interpret it, such as conventions
(e.g., reading a circuit diagram left-to-right and top-
to-bottom)”. Informal knowledge on the secondary
notation can e.g. be found in guidelines, which, for
instance, suggest to keep a uniform flow and edge
direction in diagrams (Eichelberger and Schmid,
2009).
The BPMN standard document (Object
Management Group, 2013a, p. 40) gives the
following advice concerning modeling direction:
“An incoming Sequence Flow can connect to any
location on a Flow Object (left, right, top, or
bottom). Likewise, an outgoing Sequence Flow can
connect from any location on a Flow Object (left,
right, top, or bottom). …BPMN allows this
flexibility; however, we also RECOMMEND that
modelers use judgment or best practices in how
Flow Objects should be connected so that readers of
the Diagrams will find the behavior clear and easy to
follow. This is even more important when a Diagram
contains Sequence Flows and Message Flows. In
these situations it is best to pick a direction of
Sequence Flows, either left to right or top to bottom,
and then direct the Message Flows at a 90° angle to
the Sequence Flows. The resulting Diagrams will be
much easier to understand.”
Thus, the BPMN standard document suggests
using either a left-to right or top-to-bottom flow
direction for modeling the sequence flow of a
process model. However, the standard gives no
specific rationale why these flow directions should
be superior to others and does not clarify whether
left-to-right or top-to-bottom is actually better suited
for modeling the process flow. In the following, we
will discuss the use of left-to-right or top-to-bottom
orientations from several theoretical angels.
3 READING DIRECTION IN
DIAGRAMS AND CULTURAL
INFLUENCE
Petre (1995, p. 293) characterizes readers of
graphical notations to be “more like the reader of a
OntheImportanceofFlowDirectioninBusinessProcessModels
133

technical manual than the viewer of a painting: a
deliberate reader, goal-directed and hypothesis-
driven”. This means that expectations and prior
experience influence how people read diagrams and
search for information. Thus, readers of process
models actively use existing cues to find
information; their main cue for determining the
reading direction of the model is the direction of the
arrows which represent connections in the process
flow. Besides this visual hint on the flow direction,
users follow typical reading strategies for diagrams.
If not indicated otherwise, the usual reading
direction for diagrams is similar to the written
language: for example English-speaking individuals
expect to read diagrams from left-to-right and from
top-to-bottom (Winn, 1983, Gillespie, 1993). This is
due to a strong cultural influence of the direction of
written language for reading and drawing direction
in general. For instance English-speaking children
draw temporal concepts and call out names of
objects from left-to-right, whereas right-to-left was
dominant for Arabic and Hebrew-speaking children
(Tversky et al., 1991).
Nordbotton and Crosby (1999) provide empirical
evidence for reading strategy in the area of data
models with eye tracking technology. On average,
60% of their participants followed a text-like reading
strategy from left-to-right and top-to-bottom, 40%
an image-like reading strategy (starting in the center
followed by scanning in different directions).
Winn (1982, p. 80) states that “diagrams not
arranged in this logical sequence would lead to
difficulty in information processing and to less
learning.”. This is because people anticipate certain
characteristics in diagrams according to previously
learned diagram schemas, and understanding is
easier if diagrams match these expectations (Winn,
1983).
Indeed, Winn (1982) was able to demonstrate
that for native English speakers it is more difficult to
learn sequences in reversed-order (right-to-left) than
in normal-order (left-to-right) diagrams. Similarly,
research on flowcharts has shown, that directional
orientation influences problem solution quality, time
taken to view the charts and time taken to solve the
problems (Krohn, 1983). Participants performed best
when orientation of flowcharts was consistent with
reading direction (best results for left-to-right,
second-best results for top-to-bottom and worst
results for right-to-left flowcharts). They made fewer
errors and needed less time. The phenomenon that
consistency between direction in the learning
material and expected reading direction supports
reasoning was also confirmed in another context by
Harsel et al. (1987). They found that performance on
inductive reasoning tasks was higher when material
was presented in the direction of written language
(the Japanese sample performed better with the
vertical version, while the Australian sample
performed better with the horizontal version).
However, subjects can develop “reversed
diagram” schemas when working with reversed
diagrams (Winn, 1983). Winn found evidence for
this phenomenon by investigating eye-movements in
a study with right-to-left reversed diagrams. At first,
participants performed worse in information
searching tasks than participants with left-to-right
diagrams, because they started to search information
in the upper left quadrant of the diagram. Though,
after four trials they started looking at the bottom
left quadrant which contained more useful
information. Winn concludes that if diagrams
contradict usual schemas, they are more difficult to
understand and provoke more errors in information
search tasks, but an appropriate perceptual strategy
can be obtained after time.
4 CULTURAL CONVENTIONS OF
USING SPATIAL
ORIENTATIONS AND
SEMANTIC ASSOCIATIONS OF
SPATIAL ORIENTATIONS
Understanding complex processes demands logical
thinking and reasoning. We know from cognitive
psychology that humans use internal spatial
representations when they solve logical problems,
even for nonspatial and abstract problems (Handel et
al., 1968). In that context, a variety of studies have
revealed that humans use specific orientations (left,
right, top, bottom) for abstract semantic concepts
and that some associations are more likely than
others.
For instance, if participants get two premises as
“Tom is better than Bill” and “Bill is better than
Mike” and then have to answer the question “Is Tom
better than Mike?” they mentally imagine the names
on a vertical axis for problem solving. In a better-
worse relation they would imagine the “better”
individual above the “worse” individual, so “better
than” proceeds from top-to-bottom and “worse than”
from bottom-to-top (De Soto et al., 1965, p. 517).
Similarly, persons consistently spatially assign top-
to-bottom in a cognitive space for relation words as
“father-son” and “more-less” (Handel et al., 1968, p.
354). There is a strong association between “more,
ICSOFT-EA2014-9thInternationalConferenceonSoftwareEngineeringandApplications
134

better, and good” with upward and “less, worse, and
bad” with downward (Tversky et al., 1991, p. 518).
This can also be seen in linguistic metaphoric
expressions such as “She is feeling down today” or
in the fact that increases are usually displayed from
bottom-to-top in graphics (Tversky et al., 1991).
When turning to relation pairs relevant to the
context of process modeling, the scientific literature
reveals that there is a clear preference to assign
“earlier-later” to left-to-right followed by top-to-
bottom and to assign “cause-effect” to top-to-bottom
and left-to-right (Handel et al., 1968, p. 354).
According to Winn (1982) research has not yet
given clear answers on how diagrams could best
convey information about “the sequence of
concepts”, but following the above arguments, it
would be most naturally to design process models
from left-to-right, and top-to-bottom is likely to be
the second best option. These orientations would
also be consistent with a readers’ mental visual
orientation associated with the direction of a process
flow.
While it is not clear from the literature whether
these internal associations between semantic
concepts and spatial orientations are actually caused
by conventions in visual representations (as
diagrams, tables, or text) or vice versa, humans have
chosen to use these conventions, because they seem
more natural, and a variety of examples demonstrate
that specific semantic concepts are used
predominantly with specific orientations. For
instance, when looking at how temporal relations are
represented in every-day life it is interesting to note
that often top-to-bottom orientation is used (e.g.
calendars, school schedules, programs, public
transport schedules). In graphs, time is usually
expressed from left-to-right on the horizontal axis
(Tversky et al., 1991, p. 546).
5 PRACTICAL AND
NEUROPSYCHOLOGICAL
ASPECTS OF SPATIAL
ORIENTATIONS
To complete our discussion of different theoretical
perspectives, we now discuss factors that relate to
spatial orientations which go beyond cultural
conventions of direction in written language and
visual representations.
First, there are also purely practical reasons
accounting for why cultures have chosen specific
writing directions. To give an example, independent
of the horizontal or vertical as well as the left-right
or right-left organization, pictographic and
alphabetic writing systems are usually produced and
read from top-to-bottom, probably because “the
hand shouldn’t cover what has just been written”
(Tversky et al., 1991, p. 551).
Second, there also seem to be
neuropsychological causes for a general human
preference for left-to-right in the context of reading
and writing. Such preferences for left-to-right
orientation can be found in various incidents. For
instance most adults, but also children who have not
yet learned writing tend to draw pictures from left-
to-right (Hufschmidt, 1985). Such findings would
suggest that left-to-right preferences also have
inborn aspects and are not only acquired. One reason
behind the left-to-right preference could be the
association of language with the left cerebral
hemisphere which led to a “dominance of the left
field of vision” (Hufschmidt, 1985). Recent research
in the area of spatial processing for instance claims
that there exists a spatial asymmetry in visual short-
term memory. Sala et al. (2010) showed that people
remember objects in perception tasks better when
they were positioned on the left than on the right.
Attention seems to be focused on the left-hand side.
6 HYPOTHESES
Following from the theoretical discussion above, we
will now advance propositions regarding the
superiority of specific flow directions in regard to
process model understandability. One of the
essential arguments is that understanding a process
model will be easier if its flow direction matches
users’ expectations (Harsel and Wales, 1987, Krohn,
1983, Winn, 1982). Such expectations are formed by
the direction of written language and typical
conventions used in visual representations (Tversky
et al., 1991, Winn, 1983). Furthermore, humans
associate specific semantic concepts with spatial
orientations. In light of the above arguments, we
specifically expect that left-to-right flow direction in
a model is superior to other flow directions (top-to-
bottom, bottom-to-top, right-to-left) with respect to
process model comprehension. This is because it is
consistent with text reading direction, the association
between semantic concepts as “earlier-later” and
left-to-right (Handel et al., 1968) and a human
preference for left-to-right orientation (Hufschmidt,
1985).
OntheImportanceofFlowDirectioninBusinessProcessModels
135

7 CONCLUSION
This paper has presented a cumulative body of
knowledge relevant to flow direction in diagrams
and this integration of research streams denotes an
important extension to the scientific discussion on
layout choices for process models. From a
theoretical perspective, advising left-to-right flow
direction is beneficial. In this context, our position
paper serves as a contribution to existing process
model layout considerations and secondary notation
research in general. We already designed a
corresponding experiment and in our future work,
we will conduct this experiment to examine the
alleged superiority of the left-to-right flow direction
for process model comprehension.
REFERENCES
De Soto, C. B., London, M., Handel, S., 1965. Social
reasoning and spatial paralogic. Journal of Personality
and Social Psychology, 2, 513-521.
Dumas, M., Van Der Aalst, W. M. P., Ter Hofstede, A. H.
M. (eds.), 2005. Process Aware Information Systems:
Bridging People and Software Through Process
Technology, Hoboken, New Jersey: John Wiley &
Sons.
Effinger, P., Jogsch, N., Seiz, S., 2011. On a Study of
Layout Aesthetics for Business Process Models Using
BPMN. In: MENDLING, J., WEIDLICH, M. &
WESKE, M. (eds.) Business Process Modeling
Notation. Springer Berlin Heidelberg.
Eichelberger, H., Schmid, K., 2009. Guidelines on the
aesthetic quality of UML class diagrams. Information
and Software Technology, 51, 1686-1698.
Figl, K., Mendling, J., Strembeck, M., 2013a. The
Influence of Notational Deficiencies on Process Model
Comprehension. Journal of the Association for
Information Systems, 14.
Figl, K., Recker, J., Mendling, J., 2013b. A study on the
effects of routing symbol design on process model
comprehension. Decision Support Systems, 54, 1104-
1118.
Gillespie, C. S., 1993. Reading Graphic Displays: What
Teachers Should Know. Journal of Reading, 36, 350-
54.
Handel, S., Desoto, C. B., London, M., 1968. Reasoning
and spatial representations. Journal of Verbal
Learning and Verbal Behavior, 7, 351-357.
Harsel, Y., Wales, R., 1987. Directional preference in
problem solving. International Journal of Psychology,
22, 195-206.
Hufschmidt, H.-J., 1985. Zeichnungsrichtung,
Schreibrichtung und Blickfelddominanz. European
Archives of Psychiatry and Clinical Neuroscience,
235, 76-81.
Krohn, G. S., 1983. Flowcharts Used for Procedural
Instructions. Human Factors, 25, 573-581.
Mendling, J., Strembeck, M., Recker, J., 2012. Factors of
Process Model Comprehension - Findings from a
Series of Experiments. Decision Support Systems, 53,
195-206.
Nordbotten, J. C. & Crosby, M. E., 1999. The effect of
graphic style on data model interpretation. Information
Systems Journal, 9, 139-155.
Object Management Group, 2013a. Business Process
Model and Notation (BPMN) Version 2.0.2.
Object Management Group, 2013b. OMG Unified
Modeling Language (OMG UML). In: GROUP, T. O.
M. (ed.).
Petre, M. 1995. Why looking isn't always seeing:
readership skills and graphical programming.
Commun. ACM, 38, 33-44.
Petre, M., 2006. Cognitive dimensions 'beyond the
notation'. Journal of Visual Languages & Computing,
17, 292-301.
Reijers, H. A., Mendling, J., Dijkman, R. M., 2011.
Human and automatic modularizations of process
models to enhance their comprehension. Information
Systems, 36, 881–897.
Sala, S. D., Darling, S., Logie, R. H., 2010. Items on the
left are better remembered. The Quarterly Journal of
Experimental Psychology, 63, 848 - 855.
Schrepfer, M., Wolf, J., Mendling, J., Reijers, H. A., 2009.
The Impact of Secondary Notation on Process Model
Understanding. In: The Practice of Enterprise
Modeling, 2nd IFIP WG8.1 Working Conference
(PoEM 2009) Stockholm, Sweden.
Tversky, B., Kugelmass, S., Winter, A., 1991. Cross-
cultural and developmental trends in graphic
productions. Cognitive Psychology, 23, 515-557.
Weske, M., 2007. Business Process Management:
Concepts, Languages, Architectures, Springer-Verlag.
Winn, W., 1982. The role of diagrammatic representation
in learning sequences, identification and classification
as a function of verbal and spatial ability. Journal of
Research in Science Teaching, 19, 79-89.
Winn, W., 1983. Perceptual strategies used with flow
diagrams having normal and unanticipated formats.
Perceptual and Motor Skills, 57, 751-762.
ICSOFT-EA2014-9thInternationalConferenceonSoftwareEngineeringandApplications
136
