
Why Using the Alpha-stable Distribution in Neuroimage?
Diego Salas-Gonzalez
1
, Juan M. G´orriz
2
, Javier Ram´ırez
2
and Elmar W. Lang
1
1
Institut f¨ur Biophysik und physikalische Biochemie , University of Regensburg, Regensburg, Germany
2
Dpt. Signal Theory, Networking and Communications, University of Granada, Granada, Spain
Keywords:
α-stable Distribution, Biomedical Applications, Brain Image Processing.
Abstract:
The main goal and overall objective of this contribution is to attract the attention of the potentialities and wide
range of applications of the α-stable distribution in biomedical applications, specifically in neuroimaging. The
α-stable density is a heavy-tailed, non-symmetric distribution with similar desirable properties to the Gaussian.
Indeed, the Gaussian distribution is a particular case of the α-stable family. The Gaussian distribution is used
ubiquitously in brain image processing. For this reason, we believe that the α-stable density can be potentially
used as an alternative to the Gaussian distribution in several biomedical applications regarding brain imaging.
Some of the proposed applications of the α-stable distribution considered in this work are the development
of brain image processing approaches with applications to intensity normalization of SPECT images, MRI
segmentation and feature extraction for the diagnosis of Parkinsonian’s syndrome.
1 INTRODUCTION
Non-Gaussian statistical signal processing is impor-
tant when signals deviate from the ideal Gaussian
model. α-stable distributions are amongst the most
important non-Gaussian models. They share defining
characteristics with the Gaussian distribution, such as
the stability property and central limit theorem, and
include the Gaussian distribution as a limiting case.
Heavy-tailed modeling using the alpha-stable dis-
tribution has been successfully applied in many fields
of research. In engineering related methods: radar
processing, telecommunications, acoustics, network
modeling, queuing theory or ICA/blind source sep-
aration. In economics and finance: modeling asset re-
turns, option pricing and commodity price modelling.
In computer science, physics, astronomy, chemistry,
geology, geophysics and genetics.
The history of research on this particular distri-
bution family is old starting with the work of Paul
L´evy in 1925. The applications of alpha-stable dis-
tributions have been limited however until much later
when (Mandelbrot, 1963) suggested they could be
used to model financial time series data. There-
after, the alpha-stable distribution has been frequently
found in analysis of critical behaviour and financial
data (Voit, 2003).
The α-stable distribution in engineering gained
popularity and attracted the attention of engineers
worldwide after the work published by Shao in Pro-
ceedings of the IEEE (Shao and Nikias, 1993). Appli-
cations of the α-stable distribution in engineering are
still a productive field of research nowadays. Never-
theles, the α-stable distribution has been used just in
a few cases recently published in neuroimaging appli-
cations.
On contrast, the Gaussian distribution is used
ubiquitously in neuroimaging. For this reason, we be-
lieve alpha-stable density can be potentially used as
an alternative to the Gaussian distribution.
2 SOME PROPERTIES OF THE
α-STABLE DISTRIBUTION
The characteristic function ϕ(ω) of an α-stable distri-
bution f
α,β
(y|γ, δ) is given by:
ϕ(ω) =
(
e
−|γω|
α
[1−isign(ω)βtan(
πα
2
)]+iδω
, (α 6= 1)
e
−|γω|[1+isign(ω)
2
π
βlog(|ω|)]+iδω
, (α = 1)
(1)
where the parameters of the stable distribution are:
α ∈ (0, 2] is the characteristic exponent which sets
the level of impulsiveness, β ∈ [−1, +1] is the skew-
ness parameter, (β = 0, for symmetric distributions
and β = ±1 for the positive/negative stable family re-
spectively), γ > 0 is the scale parameter, also called
dispersion, and δ is the location parameter.
297
Salas-Gonzalez D., Górriz J., Ramírez J. and Lang E..
Why Using the Alpha-stable Distribution in Neuroimage?.
DOI: 10.5220/0005091102970301
In Proceedings of the 11th International Conference on Signal Processing and Multimedia Applications (SIGMAP-2014), pages 297-301
ISBN: 978-989-758-046-8
Copyright
c
2014 SCITEPRESS (Science and Technology Publications, Lda.)
−5 0 5
0
0.2
0.4
0.6
0.8
α = 1.5
α = 1.0
α = 0.5
−5 0 5
0
0.1
0.2
0.3
0.4
β = −1.0
β = 0.0
β = 1.0
−5 0 5
0
0.2
0.4
0.6
0.8
1
1.2
1.4
γ = 1.0
γ = 0.5
γ = 0.25
−5 0 5
0
0.05
0.1
0.15
0.2
0.25
0.3
0.35
δ = 0.0
δ = 1.0
δ = 2.0
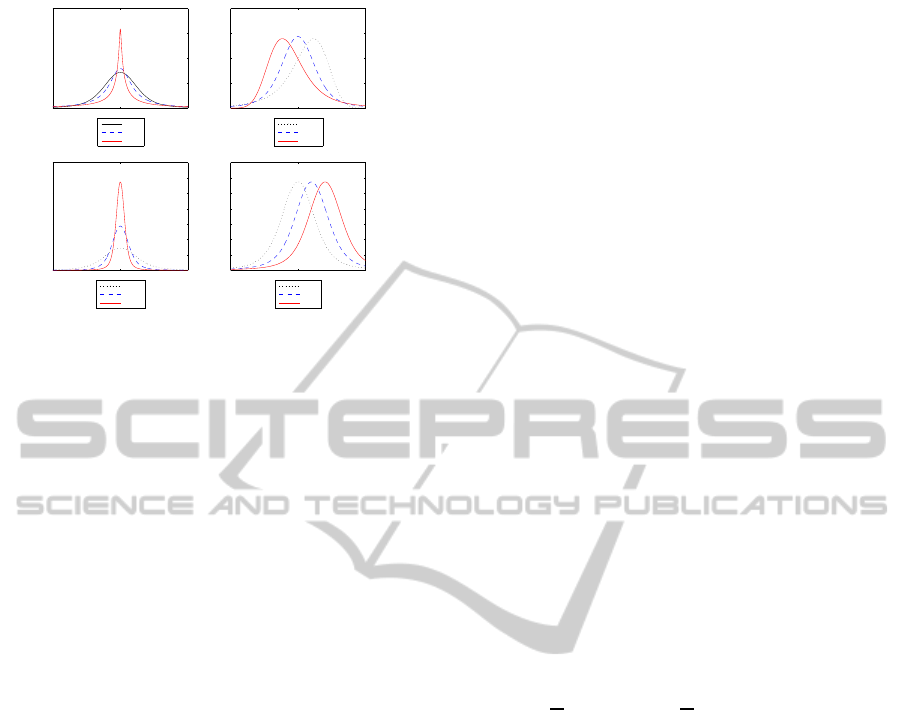
Figure 1: α-stable probability density function with refer-
ence parameters α = 1.5, β = 0, γ = 1 and δ = 0 with chang-
ing: (a) Characteristic exponent α. (b) Skewness parameter
β. (c) Dispersion γ. (d) Location parameter δ.
Figure 1 shows the α-stable probability density
function for different values of the parameters. We
use the distribution with parameters α = 1.5, β = 0,
γ = 1 and δ = 0 as reference. This figure also explain
the name of the parameters: α controls the degree of
impulsiveness. When α decreases, the degree of im-
pulsiveness increases. β controls the skewness and its
sign, if the asymmetry is on the left or the right. γ con-
trols the concentration of the samples along the bulk
of the distribution. Lower values of γ correspond with
higher concentration of the samples. Lastly, differ-
ent values of δ produce the same probability density
function but shifted in the x-axis.
3 α-STABLE DISTRIBUTION IN
NEUROIMAGE
3.1 Intensity Normalization of Brain
FP-CIT SPECT Images
Previous studies have demonstrated that when
[123I]FP-CIT SPECT reaches equilibrium binding in
the brain, a simple unitless ratio of regional radioac-
tivities is proportional to the binding potential (Scher-
fler et al., 2005; Aarts et al., 2012). Nevertheless, this
binding ratio leads to intersubject differences in the
histogram of intensity values. As the histogram of in-
tensity values is unimodal, skewed and heavy-tailed,
one can model this histogram using an alpha-stable
distribution in order to perform intensity normaliza-
tion of the brain images.
The histogram of intensity values in FP-CIT
SPECT images shares some of the properties of the
α-stable distribution. Some of these common proper-
ties are:
• Heavy probability tails due to the existence of a
few regions of the brain with high intensity values.
• Peaked bulk, because most of the voxels in the
brain, the non-specific area, have very similar in-
tensity values, except the striatum, which is the
area with greater variability depending on the type
of image (Parkinson’s syndrome (PD) or Normal
Control patients (NC)).
• Positive asymmetry, because intensity values are
always greater than 0 and the bulk of the distribu-
tion reaches lower intensity values compared with
the values obtained in the striatum.
The predicted α-stable parameters and the location-
scale property can be used to transform the intensity
values in each voxel linearly. This transformation en-
sures that the new histograms in each image have a
pre-specified α-stable distribution with desired loca-
tion and dispersion values.
These features have been exploited in (Salas-
Gonzalez et al., 2013b). The histogram of a vector
of intensity data with α-stable distribution f with pa-
rameters [α, β, γ, δ], denoted by X ∼ f
α,β
(y|γ, δ) can
be easily transformed to another α-stable distribution
with parameters Y ∼ f
α,β
(y|γ
∗
, δ
∗
) by using the fol-
lowing expression (Samoradnitsky and Taqqu, 1994):
Y = aX + b (2)
where a =
γ
∗
γ
and b = δ
∗
−
γ
∗
γ
δ.
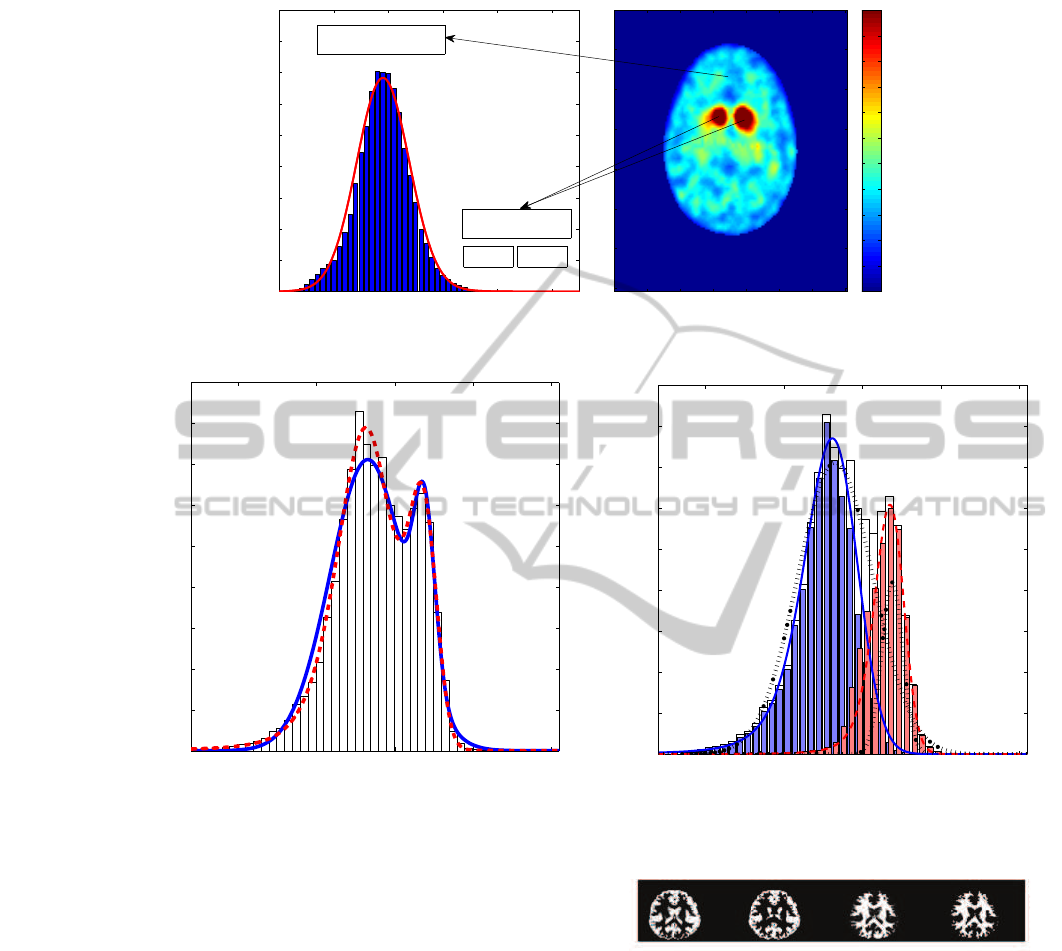
Figure 2 depicts the histogram of intensity val-
ues in FP-CIT SPECT brain images showing the spe-
cific and non-specific regions and their locations in a
transaxial slice.
3.2 Modelization of the Distribution of
Brain Matter
The principal goal of a segmentation process is to
partition an image into different regions which are
homogeneous with respect to one or more features.
Segmentation is an important tool in medical image
processing and has been useful in many applications.
In MRI, segmentation is performed to divide the en-
tire image into sub-regions such as white matter, gray
matter and cerebrospinal fluid spaces of the brain
(Balafar et al., 2010). The Gaussian mixture model
has been widely applied in brain MRI segmentation,
nevertheless, distribution of white and grey matter is
more similar to the α-stable distribution, As it has
been pointed out in (Salas-Gonzalez et al., 2013a).
Figures 3 and 4 show the histogram of intensity
values for a magnetic resonance brain image.
SIGMAP2014-InternationalConferenceonSignalProcessingandMultimediaApplications
298
0 10 20 30 40 50
0
2000
4000
6000
8000
10000
12000
14000
16000
18000
20 40 60 80 100 120 140
20
40
60
80
100
120
140
0
5
10
15
20
25
30
35
40
45
50
55
Nonspecific binding regions
Specific binding regions
PD NC
Figure 2: Continuous red line: predicted α-stable density.
50 100 150 200 250
0
0.002
0.004
0.006
0.008
0.01
0.012
0.014
0.016
0.018
Image1
Figure 3: Histogram of intensity values. Red dashed line:
predicted alpha-stable mixture density. Blue solid line:
Gaussian mixture model with two components.
• The individual histograms of white and grey mat-
ter have a shape which is similar to the α-stable
distribution.
• Even if in most cases the global histogram of in-
tensity values are unimodal, because their WM
and GM components are very mixed, the mixture
of α-stable model is robust enough to find the hid-
den components successfully.
• Many MRI segmentation procedures are based on
a preliminary modelling of the histogram of WM
and GM, using a Gaussian mixture model, we be-
lieve that the α-stable distribution is a good alter-
native due to its theoretical and practical proper-
ties.
• The α-stable mixture model allows us to calculate
the relative likelihood for each voxel in the image.
50 100 150 200 250
0
0.002
0.004
0.006
0.008
0.01
0.012
0.014
0.016
0.018
Image1
Figure 4: Red and blue lines: predicted alpha-stable com-
ponents. Dotted black line: Gaussian components. Solid
histogram: Ground truth (according to the Internet brain
segmentation repository IBSR- data).
Figure 5: Transaxial slices represented using a linear
grayscale map. First column: probability to belong to GM
(p
GM
). White voxels, p
GM
= 1. Black voxels, p
GM
= 0.
Second column: GM voxels according to the manual seg-
mentation procedure. Third column: p
WM
. White voxels,
p
WM
= 1. Black voxels, p
WM
= 0. Fourth column: WM
regions according to manual segmentation procedure.
These quantities are very useful and could be used
in more complex Bayesian segmentation models
in future works.
WhyUsingtheAlpha-stableDistributioninNeuroimage?
299

3.3 Feature Extraction for Parkinson’s
Disease Diagnosis
After intravenous injection, 123I-FP-CIT SPECT
binds to the dopamine transporters in the striatum. It
has been found that patients with Parkinson’s disease
exhibit a decreased uptake of the tracer (Bhidayasiri,
2006; Hauser and Grosset, 2012). An accurate di-
agnosis of Parkinson’s disease is important because
it enables us to monitor disease progression and the
therapeutic effects of the treatment. This motivates
the development of automated techniques for quan-
tification which neither depend on time consuming
operator-intensive work, nor expert skills in manu-
ally locating the regions of interest in the brain (Pa-
pathanasiou et al., 2006). We believe the α-stable
distribution and its properties can be used to develop
a computer aided diagnosis system as a decision-
making aid for Parkinson’s syndrome diagnosis for
automatic classification.
The discriminative area to perform diagnosis of
Parkinson’s syndrome in FP-CIT SPECT brain im-
ages is located in a specific region of the brain, the
striatum. According to the histogram of the intensity
values, this area also controls the degree of impulsive-
ness in the histogram. The degree of impulsiveness
is related to the characteristic exponent, which also
models the Paretian behaviour of the tails in alpha-
stable distributions. This property can be exploited
to assess differences between images belonging to
normal controls and patients with Parkinsonian syn-
drome, measuring the Paretian behaviour in the tail
of the distribution to extract the discriminant features.
Then, these features could be used for statistical clas-
sification using support vector machines or classifica-
tion trees.
4 NOVELTY, ADVANTAGES AND
DISADVANTAGES
The main advantage of the α-stable methods is that
they are generalizations of the Gaussian distribution
which is widely used in neuroimagingmethods, there-
fore they are expected to perform better than Gaus-
sian, or equally when the Gaussian assumption holds.
The main disadvantage of the α-stable distribution
is, mainly, the non existence of a closed form for
its probability density function, therefore, numerical
methods needs to be used to evaluate it.
The originality of the goals and methods envis-
aged in this paper is demonstrated by the fact that the
α-stable distribution has not been previously used in
neuroimaging apart from two very recent works pub-
lished in 2013 (Salas-Gonzalez et al., 2013a; Salas-
Gonzalez et al., 2013b). We believe is timely to ex-
tend these recently published methods, exploiting ad-
ditional and useful properties of the α-stable distri-
bution in the study of signal processing methods for
brain tomographic applications.
5 CONCLUSION
The Gaussian distribution and mixture of Gaussian
model are ubiquitous in brain imaging literature; nev-
ertheless, the Gaussian distribution, and the mixture
of Gaussians are particular limiting cases of the alpha-
stable distribution, and the mixture of alpha-stable
model. Sometimes, brain-imaging data present a cer-
tain degree of asymmetry and/or impulsiveness and
therefore, it can be modelled more accurately using
alpha-stables. For this reason, the alpha-stable dis-
tribution is expected to work better than those ap-
proaches in the literature assuming Gaussian distri-
bution of the data.
REFERENCES
Aarts, E., Helmich, R. C., Janssen, M. J., Oyen, W. J.,
Bloem, B. R., and Cools, R. (2012). Aberrant re-
ward processing in Parkinsons disease is associated
with dopamine cell loss. Neuroimage, 59(4):3339–
3346.
Balafar, M., Ramli, A., Saripan, M., and Mashohor, S.
(2010). Review of brain MRI image segmentation
methods. Artificial Intelligence Review, 33(3):261–
274.
Bhidayasiri, R. (2006). How useful is (123i) beta-CIT
SPECT in the diagnosis of Parkinson’s disease? Re-
views in Neurological Diseases, 3(1):19–22.
Hauser, R. A. and Grosset, D. G. (2012). [123I]FP-CIT
(DaTSCAN) SPECT brain imaging in patients with
suspected Parkinsonian syndromes. Journal of Neu-
roimaging, 22(3):225–230.
Mandelbrot, B. (1963). Summary of variation of certain
speculative prices. Journal of Business, pages 394–
419.
Papathanasiou, N., Rondogianni, P., Chroni, P., Themis-
tocleous, M., Boviatsis, E., Pedeli, X., Sakas, D.,
and Datseris, I. (2006). Interobserver variability,
and visual and quantitative parameters of 123I-FP-
CIT SPECT (DaTSCAN) studies. Annals of Nuclear
Medicine, 26(3):234–240.
Salas-Gonzalez, D., G´orriz, J., Ram´ırez, J., Schloegl, M.,
Lang, E., and Ortiz, A. (2013a). Parameterization of
the distribution of white and grey matter in MRI using
the α-stable distribution. Computers in Biology and
Medicine, 43(5):559–567.
SIGMAP2014-InternationalConferenceonSignalProcessingandMultimediaApplications
300

Salas-Gonzalez, D., G´orriz, J., Ramrez, J., Ill´an, I., and
Lang, E. (2013b). Linear intensity normalization of
FP-CIT SPECT brain images using the α-stable dis-
tribution. Neuroimage, 65:449–455.
Samoradnitsky, G. and Taqqu, M. S. (1994). Stable Non-
Gaussian Random Processes: Stochastic Models with
Infinite Variance. Chapman and Hall/CRC.
Scherfler, C., Seppi, K., Donnemiller, E., Goebel, G., Bren-
neis, C., Virgolini, I., Wenning, G. K., and Poewe,
W. (2005). Voxel-wise analysis of [123I]beta-CIT
SPECT differentiates the Parkinson variant of multi-
ple system atrophy from idiopathic Parkinson’s dis-
ease. Brain, 128(7):1605–1612.
Shao, M. and Nikias, C. L. (1993). Signal processing
with fractional lower order moments: stable processes
and their applications. Proceedings of the IEEE,
81(7):986–1010.
Voit, J. (2003). The Statistical Mechanics of Financial Mar-
kets. Texts and Monographs in Physics. Springer-
Verlag.
WhyUsingtheAlpha-stableDistributioninNeuroimage?
301
