
Analyzes of Influencing Factors to the Sensorimotor Training
Technical Support Systems in the Physiotherapy
Angelina Thiers
1
, Annett l’Orteye
2
, Katja Orlowski
1
, Kerstin Schrader
3
and Thomas Schrader
1
1
Brandenburg University of Applied Sciences, Department of Informatics and Media, Brandenburg an der Havel, Germany
2
St
¨
adtisches Klinikum Brandenburg GmbH Akademisches Lehrkrankenhaus der Charit
´
e, Abteilung Medizinische Schule,
Brandenburg, Germany
3
SAfP Spektrum Akademie f
¨
ur Physiotherapie, Berlin, Germany
Keywords:
Sensorimotor Training, EMG Data, Technical Support Systems.
Abstract:
The popularity of the sensorimotor training is still growing. Nonetheless, the training is not yet fully inves-
tigated. Information given by the manufacturers, in the literature and the experience of physiotherapists will
form the basis of physiotherapeutic interventions. For an integration of evidence based decision making a
change in the approach of the therapy planning is needed. This can be achieved by the use of technical support
systems. Therefore, the behavior of 32 test persons was investigated. Within two different setups several in-
vestigation scopes were analyzed. One scope was the influence of the laterality to the muscular activity during
the training on the exerciser. Furthermore, the effects of the different equipment with regard to the information
of the literature and the manufacturers were analyzed. Additionally, a detailed investigation of the muscular
activity during the realization of tasks given by the physiotherapist was made. Also, a survey regarding the
muscular strain during the training as well as the acceptance of the sensors was fulfilled. Finally, factors which
have an influence on the progress of the training were identified and analyzed. The benefit and the necessity
of technical support systems in the sensorimotor training was shown.
1 INTRODUCTION
Across the health care professions the use of evidence
is extensively promoted. The physical therapy pro-
fession goes along with this progress. One aim of the
American Physical Therapy Association is that up to
the year 2020 physiotherapists will use evidence in
practice (Jewell, 2010).
The necessity of evidence is caused by a couple
of reasons. On the one hand, there are many different
ways to achieve an improvement within a special dis-
ease pattern. This variety of treatment options leads
to a critical consideration of the therapy by the thera-
pist and by the patient. Consequently, a detailed doc-
umentation of the therapy is needed. This documen-
tation should contain essential information to provide
evidence. This requirement can be achieved by the
usage of technical support systems (Jewell, 2010; von
Eisenhart-Rothe et al., 2007).
One therapy method, which is often used for pre-
vention purposes, therapy, rehabilitation as well as
for the improvement of the athletic performance is
the sensorimotor training. Its huge popularity en-
sures that there is a great variety of equipment, which
should support and improve the training. Despite its
popularity, the training itself is not completely inves-
tigated until now (R
¨
uhl and Laubach, 2012).
Actually, the therapy planing is based on the fol-
lowing facts: the experience of the physiotherapist,
the information given in the literature, the productin-
formation given by the manufacturers as well as on
the possibilities in the physiotherapy practices. De-
pending on the information given by the manufac-
turer, the therapist is planing the usage of the equip-
ment in the training. For example, the Balance Board
should strengthen the musculature of the buttocks,
the legs, the back and the abdomen (Sport-Thieme,
2012). Furthermore the literature documents addi-
tional effects. The first one is the improvement of the
inter- and intramuscular coordination of the muscles
of the feet and the legs. The second effect, staying
with both feed on the Balance Board, is the enhance-
ment of the stabilization in the region of the lumbar
spine, the pelvis and the hip. Additionally, the opti-
mization of the inter- and intramuscular coordination
of muscles of the lumbar spine, the thoracic spine and
45
Thiers A., l’Orteye A., Orlowski K., Schrader K. and Schrader T..
Analyzes of Influencing Factors to the Sensorimotor Training - Technical Support Systems in the Physiotherapy.
DOI: 10.5220/0005093000450052
In Proceedings of the 2nd International Congress on Sports Sciences Research and Technology Support (icSPORTS-2014), pages 45-52
ISBN: 978-989-758-057-4
Copyright
c
2014 SCITEPRESS (Science and Technology Publications, Lda.)

the cervical spine should also be a benefit (Bertram
and Laube, 2008).
For the usage of evidence a more detailed look at
the sensorimotor training is needed. The aim of the
current study was to identify and analyze all kinds of
factors which have an influence on the progress of the
therapy. Therefore, the behavior patterns of 32 test
persons were investigated during their training on the
exercisers. Finally, the necessity and the benefit of
using supporting systems in the sensorimotor training
should be shown.
2 MATERIAL & METHODS
2.1 Measurements
The usage of Shimmer
TM
measuring units is one ap-
proach for a noninvasive patient monitoring. Next
to the mentioned feature of monitoring, the sensors
assist diagnostics with their given functions. One
of their benefits is the small form factor of the sen-
sor. Additionally, the characteristic of wireless com-
munication is a further advantage of the measure-
ment units. The Bluetooth technology enables data to
stream online and in real-time. All used sensors were
a combination of a baseboard and a special daughter-
board. For the current investigation the electromyo-
gram (EMG) as well as the gyroscope daughterboards
were used (Shimmer Research, 2011).
The EMG daughterboard allows the user to mea-
sure one channel of the electrical activity of a mus-
cle. Furthermore the sensor also provides a pre-
amplification of the EMG signal. Hence, the non-
invasive method visualizes the whole activity of a
muscle (Shimmer Research Support, 2012).
The gyroscope daughterboard consists of a single
and a dual axis angular rate gyroscope and is able to
measure three axis of angular velocity (Kuris, 2010).
2.2 Exercisers
Within the experimental setups the behavior of the test
persons on three different exercisers was investigated.
The first one is the Balance Board. The last two exer-
cisers were two types of a special Rocker Board. The
only difference is the direction of the deflection of the
Rocker Board.
2.2.1 Balance Board
The Balance Board is characterized by its multidi-
mensional instability, figure 1. The exerciser offers
different fields of application. The Balance Board
supports the strengthening of the musculature of the
buttocks, the legs, the back as well as the abdomen
(Sport-Thieme, 2012). The dimensions of the Bal-
ance Board are given in table 1.
2.2.2 Rocker Board
One feature of the Rocker Board is its one-
dimensional instability, figure 1. The board can be
used in two different ways. It offers either a forward-
backward or a left-right instability. The Rocker Board
is made to train the coordination, the stamina, the
strength as well as the motor skills (Bad-Company,
2013).
In case of the left-right deflection it requires spe-
cial movement patterns performed by the extension
and the flexion of the knee joints. In contrast, the
forward-backward deflection demands the reaction of
the ankle joints.
Figure 1: Balance and Rocker Board.
Table 1: Dimensions of the Exercisers.
Balance Board Rocker Board
Height 9.0 cm 7.5 cm
Dimension 41.5 cm 45.0 cm
Deflection ∼ 18
◦
∼ 16
◦
Material Plastic Wood
Surface smooth smooth and firm
2.3 Experimental Setups
The investigation obtains its data from two different
experimental setups. The data from the first setup
originates from a previous study (Thiers et al., 2014).
The collected data prove the assumption that the train-
ing on an exerciser with a multidimensional instabil-
ity causes a higher muscular activity than the train-
ing on an exerciser with an one-dimensional instabil-
ity (Grifka and Dullien, 2008). The second setup was
developed to have a closer look at the sensorimotor
training. Additionally, the effects of the interventions
given by the physiotherapist were analyzed.
To develop an user-oriented experimental setup
the design of both studies was made in coopera-
tion with experienced physiotherapists of a medical
school. One requirement of the physiotherapists was
the transferability of the setups into a training, which
can also be performed by patients. Hence, this causes
the drop out of the maximum voluntary contraction
icSPORTS2014-InternationalCongressonSportSciencesResearchandTechnologySupport
46

measurement. Alternatively, the normalization of the
data was made by a reference measurement in front of
the exerciser.
2.3.1 Setup 1
The first setup includes the data of 13 test persons.
All of them were young and healthy students. For
participating in the study all test persons have to gave
their written consent.
The first setup comprised of three different parts.
The first one was the test of the laterality of each
proband. The second part contains measurements on
the three exercisers. Finally, a survey regarding the
acceptance of the sensors was made.
The investigations of the laterality were made by
multiple tests. At the beginning six tests for the deter-
mination of the handedness were made. For instance,
the hand which opens a bottle was identified. For the
investigation of the dominance of the feet, ten differ-
ent tests were made. For example, the establishment
of the takeoff leg and shooting foot. Finally, a scales
test was made. For this reason the test person has to
stand with each leg on one scale. The distribution of
the bodyweight on the two scales was documented.
For the second part of the setup two different types
of Shimmer
TM
measurement units were used. A pair
of gyroscope sensors were centrally placed on the dif-
ferent exercisers. On the one hand this placement
enables to synchronize all recorded data and on the
other hand the intensity of deflection of the exercis-
ers was documented. For the verification of the as-
sumption that a higher muscular activity is achieved
when using exercisers with a multidimensional insta-
bility compared to the training with exercisers with
an one-dimensional instability (Grifka and Dullien,
2008), the EMG data of four pairs of muscles were
recorded. The voltage values of the M. tibialis ante-
rior, the M. soleus, the M. vastus lateralis as well as
the values of the M. biceps femoris of both body sides
were measured. The skin preparation and the place-
ment of the electrodes followed the recommendations
of the SENIAM project (SENIAM project, 2012).
The test persons had to perform the test sequence
for each of the three exercisers. One iteration of the
test sequence comprised a reference measurement in
front of the exerciser with a duration of 15 s as well as
a measurement on the equipment. This part of the pro-
cedure consists of four consecutive phases of chang-
ing difficulty, table 2. All phases have in common,
that they were characterized by symmetrical require-
ments to both body sides. All recordings have been
done without shoes. The subjects stand on both legs
for the whole time. In addition, the instructions and
the supervision of the correct execution were made by
an experienced physiotherapist.
The last part of the setup was a survey regarding
the subjective impressions of the training and the ac-
ceptance of the sensors. The questions regarding the
subjective impressions comprised the content of the
degree of the felt strain in general and in special body
areas. Additionally, the supervisor documents her im-
pressions, too. The following topics were addressed
by the questions of the sensor acceptance (examples):
if wearing the sensors caused restrictions during the
execution, if wearing the measurement units induced
an unpleasant feeling, if the test persons would use
the technology again as well as the usefulness and ap-
plicability of the sensors in everyday life. The options
for the answers were the choice of yes/ no as well as
free text.
Table 2: Setup 1 - Test procedure.
Phase Task Duration
1 Eyes open 30 s
2 Eyes closed 30 s
3 Throwing a medicine ball 60 s
4 Eyes open 30 s
2.3.2 Setup 2
19 healthy and young students took part in the second
setup. The participants were not the same than in the
first trial.
The second setup also consisted of three different
parts. These parts were executed subsequently: deter-
mination of the laterality, measurement on only one
exerciser and the survey regarding the acceptance of
the sensors. The first and the last part were identical
to the first setup.
On the contrary, the second setup only investi-
gated the behavior of the test persons on one exer-
ciser, the forward-backward Rocker Board. The test
sequence was composed of a reference measurement
in front of the exerciser and a measurement on the
exerciser. The overall duration of the training on the
Rocker Board was eight minutes, table 3. The first
phase had a duration of 60 s and during that phase
the test person should get familiar with equipment.
The second and the third phase were characterized
by the intervention of the physiotherapist. She re-
quested the subject to either focus on the right or left
body side. Immediately after that, their was again a
phase without any intervention. The aim of the fifth
phase was an individual intervention by the physio-
therapist. She gave different instructions regarding
the stance and the posture as well as the performance.
AnalyzesofInfluencingFactorstotheSensorimotorTraining-TechnicalSupportSystemsinthePhysiotherapy
47

The final phase should document, if the subjects have
adopted the behavior of the previous phase or not. For
a detailed investigation the deflection of the Rocker
Board and the muscular activity were recorded. The
EMG values were derived from both sides of the M.
peroneus longus, the M. tibialis anterior and the M.
vastus lateralis. Again, the skin preparation and the
placement of the electrodes followed the recommen-
dations of the SENIAM project (SENIAM project,
2012). The measurements of both setups had also in
common, that the test persons had to stand the whole
time without shoes on both feet. The study was su-
pervised by an experienced physiotherapist.
Table 3: Setup 2 - Test procedure.
Phase Task Duration
1 Without Intervention 60 s
2 Right Intervention 30 s
3 Left Intervention 30 s
4 Without Intervention 120 s
5 Physiotherapists Intervention 120 s
6 Without Intervention 120 s
2.4 Data Analyzes
Before starting the signal processing, the data sets
were synchronized. The first step of signal process-
ing was the application of a notch filter to EMG data
with a blocking frequency of 50 Hz. Secondly a fir
band-pass filter was applied to the data (Merletti and
Parker, 2004). Afterwards, the normalization of the
EMG data took place. Therefore the average muscu-
lar activity when staying in front of the exerciser was
calculated and used as normalization value. Subse-
quently, the absolute values of the measurement on
the exercisers were transformed into relative values
by using the normalization value. Finally, all EMG
values were presented as a percentage value of the
stance.
The next step regarding the EMG processing im-
plies the full-wave rectification of the EMG data
(Merletti and Parker, 2004). For the evaluation of
the muscular activity in the time domain different sta-
tistical parameters were calculated. For instance the
maximum and mean values for the whole signal over
a time window of 512 ms (Gu et al., 2010). These sta-
tistical parameters were evaluated within further cal-
culations. Namely, on the one hand the course of the
maximum values over time was documented. On the
other hand the mean value of the maximum voltage
values for each phase as well as for the complete pro-
cedure were calculated. Besides that, the accumulated
EMG activity (iEMG) was analyzed. Therefore, the
EMG was integrated over time. Consequently, the to-
tal accumulated activity was computed by the calcula-
tion of the area under the EMG for a chosen time pe-
riod (Robertson and Caldwell, 2004; Medved, 2000).
This calculation was performed for each phase as well
as for the complete test procedure. For a more de-
tailed investigation, the course of the iEMG over the
time was calculated and plotted.
3 RESULTS
3.1 Setup 1
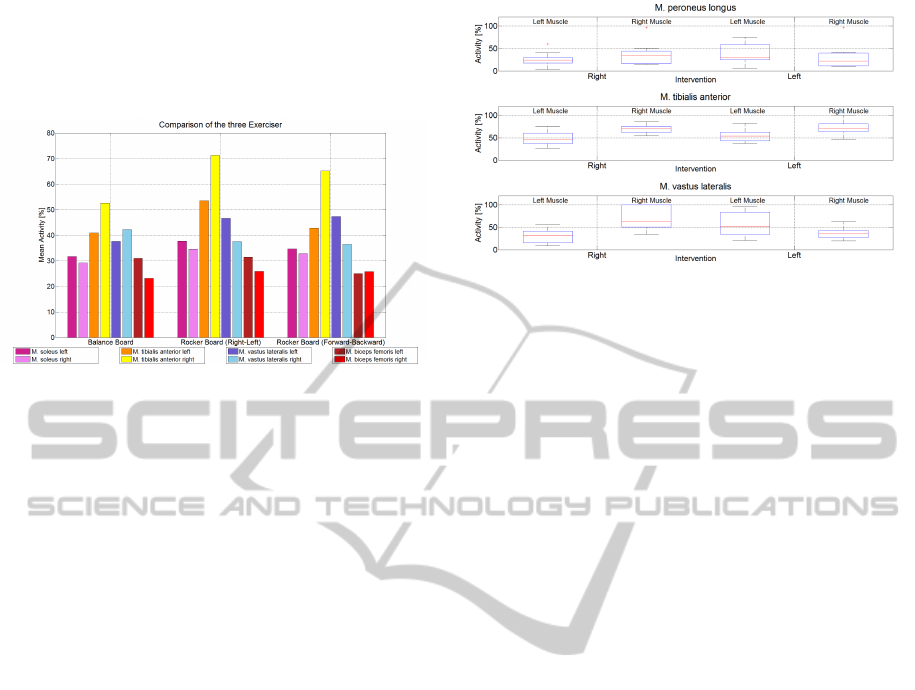
Figure 2 provides an overview of the overall muscular
activity of all test persons during the complete test
procedure on each exerciser.
The complete accumulated EMG activity during
the individual test sequences of each test person were
computed. The data were normalized for each sub-
ject. Therefore, the muscle with the highest strain
during all trials of each person was identified. This
muscles represents 100 %. The values of the remain-
ing muscles of the different trials were presented in
relation to the 100 %. This data was collected for all
of the 13 subjects. Finally, the whole data was aver-
aged and visualized in figure 2.
The investigation of the EMG data had revealed,
that it is useful to distinguish between the process of
the compensation of the instability caused by the ex-
erciser and the process of the maintenance of the body
stability. The first part is mainly realized by the mus-
culature of the lower legs. However, the maintenance
of the body balance is linked to the stability of the
knee joints. Due to that, the musculature of the thigh
has to produce the major part of the performance. Ac-
cordingly, the patterns of the M. biceps femoris and
the M. vastus lateralis show for all of the three exer-
cisers a similar intensity.
On the basis of this approach, the evaluation of
the musculature of the M. tibialis anterior and the
M. soleus shows individual results for the equip-
ment. The instability caused by the different Boards
is mainly compensated by the ankle sprains. Conse-
quently, a higher intensity of the instability induces a
higher muscular activity. One assumption in the lit-
erature is, that an exerciser with a multidimensional
instability requires a higher muscles strain in compar-
ison to an exerciser with an one-dimensional insta-
bility (Grifka and Dullien, 2008). This assumption
can not be validated by the measured EMG activity in
this study. Both types of the one-dimensional Rocker
icSPORTS2014-InternationalCongressonSportSciencesResearchandTechnologySupport
48
Board have produced a higher strain in the muscula-
ture of the lower legs. Consequently, in this case the
Rocker Board has a comparatively higher degree of
difficulty.
Figure 2: Comparison: Exerciser.
3.2 Setup 2
3.2.1 Intervention: Right/ Left
One type of intervention is to advise the patient to fo-
cus on one special body side. During the second phase
the physiotherapist instructed the subjects to focus on
their right body side. Immediately afterwards, in the
third phase the task was to burden especially the mus-
culature of the left body side.
The accumulated EMG activity was computed for
the duration of both phases separately. The data were
normalized. The muscle with the highest strain rep-
resents the 100 %. The remaining muscles were set
in relation to the 100 %. The data of all test persons
of setup two were collected and summarized in the
boxplots of figure 3.
The upper graphic of figure 3 shows the interven-
tion data for the M. peroneus longus. The visualiza-
tion figures out, that the realization of the right inter-
vention is made in a more correct way. Accordingly,
the range of the boxplots is smaller during the right
intervention. Notwithstanding the left muscle is more
active during the left phase. In contrast, the results
of the M. tibialis anterior show a different outcome.
During both phases the right muscle is the more ac-
tive one. Nonetheless, the median of the left mus-
cle raises during the phase of the left intervention. In
contrast, the right one is nearly the same. The most
successful realization of the requirement to focus on
one body side was documented for the M. vastus lat-
eralis, lower graphic in figure 3. The measured ac-
tivity during each phase corresponds to the expected
ratio of the body sides. There is a clear difference of
the amount of activation of the left and right muscles
during the individual phases.
Figure 3: Intervention Right-Left.
3.2.2 Intervention: Physiotherapist
The fifth phase of the measurement on the Rocker
Board comprised the intervention of the physiother-
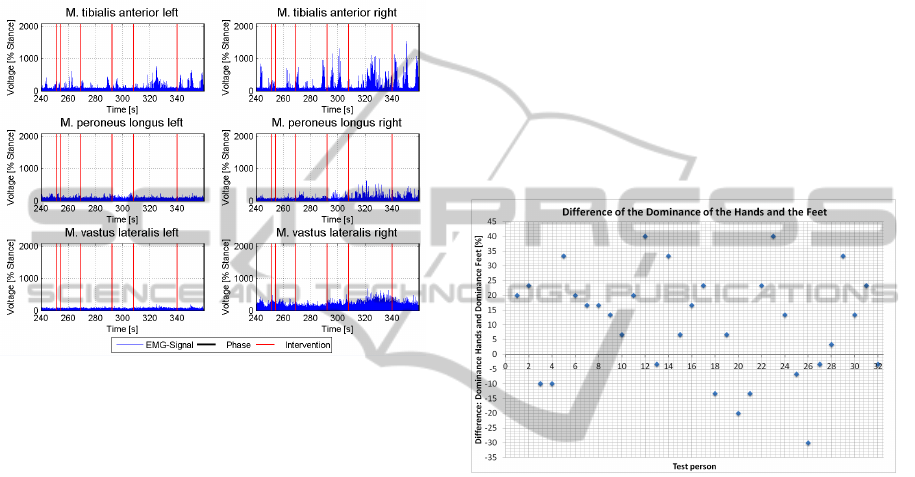
apist. Figure 4 represents the muscular activity of one
test person during this phase.
The physiotherapist analyzed the behavior of the
test person on the exerciser and gave immediate in-
structions for a better behavior. The current figure
documents six instructions, red lines in figure 4. The
first and the second intervention addressed the posi-
tion of the pelvis. The physiotherapist advised the
test person to rotate the left part of the pelvis into the
front. The expected reaction in the muscular activity
was an increase in the intensity of the EMG values
of the left body side. Except the M. tibialis anterior,
there were no changes in the EMG values of the left
body side recorded. Especially after the repetition of
the instruction, the left M. tibialis anterior increased
its activity. The same effects were documented for
the right side of the muscle. Within the third inter-
vention the order was to lean the torso to the right.
Again, the physiotherapists expects more activity in
the EMG values of the right body side. Both mus-
cles of the lower leg showed a slight activation. In
contrast, the activity of the right M. vastus lateralis
stayed the same. Again, the documented EMG values
only meet in a limited way the exceptions of the phys-
iotherapist. The instruction to improve the flexion of
the knee joints was given during the fourth interven-
tion. The realization of this task could only be occu-
pied by the increased activity of the right M. vastus
lateralis and the right M. tibialis anterior. Both mus-
cles had fulfilled the expectations. In contrast, this
result was not achieved by the left side. The physio-
therapist addressed this instruction again for the left
knee joint during the fifth intervention. Only the left
M. tibialis anterior showed higher voltage values. The
participation of the left M. vastus lateralis is needed
for a correct flexion of the knee joint. Unexpectedly,
the right muscle side produced higher values. In con-
AnalyzesofInfluencingFactorstotheSensorimotorTraining-TechnicalSupportSystemsinthePhysiotherapy
49
trast to the previous interventions, the last one was an
improvement of the performance. The physiothera-
pist advised the test person to burden both body sides
equally. The expectation was the compensation of the
muscular activity. Although, the left M. tibialis an-
terior produced higher voltage values, the right body
side was still the more dominant one. Referring to the
EMG values, the test person was not able to fulfill the
requirement completely.
Figure 4: Intervention Physiotherapist.
3.3 All Subjects
3.3.1 Laterality
To determine whether there is a correlation between
the laterality and the dominance of one body side in
the muscular activity or not, different tests for the
identification of the laterality were made.
The six tests for the handedness and the ten test
for the dominance of the feet were analyzed sepa-
rately. The first step comprised of the counting of
the frequency, how often one body side was used
within the test. The next step included the conversa-
tion of the frequency values from absolute values into
percentage-values. Immediately afterwards, it was
determined which body side was the dominant one.
Within the actual investigation the concrete body side
only plays a minor role. Only the percentage values
of the dominant side of the hands and the feet were of
interest. The difference between the two values was
calculated. The results were visualized for each of
the 32 (setup 1 and setup 2) test persons in the illus-
tration of figure 5. The benefit of this calculation is
to develop assumptions regarding the relationship of
the dominance of the hands and the dominance of the
feet.
A detailed look at the concrete dominance values
shows that only five out of 32 subjects achieved 100 %
while determining the intensity of the dominance of
one hand. In contrast, no test person achieved 100 %
regarding the dominance of one feet. This observa-
tion is supported by figure 5. Only 31.25% of the test
persons have a more dominant body side regarding
the feet than the hands (Test persons achieve a nega-
tive difference value). Additionally, it is obvious that
there is a great variance in the plotted values. Hence,
the intensity of the dominance of the feet is not di-
rectly linked to the intensity of the dominance of the
hands. Furthermore, it is not possible to make general
assumptions on how large the deviation of these two
values might be for an individual subject.
The overall analyzes of the laterality data figures
out, that by the majority of people the handedness
tend to be more pronounced than the dominance of
the lower extremities.
Figure 5: Laterality.
3.3.2 Subjective Impressions
All test persons had to comment the intensity of strain
which they felt during the training. They had to
choose between zero (nothing) and ten (very much
exhausting). Depending on her point of view the su-
pervisor also had to rate each training and had to doc-
ument the level of strain for each test person indepen-
dently. To evaluate if there is a correlation between
the subjective impressions of the test persons and the
impressions of the physiotherapist both ratings were
paired and were plotted dependency on each other in
graphic 6.
The investigation of the correlation revealed a co-
variance greater than two. Consequently, a positive
correlation between the ranking of the test person and
the ranking of the physiotherapist exists. The major
outcome of figure 6 is, that there is rarely an accor-
dance regarding the impressions of the physiothera-
pist and the impressions of the test persons. Only in
9.7 % of the training sessions an agreement was doc-
umented. In contrast, in 25.8 % of the sessions the
icSPORTS2014-InternationalCongressonSportSciencesResearchandTechnologySupport
50
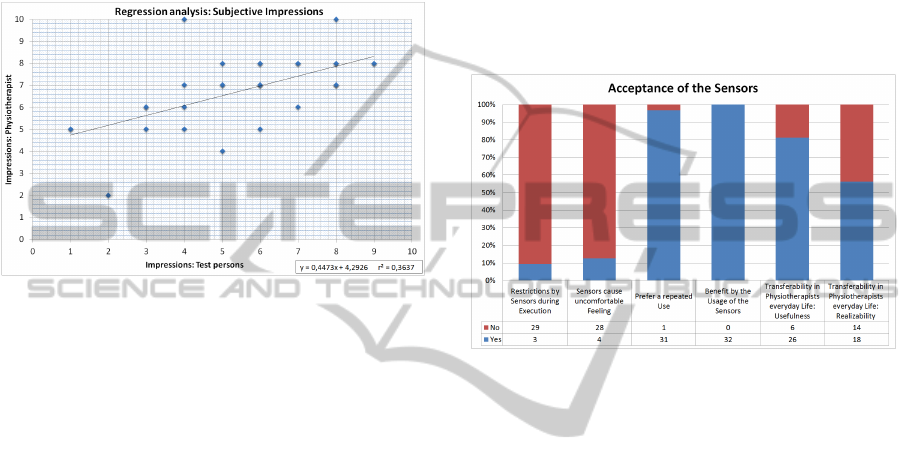
test persons thought the training was more exhaust-
ing than the physiotherapist documented. In 64.5 %
of the cases the test persons ranking of the strain was
lower than the ranking of the strain of the experienced
physiotherapist. Figure 6 visualizes the partially great
differences in the ranking of the intensity of the strain
during the trails. In one case, the physiotherapists im-
pression was a ranking of ten. In contrast, the test
person only documents a ranking of four.
Figure 6: Subjective Impressions.
3.3.3 Acceptance
In addition to the survey of the intensity of the strain,
the test persons had to answer a questionnaire regard-
ing the acceptance of the measurement units. The re-
sults of this survey where documented in figure 7.
The first question discusses, if there are any re-
strictions during the execution of the trail when wear-
ing the sensors. Three out of 29 test persons docu-
mented a restriction. The problem was the fixing of
the sensors. To avoid a drop of the sensors, they were
fixed with tape. In some cases the tape was too tight.
A similar result was achieved by the question, if
the sensors caused an uncomfortable feeling. The
tight fixation was a problem. Furthermore, the place-
ment of the sensors at the M. vastus lateralis and the
M. biceps femoris in setup one was slightly difficult.
For some test persons it caused some problems to sit
on a chair during the pauses in a comfortable way.
Only one out of 32 test persons would not use the
measurement units again. Unfortunately, the person
does not document a reason for this decision. One
explanation for the fact, that nearly all persons agree
to the question, might be, that they see the benefit of
the sensors.
100 % of the test persons have answered the ques-
tion, if they see a benefit in the usage of the sensors,
with yes. Additionally, there was the possibility to
give a more detailed answer. Most of them recog-
nized the benefit in the fields of documentation of the
training and the opportunity to have a detailed
look at the behavior of the muscles.
One question addressed the usefulness of the
transferability of the technology into physiotherapists
everyday life. More than 80 % gave a positive feed-
back. A few test persons mentioned that it would be
more useful for training and rehabilitation of patients,
who were competitive athletes.
The greatest deficit of the current technology is
that the application of the sensors took so much time.
Therefore, the transfer of the technology into every-
day life is difficult.
Figure 7: Acceptance of the Sensors.
4 DISCUSSION
The current study reveals different findings. The first
setup points out, that each Board requires different
skills of the test persons. Additionally, the assump-
tion of the literature, that exerciser with a multidimen-
sional instability cause a higher muscle strain than the
one with an one-dimensional instability (Grifka and
Dullien, 2008), could not be proven. Furthermore the
distribution of the muscle activity of the individual
muscles of the lower extremities figures out, that the
body stability is maintained by the musculature of the
upper legs. In contrast, the muscles of the lower legs
try to compensate the instability caused by the exer-
ciser.
This finding is also supported by the outcome of
the investigation of the muscle behavior when the test
persons were asked to focus on a special body side.
The analyzes shows the clearest realization within the
EMG values of the M. vastus lateralis. This is associ-
ated to the procedure, that in most cases the test per-
sons move their body’s center. The M. vastus lateralis
is one of the muscles, which participates especially in
the maintenance of the body stability. Consequently,
the shift of the body’s center has effects to the mus-
cular activity. The muscles of the lower legs mainly
AnalyzesofInfluencingFactorstotheSensorimotorTraining-TechnicalSupportSystemsinthePhysiotherapy
51

participate in the process of the compensation of the
instability of the exerciser. The task to focus to one
body side is subordinated.
The detailed exemplary investigation of the phys-
iotherapist reveals, that the subjects were able to un-
derstand instructions. However, sometimes their way
to fulfill the tasks differs from the expectations of the
physiotherapist. Unfortunately, it is not always pos-
sible to identify these differences without any tech-
nical support. An additional argument for the usage
of technical support systems is given by the varying
ratings regarding the difficulty of the exercises.
The last major finding of the investigation is the
acceptance of the sensors. Although a few improve-
ments of the technical arrangement should be made,
the test persons were open-minded and would use the
sensors again.
5 CONCLUSION
The investigation of the different questions regarding
the sensorimotor training figures out, that technical
support systems are a good opportunity to improve
the quality of the training. It is not possible to make
general assumptions regarding the effects of the indi-
vidual exerciser. Each patient has its own character-
istics and procedures to handle the given challenges.
Therefore, it is necessary to analyze each test per-
son, depending on his behavior, one exerciser could
be chosen.
Next, the laterality of the test persons should be
analyzed. The dominance of one body side is de-
pending on the socialization and on other factors like
sports. If the subject prefers bilaterally sports the
dominance will be less significant or its behavior is
correlating with situations which were typical for the
sport. This laterality influences the behavior on the
exerciser in general and the realization of special tasks
given by he physiotherapists. Unfortunately, it is not
always possible to give an objective evaluation of the
quality of the execution of the patient. Aggravating
this situation, the impressions of the patients does
not always correlate with the physiotherapists impres-
sions or the measured muscle activity.
To sum up, there are many factors which influence
the quality of the sensorimotor training. To improve
the efficiency and to objectively document the effec-
tiveness of the training the usage of technical support
systems would be a benefit.
REFERENCES
Bad-Company (2013). Deluxe balance board set 45cm aus
holz in studio-qualit
¨
at. Website. Available online
at http://www.webcitation.org/6Fg4kjCXJ ; visited on
April 6th 2013.
Bertram, A. M. and Laube, W. (2008). Sensomotorische Ko-
ordination: Gleichgewichtstraining auf dem Kreisel.
Thieme.
Grifka, J. and Dullien, S. (2008). Knie und Sport:
Empfehlungen von Sportarten aus orthop
¨
adischer
und sportwissenschaftlicher Sicht. Deutscher Arzte-
Verlag.
Gu, Y., Li, J., Ruan, G., Wang, Y., Lake, M., and Ren,
X. (2010). Lower limb muscles semg activity dur-
ing high-heeled latin dancing. In Lim, C. and Goh, J.,
editors, IFMBE Proceedings. Springer.
Jewell, D. V. (2010). Guide to Evidenced-Based Physical
Therapist Practice. Jones & Bartlett Publ.
Kuris, B. (2010). Kinematics Guide Revision 1e. Shimmer
Research.
Medved, V. (2000). Measurement of Human Locomotion.
CRC Press.
Merletti, R. and Parker, P. A. (2004). Electromyography.
John Wiley & Sons.
Robertson, D. G. E. R. and Caldwell, G. (2004). Research
Methods in Biomechanics. Human Kinetics.
R
¨
uhl, J. and Laubach, V. (2012). Funktionelles Zirkel-
training: Das moderne Sensomotoriktraining f
¨
ur alle.
Meyer & Meyer Verlag.
SENIAM project (2012). Sensor placement. Website.
Available online at http://www.seniam.org; visited on
October 25th 2012.
Shimmer Research (2011). Shimmer-brochure-pack. Tech-
nical report.
Shimmer Research Support (2012). EMG User Guide Rev
1.2. Shimmer Research.
Sport-Thieme (2012). Sport-thieme
R
: Sport- und
therapiekreisel. Website. Available online at
http://www.webcitation.org/6BgicOk7Y; visited on
October 25th 2012.
Thiers, A., l’Orteye, A., Orlowski, K., and Schrader, T.
(2014). Technology in physical therapy wireless sen-
sors and the sensorimotor training. Healthinf 2014.
von Eisenhart-Rothe, A., Kolarzik, D., and Spoerhase, S.
(2007). Strategische Planung in der Physiotherapie-
Praxis. Thieme.
icSPORTS2014-InternationalCongressonSportSciencesResearchandTechnologySupport
52
