
Investigation of Sensor Parameters for Kinematic Assessment of Steady
State Running Using Foot Mounted IMUs
G. P. Bailey and R. K. Harle
Computer Laboratory, University of Cambridge, William Gates Building, 15 JJ Thomson Avenue, Cambridge, U.K.
Keywords:
Running, Gait, Foot Kinematics, Continuous Sensing, Sampling Rates, Sensor Requirements, Impact
Acceleration.
Abstract:
The continuous sensing of kinematics provides an opportunity to monitor changes in sporting technique or
to aid in injury rehabilitation. Inertial sensors are now small enough to integrate into footwear, providing a
potential platform for continuous monitoring that does not require additional components to be worn by the
athlete and can be used to assess foot kinematics during running. To facilitate widespread adoption, sensor
systems must be as cheap as possible. To achieve this it is required that such systems be engineered with
sampling rates that are not unnecessarily high and with sensor components that meet the requirements of
the task, including required accuracy. We investigate multiple sensor parameters (sampling rate, acceleration
range) and their effect on the accuracy of kinematic assessment using foot worn inertial sensors. We find that
Extended Kalman Filter based trajectory recovery seems to be little affected by sampling rates until below
250Hz. We investigate impact accelerations using an inertial measurement unit attached to the foot and find
that, at 250Hz, the acceleration signal peaks at up to 70g around heel strike.
1 INTRODUCTION
Biomechanical assessment of movement is a compli-
cated but valuable component of today’s elite sports
training. Assessment of running gait is particularly
important and is usually performed within a labora-
tory setting using video or optical motion capture.
These assessments are often characterised by expen-
sive equipment, manual analysis and subjective met-
rics. Furthermore the restricted space of a laboratory
necessitates evaluation either using a small number of
steps or, more often, a treadmill. In neither case is the
athlete free to move naturally and there is little guar-
antee that the gait exhibited is that found in the true
sporting arena.
In order to address these issues and to bring such
kinematic assessment to a wider audience, low-cost
inertial sensors are being embedded within consumer
products, allowing athletes to be assessed in their nat-
ural setting and, additionally, more frequently. Such
in-field constant-assessment brings with it additional
benefits, including tracking the progress of injury re-
habilitation and enabling longitudinal sports science
and biomechanical studies.
Foot-mounted sensors are popular since
lightweight sensors can be embedded within
shoes in a convenient, unobtrusive way. They may be
able to capture rich data, and have already attracted
commercial interest (e.g. the Nike+ shoe). In the
future, such sensors may be able to track relevant
performance metrics or detect compensatory patterns
that are the result of poor biomechanics.
Previous studies have shown that foot-worn sen-
sors are capable of providing a full three dimen-
sional trajectory of the foot during steady state run-
ning (Bailey and Harle, 2014) and walking (Mariani
et al., 2010) when combined with the inertial strap-
down navigation algorithm. This allows various met-
rics to be calculated that may be of use to coaches
or biomechanists, for example peak foot height or
mean step velocity. Our previous work found that
that usable results could be achieved using both an
Extended Kalman Filter and a linear dedrifting tech-
nique in combination with the strapdown algorithm
(Bailey and Harle, 2014). The work also suggested
limitations in the accelerometer resulted in short pe-
riods of sensor saturation around heel strike, and that
this may have compromised results.
The purpose of this study is to assess the effect
of sensor parameters on the accuracy of tracking the
three dimensional trajectory of the foot during steady
state running.
154
P. Bailey G. and K. Harle R..
Investigation of Sensor Parameters for Kinematic Assessment of Steady State Running Using Foot Mounted IMUs.
DOI: 10.5220/0005093601540161
In Proceedings of the 2nd International Congress on Sports Sciences Research and Technology Support (icSPORTS-2014), pages 154-161
ISBN: 978-989-758-057-4
Copyright
c
2014 SCITEPRESS (Science and Technology Publications, Lda.)

We address the following research questions:
• How do sampling rates affect the accuracy of tra-
jectory recovery?
Below a certain point, lower sampling rates might
be expected to produce less accurate results. At
what point does the sampling rate compromise re-
sults? There will be a trade off with sensor re-
quirements.
• What are the requirements of inertial sensors in
terms of range?
In order to capture the trajectory of the foot us-
ing inertial sensors, the captured signals should
not contain periods of saturation. The required
range of the sensor will depend on the sampling
rate used. For lower sampling rates, higher fre-
quencies will be attenuated during the low pass
filter stage reducing requirements on the sensor.
The running surface may also affect the sensor re-
quirements and so we include outdoor running on
a variety of surfaces.
• How much does a small amount of sensor satura-
tion affect results?
Our previous study found that any sensor satura-
tion usually happens at heel strike and typically
only for a few milliseconds (Bailey and Harle,
2014). Is it necessary to have a high range iner-
tial sensor or do periods of sensor saturation have
minimal affect on the accuracy of the results?
In answering these questions we will structure the
paper as follows. A section detailing the experimental
platform will be provided, followed by a section for
each of the research questions outlined above. These
sections will contain methods and results for the ex-
periment required to answer each question. We will
conclude by discussing how the results of each of the
three experiments trade off.
2 BACKGROUND
Limited research has been conducted with foot worn
sensors for running. However, some studies have
looked at impact accelerations at heel strike with sen-
sors attached to the shank. For example, (Mizrahi,
2000) investigated the effect of fatigue on impact
accelerations by attaching a ±50g accelerometer to
the tibial tuberosity. A high sampling rate was used
(1667Hz) and the authors found during the study that
the average impact acceleration increased with fatigue
to 11.1± 4.2g. However, impact accelerations at the
tibial tuberosity are likely to be much smaller than
those present at the foot.
Strapdown techniques have previously been inves-
tigated for use in assessing running kinematics but
sensor saturation was found around heel strike using
a ±16g sensor at 1kHz (Bailey and Harle, 2014). An-
other study (Bichler et al., 2012) used a similar tech-
nique with a 100Hz sampling rate but limitations in
the video reference system used as ground truth make
it difficult to compare the two studies in terms of ac-
curacy.
For pedestrian localisation applications, optimal
sampling frequency has been investigated (Munoz
Diaz et al., 2013). Although the authors did investi-
gate a wide range of scenarios including running, they
did not evaluate the effects lower sampling rates had
on accuracy for running. They concluded from a fre-
quency based analysis that the lowest usable sampling
rate for running would be 300Hz.
3 SENSOR PLATFORM AND
DATA CAPTURE
The sensor platform and methods common to each
part of the paper will be described in the following
section.
3.1 Inertial Sensors
Capture of inertial sensor data was facilitated using
the ION (Imperceptible On-body Node) sensor plat-
form (Harle et al., 2011) with the addition of an In-
ertial Measurement Unit (IMU) providing a three-
axis ±16g accelerometer and ±2000
◦
s
−1
gyroscope
(MPU-6000, InvenSense Inc.) and containing an in-
ternal 16 bit Analog-Digital Converter (ADC).
Additionally an analogue three-axis accelerome-
ter (ADXL377, Analog Devices Inc.) with a ±200g
range was included on the same PCB as the MPU-
6000, mounted on the reverse side such that both sen-
sors were co-located to expose them to the same mo-
tion. The ADXL377 was connected to the ION sensor
platform’s 14 bit ADC.
The sensor platform is lightweight, weighting ap-
proximately 15 grams in total, including battery.
The platform was extended to contain two ac-
celerometers due to sensor saturation observed in ear-
lier experiments. The lower 16g range sensor was
used to capture the majority of the data with the 200g
sensor capturing the high frequency peaks that occur
near heel strike.
The MPU-6000 has an internal Digital Low Pass
Filter, meaning the accelerometer and gyroscope sig-
nals on the MPU-6000 had a bandwidth of 260Hz and
InvestigationofSensorParametersforKinematicAssessmentofSteadyStateRunningUsingFootMountedIMUs
155

256Hz respectively. The analogue accelerometer was
set up with a 500Hz bandwidth.
All IMU signals were sampled at 1kHz and logged
to on-board flash memory. In all experiments the ION
sensor was placed on the lateral side of the shoe in
line with the ankle, as seen in Figure 1. The sensor
was firmly taped to the outside of the shoe to simulate
the scenario where it was built into the shoe, perhaps
embedded in the sole in a similar manner to the Nike+
shoe. Finally the validity of the zero-velocity assump-
tion (Foxlin, 2005) used in foot mounted inertial nav-
igation techniques has been evaluated (Peruzzi et al.,
2011). The study investigates different mounting lo-
cations on the foot and shows that the sensor position
we have used is among the best suited to using this
assumption.
3.2 Ground Truth
Ground truth, where applicable, was captured using
an optical motion capture system (Vicon Motion Sys-
tems, UK) sampling at 240Hz.
For experiments requiring ground truth, a tread-
mill was used in order to capture many steps in a lim-
ited motion capture area. While the biomechanics of
treadmill running may be different to overground run-
ning, results should be applicable to kinematic assess-
ment of overground running. This follows from the
observation that, from a sensing perspective, tread-
mill running differs from overground running only in
frame of reference.
The treadmill was set up without any inclination
as measured with a spirit level. The ION sensor was
attached to a custom jig containing 3 retro-reflective
markers (Fig. 1) for the motion capture system. The
jig adds an additional 30 grams of weight to the sys-
tem (45 grams total, including ION) but remains com-
fortable for test runs. The jig was laser cut and the
MPU-6000 and retro-reflective markers were aligned
with laser-etched outlines to ensure alignment be-
tween the jig and the inertial sensor axes.
Figure 1: Shoe with IMU and Jig for facilitating ground
truth capture using the Vicon Motion capture system.
3.3 Combining Accelerometer Signals
Our previous work shows that for treadmill running
at 3.4m/s and below, and at a sampling rate of 1kHz,
sensor saturation is present in the accelerometer sig-
nals when a 16g accelerometer is in use for short pe-
riods of time (Bailey and Harle, 2014).
Since the majority of the step contains signals
within the 16g range and only a few samples per step
are saturated, the 16g accelerometer data was used.
Any sensor saturation was corrected for using the
200g accelerometer to ‘fill-in’ the saturated samples.
This means that the lower noise and higher resolution
(16 bit vs. 14 bit) of the MPU-6000 (16g) was utilised
for the majority of the step.
Combination of the accelerometer signals was
done in the following way. In order to avoid any
artifacts produced by sensor nonlinearities near the
limit of the MPU-6000s range, samples with a value
greater than 140ms
−2
were replaced by those from the
higher range sensor. When applicable, this replace-
ment was done before any further processing (e.g.
down-sampling).
4 METHODS AND RESULTS
In order to address the research questions outlined in
section 1, a number of experiments were designed to
test sensor requirements. The methods and results of
each experiment are described in this section.
4.1 Effect of Sampling Rates
In order to assess sensor requirements at varying sam-
pling rates, inertial data were collected at a 1kHz sam-
pling rate before being digitally downsampled to sim-
ulate lower sampling rates.
Four participants took part in the study (2 male,
2 female). All participants had a heel-strike running
pattern. Ethics committee approval was obtained.
Participants were asked to warm up on the treadmill
for a few minutes to familiarise themselves with the
environment and treadmill speeds. Once the warm
up period was complete, the athlete rested for two
minutes as the experimental process was explained.
Four ninety-second runs were completed, with data
logging, by each participant. Data logging included
inertial data and motion capture data as described pre-
viously. Each run was performed at a predetermined
treadmill speed, approximately 2.3ms
−1
, 2.7ms
−1
,
3.0ms
−1
and 3.4ms
−1
, as measured by the Vicon sys-
tem. Prior to and immediately after each run, the ath-
lete was asked to stamp their feet three times in order
to facilitate simple synchronisation between the Vi-
con and ION systems. A single sensor placed on the
right foot was used to conduct the experiment. Due
icSPORTS2014-InternationalCongressonSportSciencesResearchandTechnologySupport
156

to the acceleration and deceleration of the treadmill at
the start and end of each run the middle 90 steps were
taken from each run to provide a total of 1440 steps
for analysis.
Once data collection was complete the signals
were subsequently downsampled in order to simulate
lower sampling rates. Integer downsampling factors
were used so that interpolation was avoided.
Downsampling for a given downsampling factor,
M, proceeded as a two step process. Firstly, to avoid
aliasing affects, the data was low-pass filtered. A 4th
order butterworth filter was used with a cut off fre-
quency of 0.8 f s
t
where f s
t
=
f s
b
M
and f s
t
is the target
sampling rate with f s
b
the base sampling rate used by
the ION sensor platform (always 1kHz). Secondly,
the resulting signal was decimated by retaining every
M
th
sample.
An Extended Kalman Filter (EKF), paired with an
inertial strapdown algorithm, was used to recreate the
trajectory of the foot from the inertial data (Bailey and
Harle, 2014; Foxlin, 2005). The speed of the treadmill
belt was applied as a pseudo measurement during the
mid-stance phase of gait along with a zero-foot height
pseudo measurement.
As an example of the kind of output that this tech-
nique can enable, Figure 2 contains two example steps
from two different people running at the same speed.
Differences in technique can be seen between the two
in these 2D plots. While 3D plots are possible we use
a 2D plot here to make the differences clearer.
This method was applied to each run from each
participant at each downsampling factor. The down-
sampling factors used produced the equivalent of
500Hz, 250Hz, 125Hz, and 62.5Hz in addition to the
1000Hz raw signal.
The technique creates a rich set of data detailing
the velocity, position and angle of the foot at the time
each inertial sample was taken. For trajectory evalua-
tion the position, velocity and attitude error is calcu-
lated for each step. Errors are calculated stepwise as
offsets in position at the start of the step are irrelevant
for an assessment of the step, therefore the ground
truth and inertial solutions are aligned in space before
calculating the following metrics.
Position error was calculated in the following
way:
s
error
(i, k) = ks
inertial
(i, k) −s
vicon
(i, k)k (1)
and velocity error was calculated as:
v
error
(i, k) = kv
inertial
(i, k) −v
vicon
(i, k)k (2)
where i is the step number and k sample number
within step i. Error in attitude was assessed as
θ
err
(i, k) = arccos
A.B
kAkkBk
(3)
Where A and B represent the vector [0, 0, 1]
T
in the
sensor’s frame of reference as measured by the INS
solution and Vicon respectively.
Figure 3 shows how sampling rates affect the
mean error in position, velocity and attitude. The
graphs show that with sampling rates lower than
250Hz the position and velocity error starts to in-
crease rapidly meaning that 1kHz is unnecessary and
in order to reduce sensor requirements a lower sam-
pling rate may be used without a large affect on accu-
racy up to 250Hz. Attitude errors were not as affected
by lower sampling rates staying stable until 125Hz.
Examples of the full 3D trajectory recovered by
the system are shown for two representative steps in
Figure 4 where the lower sampling rate has resulted
in much poorer performance.
4.2 Sensor Requirements
In order to find optimal sensor parameters we con-
ducted an experiment to determine the requirements
for the range of the accelerometer and gyroscope.
This is important to make sure that sensors do not sat-
urate during running as this may impair the accuracy
of the measurement obtained using strapdown tech-
niques.
Parameters that affect these requirements are sam-
pling rate, running speed and the characteristics of the
running surface.
Sampling rates affect sensor requirements due to
the low pass filtering required before the signals en-
ter the ADC. Before sensor signals are quantised, it
is usually necessary to low-pass filter the signal (in
the analogue domain) to a bandwidth of less than half
of the sampling rate (Nyquist rate) to ensure aliasing
artifacts are avoided. This low-pass filtering has the
effect of reducing peak accelerometer and gyroscope
signals. Sensor range requirements are therefore re-
duced as the sampling rate is also reduced. We there-
fore assess peak accelerations for running while using
differing sampling rates.
The accuracy of the algorithms used in (Bailey
and Harle, 2014) to assess running kinematics have,
so far, been assessed using a treadmill. While in use
treadmills may flex visibly as the runner hits the tread-
mill belt. This may reduce the peak accelerations ob-
served at impact. Since the primary use case of such
sensing is in overground running outside, we investi-
gated the effect of a number of outdoor surfaces on
the sensor range requirements as these are likely to be
larger than for a treadmill. For example, impact accel-
erations on tarmac are likely to be distinct from those
of grass or treadmill running.
Accelerometer and gyroscope data were collected
InvestigationofSensorParametersforKinematicAssessmentofSteadyStateRunningUsingFootMountedIMUs
157
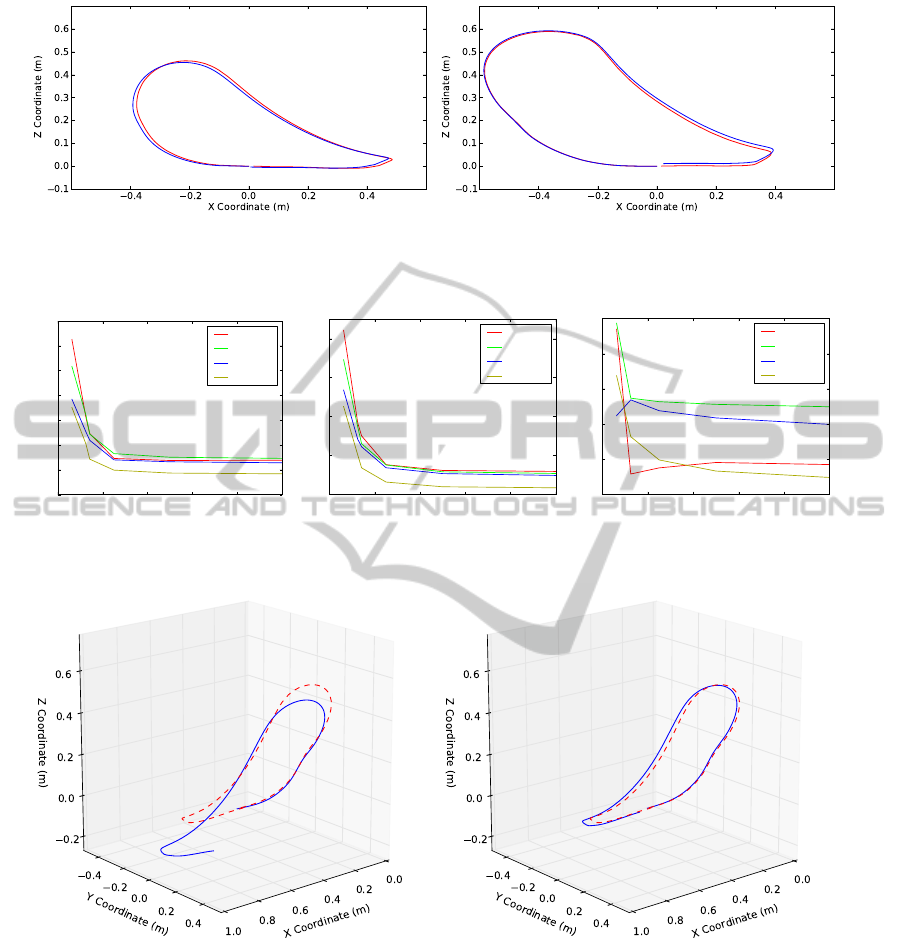
(a) Participant A (b) Participant B
Figure 2: 2D plots of position taken from inertial sensor data and ground truth using a motion capture system. The red line
represents ground truth and the blue the inertial solution. Both solutions taken from running on a treadmill at 3.4ms
−1
.
0 200 400 600 800 1000
Sampling Frequency (Hz)
0.02
0.04
0.06
0.08
0.10
0.12
0.14
0.16
Mean Error (m)
3.4ms
−2
3.0ms
−2
2.7ms
−2
2.3ms
−2
(a) Position
0 200 400 600 800 1000
Sampling Frequency (Hz)
0.1
0.2
0.3
0.4
0.5
Mean Error (ms
−1
)
3.4ms
−2
3.0ms
−2
2.7ms
−2
2.3ms
−2
(b) Velocity
0 200 400 600 800 1000
Sampling Frequency (Hz)
1.6
1.8
2.0
2.2
2.4
2.6
Mean Error (deg)
3.4ms
−2
3.0ms
−2
2.7ms
−2
2.3ms
−2
(c) Attitude
Figure 3: Mean error for position, velocity and attitude, for differing sampling rates.
(a) 125Hz (b) 250Hz
Figure 4: Figures showing a single step’s trajectory recovery at two different sampling rates.
for 3 participants (2 male, 1 female) and 5 surfaces.
The 5 surfaces tested were picked as likely scenarios
for outdoor running. Surfaces chosen were running
track, astro turf, tarmac, gravel, and grass.
Participants were asked to run on each of the
different surfaces, which were located in the same
area. Each participant ran 100 meters on each surface.
The data were then segmented into steps, midstance-
midstance and from each step the peak acceleration
was recorded.
Participants were asked to run at a self-selected
speed that would be representative of their steady
state running. The speed of each participant’s run was
estimated using a linear dedrifted strapdown algo-
rithm (Bailey and Harle, 2014; Mariani et al., 2010).
This was chosen over a Kalman filter based approach
due to the lower number of steps logged. The linear
dedrift method does not need time for a filter to set-
tle and so was better suited to these shorter runs with
similar levels of accuracy as verified by previous stud-
icSPORTS2014-InternationalCongressonSportSciencesResearchandTechnologySupport
158
3.0 3.5 4.0 4.5 5.0 5.5 6.0 6.5 7.0 7.5
Mean Foot Velocity, SV (ms
−1
)
0
200
400
600
800
1000
Peak Acceleration (ms
−2
)
1000Hz
astro
grass
gravel
tarmac
track
(a) 1000Hz
3.0 3.5 4.0 4.5 5.0 5.5 6.0 6.5 7.0 7.5
Mean Foot Velocity, SV (ms
−1
)
0
200
400
600
800
1000
Peak Acceleration (ms
−2
)
250Hz
astro
grass
gravel
tarmac
track
(b) 250Hz
3.0 3.5 4.0 4.5 5.0 5.5 6.0 6.5 7.0 7.5
Mean Foot Velocity, SV (ms
−1
)
0
200
400
600
800
1000
Peak Acceleration (ms
−2
)
125Hz
astro
grass
gravel
tarmac
track
(c) 125Hz
3.0 3.5 4.0 4.5 5.0 5.5 6.0 6.5 7.0 7.5
Mean Foot Velocity, SV (ms
−1
)
0
200
400
600
800
1000
Peak Acceleration (ms
−2
)
62.5Hz
astro
grass
gravel
tarmac
track
(d) 62.5Hz
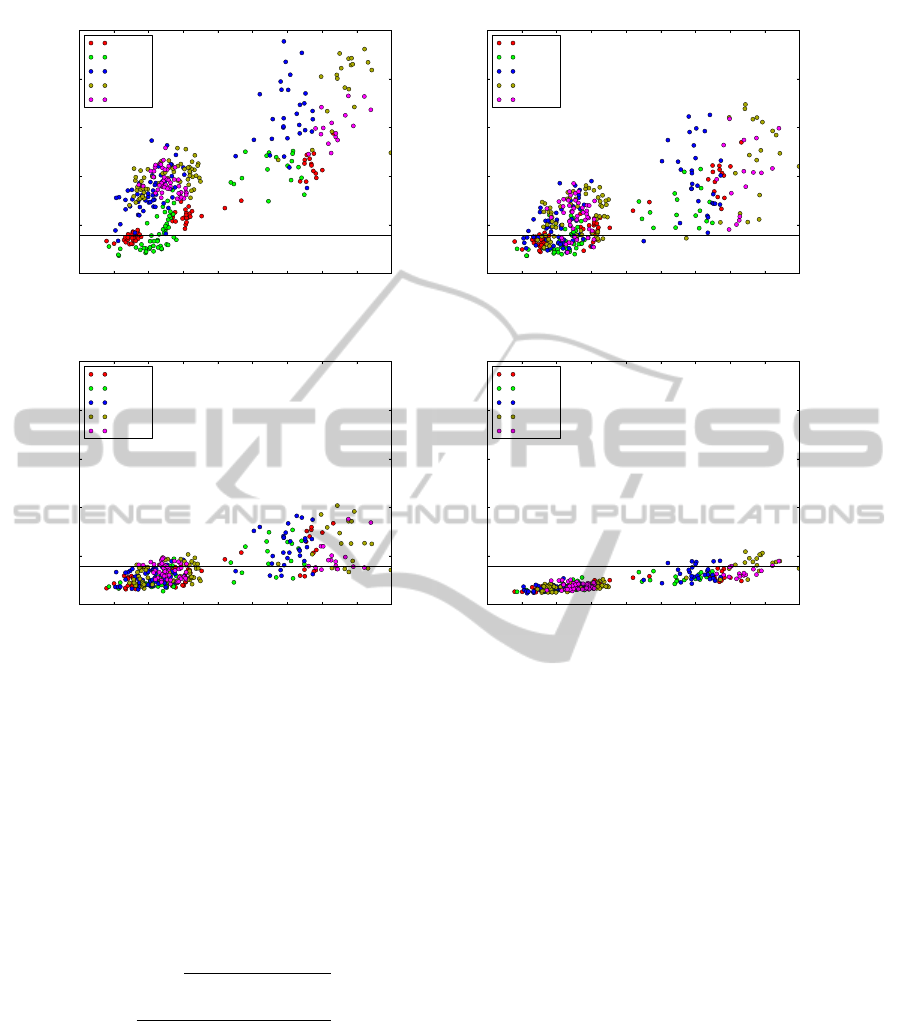
Figure 5: Figures showing peak acceleration plotted against mean foot speed for each step. The horizontal lines marks the
limit of the 16g sensor above which the sensor with a ±16g range would saturate.
ies.
The results obtained show that the largest factor in
peak acceleration was the foot speed but that surface
also affected requirements. Figure 5 shows the im-
pact acceleration for all steps logged plotted against
the mean foot velocity (SV) for each step. SV was de-
fined as in (Mariani et al., 2010), that is mean velocity
in the ground plane (the XY plane). For each step, be-
tween midstance events, the following was calculated:
SV (i) =
N
i
∑
k=0
q
v
x
(i, k)
2
+ v
y
(i, k)
2
N
i
(4)
where i is the step number, k is the sample number
within step i, and N
i
is the number of samples within
step i.
Figure 5 shows that even at 62.5Hz there were a
few samples that would saturate a 16g sensor at higher
speeds. At 1kHz the majority of steps would show
sensor saturation with a 16g sensor and the situation
improves only slightly at 250Hz, the point which we
found to be the optimal sampling rate.
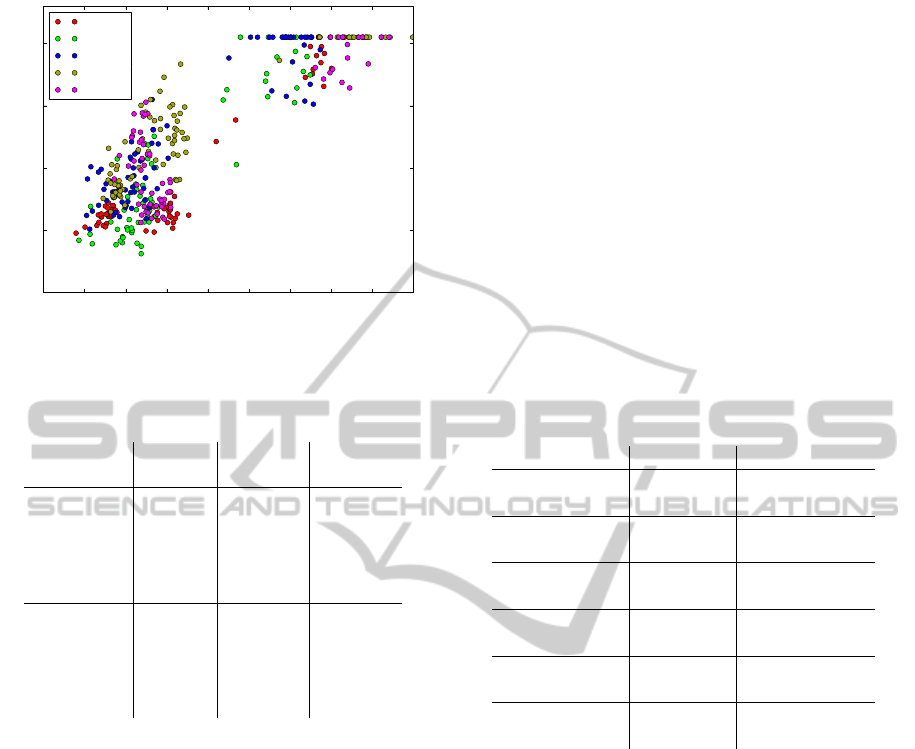
Mean and max peak accelerations are shown in
Table 1 showing high maximum accelerations on tar-
mac of around 90g. Study of peak gyroscope signals
were inconclusive as at higher speeds the sensor satu-
rated and it was not possible to obtain a higher range
sensor than the ±2000
◦
s
−1
sensor contained in the
MPU-6000. Figure 6 shows the data obtained at the
1kHz sampling rate, sensor saturation can be seen at
higher speeds.
4.3 Effect of Saturation on
Measurement Accuracy
While sensor saturation has been suggested as a po-
tential factor that may decrease accuracy of measure-
ment results no work has yet investigated how signif-
icant the loss in accuracy might be. Here we compare
the accuracy of results using the 16g accelerometer
only, to that which replaces saturated samples with
those taken from the 200g accelerometer.
This investigation re-uses the data listed in section
4.1 and the Extended Kalman Filter was applied in
InvestigationofSensorParametersforKinematicAssessmentofSteadyStateRunningUsingFootMountedIMUs
159
3.0 3.5 4.0 4.5 5.0 5.5 6.0 6.5 7.0 7.5
Mean Foot Velocity, SV (ms
−1
)
0
500
1000
1500
2000
Peak Angular Velocity (deg.s
−1
)
astro
grass
gravel
tarmac
track
Figure 6: Plot of maximum rate against mean foot speed
showing saturation of the ±2000
◦
s
−1
gyroscope.
Table 1: Mean and maximum step accelerations for the ac-
celerometer.
Sampling
Rate (Hz)
Surface Mean
(ms
−2
)
Max.
(ms
−2
)
1000
astro 244 575
grass 229 503
gravel 438 954
tarmac 481 922
track 430 729
250
astro 207 539
grass 168 428
gravel 261 651
tarmac 286 694
track 272 635
the same manner. However the filter was run twice,
once with the data as described in section 3.3 and once
with data from only the 16g accelerometer containing
sensor saturation. The data were processed for the
highest sampling rate available, 1kHz.
Error statistics were calculated as in 4.1 to give
error values for each sample in each step. Subse-
quently, for each step, the maximum and mean er-
rors were calculated for position, velocity and atti-
tude. For example s
error
max
(i) = max
k
(s
error
(i, k)) and
s
error
mean
(i) = mean
k
(s
error
(i, k)) give the maximum er-
ror in position and the mean error in position for step
i. These statistics were similarly calculated for veloc-
ity and attitude. The mean and standard deviation for
these statistics are presented in Table 2.
The results show an increase in the error for
the 16g only trajectory recovery. Table 2 shows
the results for the fastest treadmill speed recorded,
3.4ms
−1
. It can be seen that there is a reduction in
the mean and maximal error when using the combined
16g/200g sensor as opposed to 16g only.
As an example of a potentially interesting metric
that could be calculated, the mean foot velocity was
also assessed over all steps. Mean foot velocity (SV)
was calculated as defined in section 4.2.
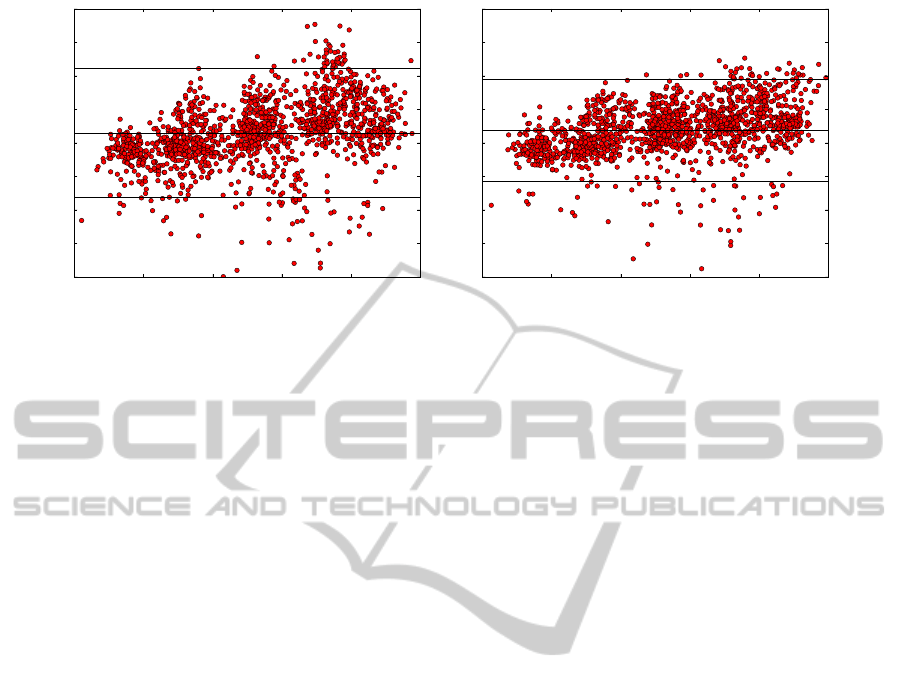
Bias, standard deviation and limits of agreement
were calculated for the SV metric over all steps for
both sensor setups. Using the combined setup the
bias and standard deviation were 0.007±0.0156ms
−1
with limits of agreement −0.023ms
−1
to 0.038ms
−1
.
Using the 16g only sensor the bias and standard de-
viation were 0.006 ±0.020ms
−1
with limits of agree-
ment -0.033ms
−1
to 0.044ms
−1
. Bland-Altman plots
for the results can be seen in Figure 7. Both show
some correlation in error with speed and the com-
bined sensor setup shows slightly tighter limits of
agreement. However, both sensor setups produce a
level of accuracy that may be useful for this metric.
Table 2: Mean and standard deviation of per-step met-
rics for different sensor setups at 1kHz while running at
3.4ms
−1
.
Measurement
Sensor Mean and SD
s
error
max
(m)
Combined 0.087 ± 0.061
16g 0.142 ± 0.115
s
error
mean
(m)
Combined 0.048 ± 0.033
16g 0.079 ± 0.063
v
error
max
(ms
−1
)
Combined 0.52 ± 0.12
16g 0.60 ± 0.21
v
error
mean
(ms
−1
)
Combined 0.16 ± 0.08
16g 0.24 ± 0.15
θ
error
max
(Deg)
Combined 3.30 ± 0.90
16g 4.71 ± 1.85
θ
error
mean
(Deg)
Combined 1.77 ± 0.71
16g 2.98 ± 1.48
5 CONCLUSIONS
This work has shown that a trade off in sampling rate
is possible in order to obtain lower sensor require-
ments. Extended Kalman Filter based trajectory re-
covery seems to be little affected by sampling rates
until below 250Hz. However at 250Hz there would
still be regular saturation in overground running on
outdoor surfaces using a ±16g accelerometer.
We also show that sensor saturation does affect the
accuracy of the trajectory recovery. We found that the
addition of a high range accelerometer resulted in up
to a 40% reduction in error for some metrics, for ex-
ample the reduction of mean attitude error reduced
from 2.89
◦
to 1.77
◦
. However, it remains unclear
how much larger peak accelerations present in higher
speeds in an outdoor scenario would affect the accu-
racy as we were limited in the maximum speed of the
treadmill. As such, it remains unclear as to how the
icSPORTS2014-InternationalCongressonSportSciencesResearchandTechnologySupport
160
1.6 1.8 2.0 2.2 2.4 2.6
Mean SV measured by Vicon and EKF 16g (ms
−1
)
−0.08
−0.06
−0.04
−0.02
0.00
0.02
0.04
0.06
0.08
Difference of SV measured by Vicon and EKF 16g (ms
−1
)
(a) 16g
1.6 1.8 2.0 2.2 2.4 2.6
Mean SV measured by Vicon and EKF Combined (ms
−1
)
−0.08
−0.06
−0.04
−0.02
0.00
0.02
0.04
0.06
0.08
Difference of SV measured by Vicon and EKF Combined (ms
−1
)
(b) Combined
Figure 7: Bland-Altman plots for SV as calculated from Combined and 16g sensor data.
method would perform for elite endurance athletes at
greater running speeds. Further research should seek
to attempt to evaluate these methods at higher speed.
We have been unable to assess requirements for
the range in angular velocity measurement to inform
gyroscope selection due to limitations in our sensor
at higher speeds and it may prove difficult to test in
the future due to the lack of commercial availability
of MEMS gyroscopes that have a higher range than
the ±2000
◦
s
−1
one used in this paper. Further work
may therefore seek to assess whether or not gyroscope
saturation has a significant affect on measurement ac-
curacy. If it is found to affect results further work
should seek to mitigate these periods of saturation if
possible.
REFERENCES
Bailey, G. and Harle, R. (2014). Assessment of Foot Kine-
matics During Steady State Running Using a Foot-
mounted IMU. Procedia Engineering, 72:32–37.
Bichler, S., Ogris, G., Kremser, V., Schwab, F., Knott,
S., and Baca, A. (2012). Towards high-precision
IMU/GPS-based stride-parameter determination in an
outdoor runners’ scenario. In Procedia Engineering,
volume 34, pages 592–597.
Foxlin, E. (2005). Pedestrian tracking with shoe-mounted
inertial sensors. IEEE Computer Graphics and Appli-
cations, 25(6):38–46.
Harle, R., Taherian, S., Pias, M., Coulouris, G., Hopper, A.,
Cameron, J., Lasenby, J., Kuntze, G., Bezodis, I., Ir-
win, G., and Kerwin, D. G. (2011). Towards real-time
profiling of sprints using wearable pressure sensors.
Computer Communications.
Mariani, B., Hoskovec, C., Rochat, S., B
¨
ula, C., Penders, J.,
and Aminian, K. (2010). 3D gait assessment in young
and elderly subjects using foot-worn inertial sensors.
Journal of Biomechanics, 43:2999–3006.
Mizrahi, J. (2000). Effect of fatigue on leg kinematics and
impact acceleration in long distance running. Human
Movement Science, 19(2):139–151.
Munoz Diaz, E., Heirich, O., Khider, M., and Robertson,
P. (2013). Optimal sampling frequency and bias error
modeling for foot-mounted IMUs. In International
Conference on Indoor Positioning and Indoor Navi-
gation, pages 1–9. IEEE.
Peruzzi, A., Della Croce, U., and Cereatti, A. (2011). Es-
timation of stride length in level walking using an in-
ertial measurement unit attached to the foot: A vali-
dation of the zero velocity assumption during stance.
Journal of Biomechanics, 44:1991–1994.
InvestigationofSensorParametersforKinematicAssessmentofSteadyStateRunningUsingFootMountedIMUs
161
