
ERGO1
Physical Evaluation and Training for Wheelchair Users
Sérgio Augusto Albino Vieira
1
, Cleudmar Amaral de Araújo
1
and Silvio Soares dos Santos
2
1
Habilitation/Rehabilitation Center in Paralympic Sports, Federal University of Uberlândia,
Avenida João Naves de Ávila 2121 – Bloco 1M, Uberlândia-MG, Brazil
2
Specialized Training Centre in Adapted Physical Education and Parasports, Federal University of Uberlândia,
Rua Benjamin Constant 1286, Uberlândia-MG, Brazil
Keywords: Wheelchair Ergometer, Physical Evaluation, Paralympic Sport, Wingate Protocol.
Abstract: According to the literature, there's a lack of methods, procedures and equipments for proper physical
assessment. Physical tests applied to persons with disabilities are questionable due to their lack of
adaptation to the motor gesture executed in these equipments, which are not the same executed in real
wheelchair propulsion. Within this, was designed and built at the Habilitation/Rehabilitation Center in
Paralympic Sports/UFU the second version of a wheelchair ergometer prototype that allows physical
evaluation, being faithful to the specificity of movements. The equipment has several electronic systems
controlled by computer such as electromagnetic resistance system, load cell, torquemeter, dedicated circuits
and acquisition system. Preliminary results indicate that the evolution became more practical for the
evaluator and comfortable for the user. The addition of flywheels and new calibration method proved its
efficiency by improving the signal acquired. New evaluation procedures for physical capacity look
promising.
1 INTRODUCTION
Physical activity, especially when directed to sports,
is one of the ways to promote social integration at
the same time that leads to health improvement,
fighting sedentary lifestyle and avoiding future
complications related to inactive life styles.
Wheelchair users represent a part of the
population that, due to its mobility reduction, suffer
from problems like cardiac complications, obesity,
diabetes, shoulder and wrist injuries, among others.
Frequently some of these problems result from
activities developed in their daily life, such as seat
transfer that makes the shoulder go through
overcharges for which they are not prepared.
With regards to the generation of opportunities
for disabled persons, one can highlight a great need
for methods and processes for the evaluation of their
physical capacities, mainly in sports and especially
in high performance sport. However, Brazil has
shown great potential in this particular area. For
example, since the Olympics in Atlanta-1996 until
London-2012, Brazil left the 37º place with two gold
medals to the 7º place with 21 gold medals. In the
Parapan American Games of 2011 at Guadalajara,
Brazil reached first place with 81 gold medals.
According to this, Brazilian Paralympic Committee
(CPB) started in the last year partnerships with
academic teachers across the country to create the
Brazilian Paralympic Academy, searching to
establish the missing link between knowledge
production and its application. The first Specialized
Training Centre in Adapted Physical Education and
Parasports (CEFEP) was created in the School of
Physical Education at the Federal University of
Uberlândia.
Also based on this need, the Mechanical Projects
Laboratory from the Federal University of
Uberlândia created in 2007 a first prototype for a
wheelchair ergometer. During its test phase, several
structural and operational modifications were
identified. So, at the new Habilitation/Rehabilitation
Center in Paralympic Sports (NH/RESP), a new
version was designed and built. This paper will
focus on the differences between these prototypes
showing the advances made in this second version,
its preliminary results and some new features
planned for a third version.
69
Augusto Albino Vieira S., Amaral de Araújo C. and Soares dos Santos S..
ERGO1 - Physical Evaluation and Training for Wheelchair Users.
DOI: 10.5220/0005094800690076
In Proceedings of the 2nd International Congress on Sports Sciences Research and Technology Support (icSPORTS-2014), pages 69-76
ISBN: 978-989-758-057-4
Copyright
c
2014 SCITEPRESS (Science and Technology Publications, Lda.)

2 PHYSICAL CONDITIONING OF
WHEELCHAIR USERS
A low level of physical capacity is associated with
high risk of cardiovascular complications (Hjeltnes
and Jansen, 1990; Yekutiel, 1989) and may
contribute for reduction in life quality. This
reduction in physical capacity and, consequently, in
life quality, may lead to secondary conditions as
obesity, gastrointestinal problems, respiratory
complications, joint pain and others (Steele, 2004) –
coronary diseases are also highly related to physical
inactivity, high fat diet, smoking and stress
(Margonato, 2008). According to Margonato (2008),
people with spinal cord injury are also more exposed
to premature death due to cardiovascular accident.
Shimada et al. (1998) described wheelchair
propulsion as the repetitive simultaneous bilateral
movement of upper extremities. Through training,
it’s possible to enhance the efficiency of the
propulsion force although, simultaneously, the real
mechanical efficiency decreases. From a mechanical
viewpoint, application of a non-effective force might
be ineffective, but in a physiological viewpoint
might be the optimal solution for upper extremities
injuries (Lin et al., 2009). One of the fundamental
aspects for wheelchair propulsion analysis is the
definition of the motor gesture made. The propulsion
cycle is described in two phases: impulse and
recovery (fig. 1). Impulse phase is the period since
the hand contacts the rims applying force to
maintain or increase speed of the wheelchair.
Recovery phase is the period between two
consecutive impulse phases when the arms are
retracted to prepare for the next impulse (Kwarciak
et al. 2009). This propulsion cycle can also be
executed in two different ways: one called
synchronous, where both hands propel the rims at
the same time, and one called asynchronous where
the hands work alternate to propel the wheelchair
(Goose-Tolfrey et al., 2003).
Figure 1: Definition of wheelchair propulsion cycle.
Source: Kwarciak et al., (2009).
According to Boninger et al. (2002), wheelchair
users receive few or none instruction about how to
propel their wheelchairs or how to best adjust it to
avoid injuries. Bjerkefors et al. (2006) affirms that
it’s essential for this population to maintain an
adequate function for the shoulder’s muscles and
that it’s important to consider an activity capable to
stimulate muscular growth without symptoms of
pain and excessive use.
Regarding available exercising equipments, both
for rehabilitation and physical evaluation, literature
indicates that the first ergometers aroused around
1950, whereas its first technological evolution
regarding load control and information processing
came up only in 1954 with the first cycloergometer
produced in large scale developed by Astrand
(Sousa, 2007). This kind of ergometer was often
employed in studies that aimed to quantify forces
and obtain physiological responses (Harman et al.,
1987). After, arm ergometers arrived. This type can
be used in the initial stages of rehabilitation
programs and in subsequent phases to enhance
muscular resistance (Andrews et al., 1998). Its use is
also possible by persons with spinal cord injury,
hemiplegia and for cardiac rehabilitation (Dicarlo,
1983; Nilsson et al., 1975). Although these apparels
might be used by wheelchairs users along an
adequate exercise program, they don’t represent the
real motor gesture made by this population in its
wheelchairs.
Gordon et al. (2004) studied the different types
of resistance generation for ergometers. The most
common type, brakes made with belts, shows to be
flawed because of the dependence of dynamic
friction coefficient. It is recommended that
ergometry exams make use of computer controlled
interface and that its systems should be electronic or
electromagnetic, allowing standardization of
techniques, better control for load variation and
monitoring signals (Guimarães et al., 2003). Haisma
et al. (2006) mentions that it is important to have an
adequate monitoring of exercises and trainings to
verify changes in physical capacity, indicating if the
training or rehabilitation program in question is
effective.
3 ERG-CR09:
FIRST PROTOTYPE
The first prototype developed was built in two
modules, one for propulsion and one for
electromagnetic resistance (fig. 2). This
electromagnetic system has a generator for self-
powering and an electromagnetic brake. The whole
system was controlled by computer through an
application made with LabVIEW. For physical
evaluation, Wingate test was used.
icSPORTS2014-InternationalCongressonSportSciencesResearchandTechnologySupport
70
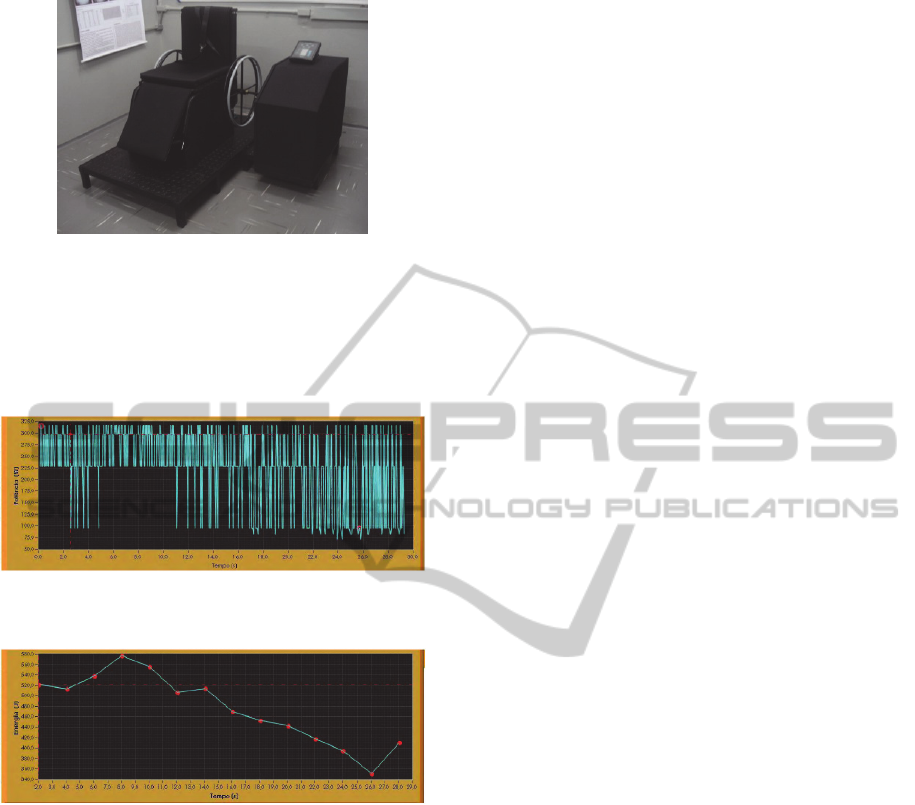
Figure 2: ERG-CR09.
During the tests, it was possible to follow user’s
power and energy. These data, after the test end,
were used to calculate fatigue index. Figures 3 and 4
shows a test result to exemplify the characteristics of
the response obtained by the software.
Figure 3: Absolute Power result where x axle is time (s)
and y axle is power (W). Source: Salgado (2009).
Figure 4: Absolute Energy result for the same test. X axle
represents time (s) and y axle represents energy (J).
Source: Salgado (2009).
As seen in these graphics, one cannot tell by
looking to the power curve when the user started to
lose its physical capacity nor in how much time that
happened. This information can only be seen at the
energy graph but this curve was only plotted after
the test.
Although this prototype was designed to be
comfortable and easily accessible to the user, several
modifications were identified during its tests.
Positioning of the user needed more adjustments,
dimensions were too big, signal was good but may
be improved, software interface may become more
friendly and many other aspects. In light of that, the
new prototype was designed in the search to fill the
gaps left by the previous one.
4 ERGO1
The second version of the wheelchair ergometer
prototype seeks to fill the gaps left by the first one.
Major modifications were made in some areas,
making it easier for the users and evaluators to work
with it.
4.1 Structure
The new structure was designed to reduce previous
dimensions. This was achieved changing the
configuration to combine both previous modules
into one. Material used was also changed to make
this version lighter, allowing its transport to become
easier.
According to the literature studied, in order to
improve comfort and also performance of the users,
it’s necessary for the ergometer to have structural
adjustments such as seat height, positioning related
to the wheels and many more (Boninger et al., 2000;
Sasaki et al., 2007; Sasaki et al., 2010).
To assess this structural project, a numerical
simulation using finite elements modelling tested it
with a maximum value chosen according to a load
cell linked to the structure. Maximum stress value of
this simulation was 19 MPa, which is much smaller
than the yield stress of the materials used (250
MPa).
4.2 Signal Improvement
One of the characteristics of the previous prototype
that led to the kind of signal seen on Figure 3 was
the result of braking torque during the test. The
pulsating brake and light rims caused the system to
completely stop each time the brake acted, even at
the its lowest level. This behaviour deviates the
ergometer from real operation of the wheelchair on
the ground.
Aiming to solve this, two inertial flywheels were
designed and added to the ergometer. Due to size of
these flywheels, the first pair of rims were excluded
making the most external part of these flywheels act
like rims.
The effect of this modification will be seen in the
sessions ahead about the calibration process and test
results.
4.3 Weight Acquisition
The load cell addition was made to the seat because
the test protocols need the user’s weight to calculate
the level of resistance to be applied.
ERGO1-PhysicalEvaluationandTrainingforWheelchairUsers
71
This feature has its own electronic circuit for signal
conditioning and it’s fully integrated to the software
that controls the ergometer, so all calculations are
made automatically.
After this modification, the beginning of test
protocol became easier for the evaluator – since he
only needs to press one button to obtain the
necessary information – and for the user – who
doesn’t need to go through a secondary equipment to
evaluate its weight.
4.4 Electromagnetic Resistance System
This part of the equipment remains almost the same
as the previous project, having gone through minor
modifications that are mainly structural to fit the
new composition.
This system is responsible for generating the
resistant torque and is controlled by computer
through a dedicated electronic circuit, allowing to
choose the brake level desired. The brake is based
on the Foucault principle (García, 2005).
4.5 Torquemeter
The electromagnetic brake generates resistance
levels triggered by respective voltage levels. Each
voltage level is responsible for promoting a resistant
torque range and receives an amplification through
transmission pulleys. To evaluate the power exerted
by the user in the equipment in accordance with the
effort being employed, a torquemeter was
developed. The equipment in question was mounted
in the ergometer.
Static calibration of this system was made by
locking the main transmission pulley and applying a
known load through standardized masses in a
support attached to the closest flywheel.
Due to limitations of the acquisition system, real
time acquisition of torque signal couldn’t be made
making it necessary to adjust a dynamic torque
curve in terms of angular speed. This way the torque
developed by the user along the test can be achieved,
allowing the calculation of power and energy spent
by the user during the test.
Experimental setup for this calibration was made
using a frequency inverter to control an induction
motor that is attached to the main axle of the
ergometer. The procedure consisted in acquiring a
torque curve for angular speeds from 10 to 70 RPM
with steps of 10 RPM.
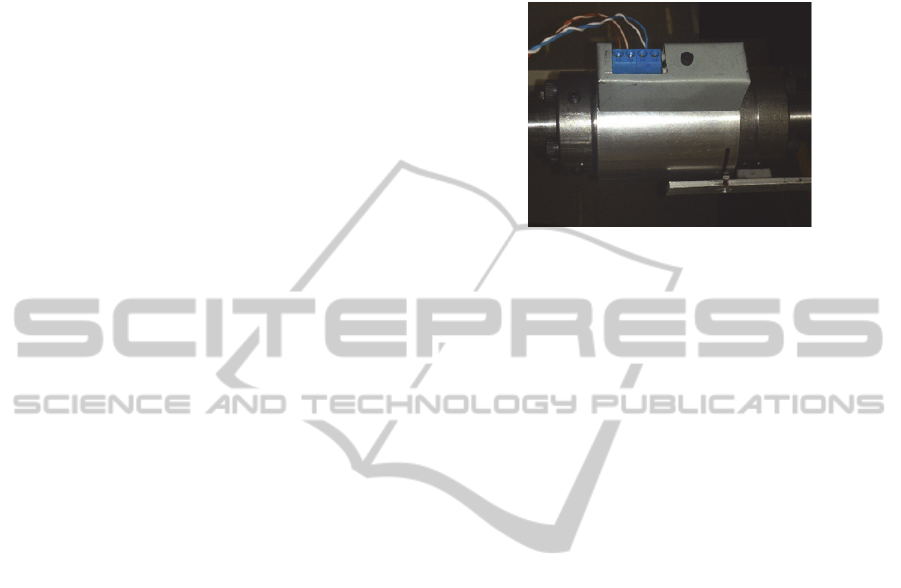
More recently, this calibration was remade due to
changes in the project. Now the torquemeter is a
modular equipment that can be removed from the
system at any time (Fig. 4). Also, calibration
procedure now starts at 15 RPM and goes until 95
RPM since it was noticed that some users can
achieve higher speeds than previously predicted.
Figure 5: Torquemeter used in ERGO1 prototype.
4.6 Software Developed in LabVIEW
Platform
To the execution of physical evaluation tests that
include controlling the electromagnetic resistance
system, acquiring user’s weight and giving
responses such as power levels, fatigue index and
energy parameters, an application using LabVIEW
platform was designed to perform the interface with
the user and to execute all control and acquisition
necessary to the system. This language was chosen
due to its easiness not only to implement a friendly
interface, but also for acquisition and signal
manipulation.
This interface aims to be friendly and easy to
use, allowing the tests to be executed by any person
without previous knowledge of the application.
4.7 Test Protocols
Two protocols that stand out to assess the fitness and
training are the Wingate and incremental. The first
was developed in 1970s in Israel and lasts for 30
seconds in which the user being tested must
overcome a resistance level doing maximum
possible effort. Due to this characteristic, this
protocol aims to assess physical conditioning
through anaerobic performance of the person (Bar-
Or, 1987; Franchini, 2002).
In the other hand, incremental protocols seek to
evaluate physical conditioning through aerobic
performance. Normally, the user has to maintain a
certain pace while the resistance is incremented at
determined time intervals. Test ends when the user is
no longer able to keep pace. Because of that, each
training or evaluation program sets its levels and
increment intervals.
icSPORTS2014-InternationalCongressonSportSciencesResearchandTechnologySupport
72
To evaluate test results, parameters as absolute and
relative power, absolute and relative average
equivalent energy and fatigue index are used, in
addition to torque curves and angular speed.
For the purpose of this paper, only Wingate
protocol was used. Three males and three females
with average age of 30 years were assessed. None of
them is an athlete. They are all able-bodied and have
performed the protocol at the first resistance level.
5 RESULTS
5.1 Test Protocols
Data from volunteers evaluated are shown in Table
1. Figure 5 shows a user ready to begin the test.
Tables 2 and 3 shows the result in terms of power,
energy, fatigue and heart rate for each individual.
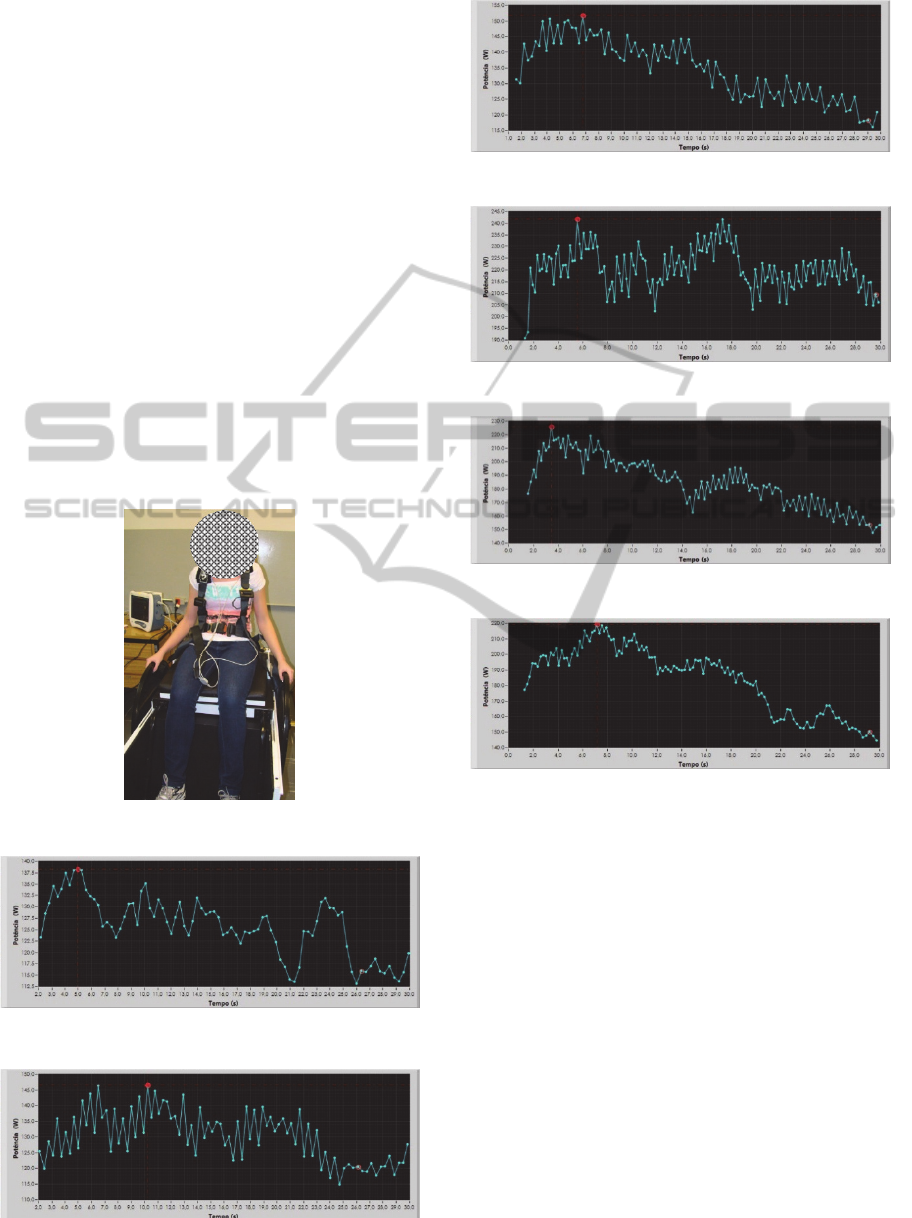
Figures 6-11 shows the graphics for absolute power.
Figure 6: User ready for the test.
Figure 7: Absolute power for volunteer 1.
Figure 8: Absolute power for volunteer 2.
Figure 9: Absolute power for volunteer 3.
Figure 10: Absolute power for volunteer 4.
Figure 11: Absolute power for volunteer 5.
Figure 12: Absolute power for volunteer 6.
In all power curves from Fig. 6-11 there's a
behaviour tendency in which the power first reaches
a maximum value and then diminishes until the end
of the test, reaching a minimum value. This
behaviour cannot be clearly seen for subjects 1, 2
and 4.
The latter had problems with seat fixation,
causing its performance and data acquisition to be
impaired, leading to the curve observed. Subjects 1
and 2 seems to not have done the maximum effort
required for Wingate protocol, which could explain
why their power output could still rise at the end of
the test.
Another characteristic observed in these results is
the general value of power output. According to
literature (Baker et al., 2011) they should be higher,
meaning that the system responsible for torque
acquisition must be reanalysed.
Despite these problems, comparing recent results
ERGO1-PhysicalEvaluationandTrainingforWheelchairUsers
73
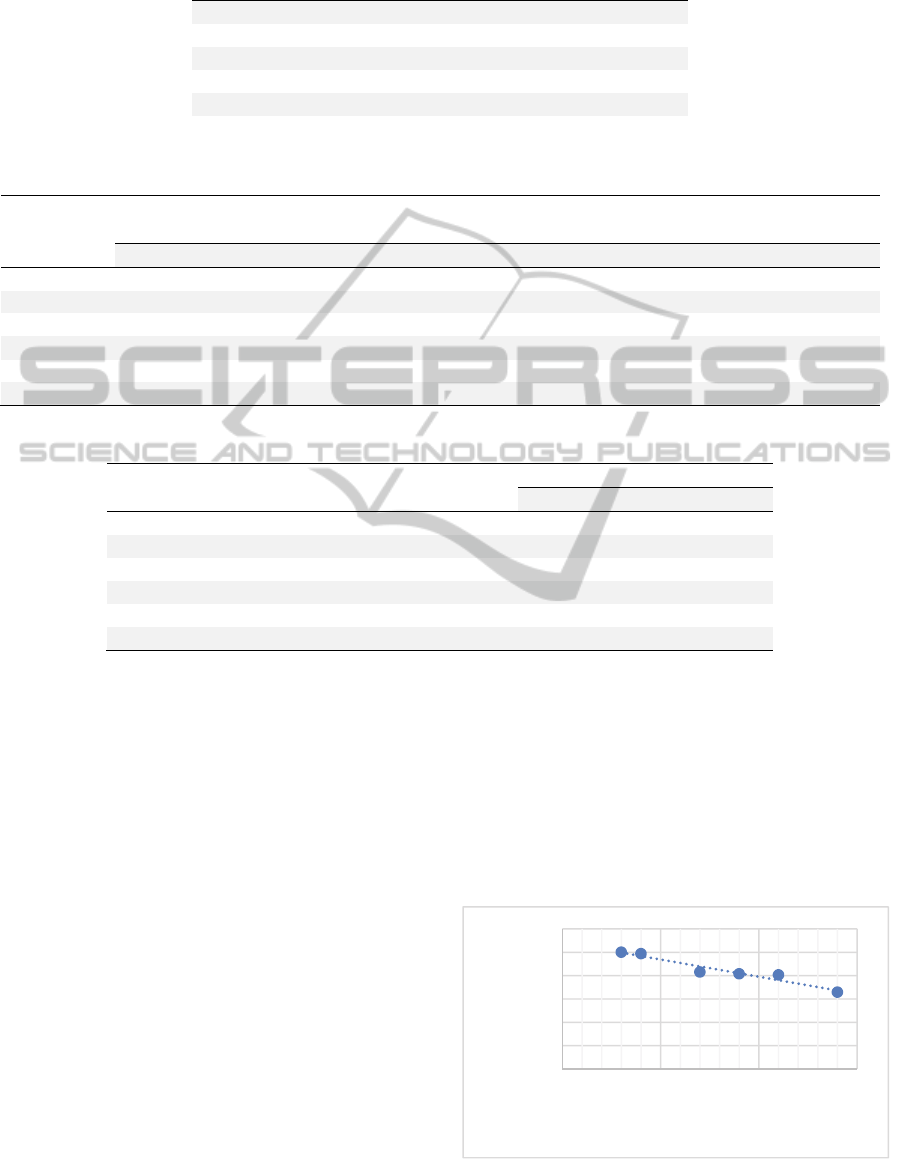
Table 1: Volunteers data for Wingate protocol.
Volunteer Gender Age (years) Weight (kg)
1 F 24 45
2 F 25 63
3 F 32 63
4 M 45 88
5 M 27 80
6 M 28 85
Table 2: Results in terms of power and energy for the Wingate protocol.
Volunteer
Absolute Power
(W)
Relative Power
(W/kg)
Average Equivalent
Energy (J)
Relative Average
Equivalent Energy (J/kg)
Max Min Max Min Max Min Max Min
1 138,30 113,09 3,07 2,58 249,36 164,41 5,54 3,65
2 146,58 114,91 2,33 1,91 255,89 203,75 4,06 3,23
3 151,86 116,14 2,41 1,88 253,76 204,48 4,02 3,24
4 241,79 203,06 2,75 2,38 426,89 368,35 4,85 4,18
5 225,84 147,69 2,82 1,92 388,92 244,01 4,86 3,05
6 219,30 144,70 2,58 1,77 386,88 250,75 4,55 2,95
Table 3: Fatigue index for the Wingate protocol.
Volunteer
Fatigue
Level (%)
Max Heart
Rate (BPM)
Blood Pressure (mmHg)
Initial Final
1 34,06 171 115 x 76 112 x 68
2 21,60 178 113 x 75 114 x 67
3 23,52 149 113 x 69 125 x 71
4 16,01 131 130 x 92 129 x 79
5 37,25 153 104 x 22 135 x 74
6 35,19 182 170 x 87 134 x 85
with results from the first prototype (Fig. 3 and 4),
one can see that now signal has improved. The
addition of flywheels in each propulsion rim with
the new torquemeter and calibration process made it
possible to identify performance levels while the test
is happening. This was only possible in the first
prototype after test completion when energy was
calculated.
Regarding heart rate, all subjects presented
similar behaviour. Subjects 3, 4 and 5 showed lower
maximum value because they have the habit of
regularly exercising.
5.2 Physical Capacity Curve
During the analysis of test results, a new way to
evaluate physical conditioning was proposed. This
new analysis is based on the calculation of average
equivalent energy and fatigue index, resulting in the
calculation of how much physical capacity the
person showed during the exercise.
For this analysis to be performed, the point of
maximum energy developed by the user became its
point of 100% of physical capacity. From this point,
every drop of energy level was considered a loss of
physical capacity. In case the energy level returned
to a higher value than the previous point, it was
considered that the physical capacity remained the
same, i.e. equal to the last calculated value. At the
end of calculations, plots of the physical capacity for
the test were generated. Points used in these plots
Figure 13: Curve of physical capacity for volunteer 3.
PC=‐1,4783.t+108,6
R²=0,9387
0
20
40
60
80
100
120
0102030
PhysicalCapacity(%)
Time(s)
icSPORTS2014-InternationalCongressonSportSciencesResearchandTechnologySupport
74
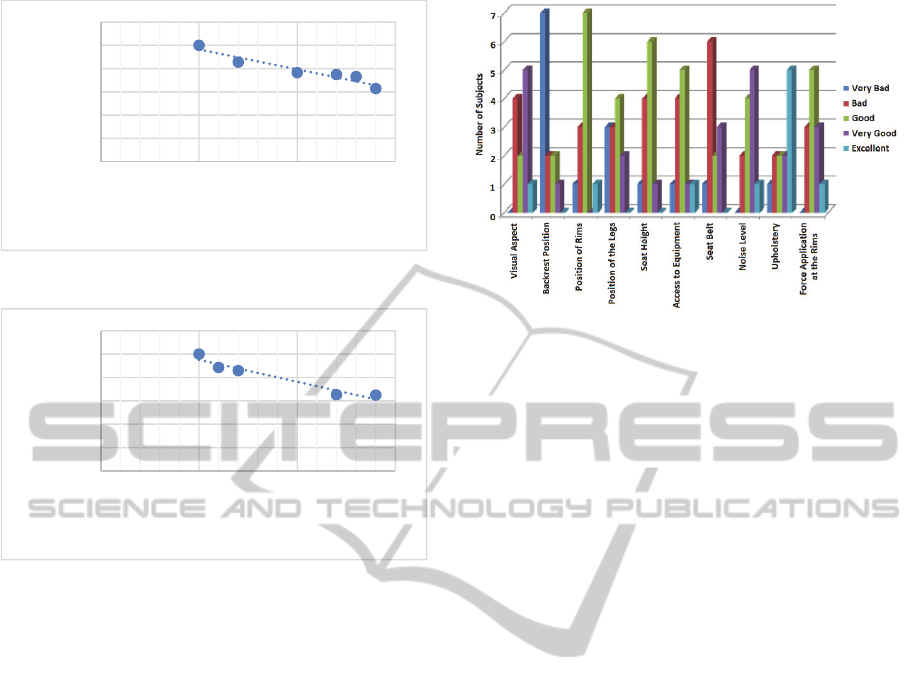
Figure 14: Curve of physical capacity for volunteer 5.
Figure 15: Curve of physical capacity for volunteer 6.
are the ones that show the moments of drop in
performance. Figure 12-14 presents the graphs for
subjects 3, 5 and 6.
The adjustment curves translated in equations
shown in the figures calculate physical capacity drop
rate in time for each subject. Concerning training
and rehabilitation of physical conditioning, this
curve becomes interesting, making it possible to
visualize the fatigue evolution of each person
analysed.
5.3 Ergonomics
Subjects from the previous prototype, ERG-CR09,
answered some questions about ergonomics. Results
are seen in Fig. 15. Two major criticisms made by
those volunteers were about backrest position, which
was a single fixed position, and seat belt – more
accurately, lack of it.
Although in this version users were not asked
about ergonomics because no subject with injury has
participated, structural modifications applied came
from those reports of ERG-CR09's volunteers.
Doing so, one believes that ERGO1 severely
improved its condition with regards to user's comfort
and safety.
Figure 16: Evaluation of ERG-CR09 prototype. Source:
Novais (2010).
6 CONCLUSIONS
The new wheelchair ergometer prototype has
reduced dimensions and weight compared to the
previous one, and the propulsion and
electromagnetic resistance modules were mounted
on the same structure. This prototype allows the user
to position himself more comfortably with respect to
the motor gesture, by adding ergonomic adjustments
for the seat and backrest. Seat belt can now provide
support to the torso. Beginning the test also became
more practical since the user's weight is
automatically captured.
Inertial flywheels added fulfilled their role,
softening the acquired signal and preventing the
braking force of causing interruption of the
movement as it used to happen in the first prototype.
The tests performed showed a behaviour
tendency for the new method proposed for
determining the physical capacity, despite the low
number of tests performed. This trend should be
confirmed by performing tests with a larger number
of volunteers.
ACKNOWLEDGEMENTS
The authors want to thank the funding agencies
CAPES, CNPq and FAPEMIG, the postgraduate
program at the School of Mechanical Engineering of
the Federal University of Uberlândia and the
NH/RESP – Habilitation/Rehabilitation Center in
Paralympic Sports.
PC=‐1,716.t+113,65
R²=0,9165
0
20
40
60
80
100
120
0 102030
PhysicalCapacity(%)
Time(s)
PC=‐1,8847.t+114,04
R²=0,9363
0
20
40
60
80
100
120
0 102030
PhysicalCapacity(%)
Time(s)
ERGO1-PhysicalEvaluationandTrainingforWheelchairUsers
75

REFERENCES
Andrews, J. R.; Harrelson, G. L.; Wilk, K. E., 1998.
Reabilitação Física das Lesões Desportivas.
Guanabara Koogan S. A., n. 2, p. 504f.
Baker, U. C.; Heath, E. M.; Smith, D. R.; Oden, G. L.,
2011. Development of Wingate Anaerobic Test Norms
for Highly-Trained Women. Journal of Exercise
Physiology online, v. 14.
Bar-Or, O., 1987. The Wingate anaerobic test: an update
on methodology, reliability and validity. Sports
Medicine, v. 4, p. 381-394.
Bjerkefors, A.; Jansson, A.; Thorstensson, A., 2006.
Shoulder muscle strength in paraplegics before and
after kayak ergometer training. European Journal of
Applied Physiology, v. 97, p. 613-618.
Boninger, M. L.; Baldwin, M.; Cooper, R. A.; Koontz, A.;
Chan, L., 2000. Manual wheelchair pushrim
biomechanics and axle position. Archives of Physical
Medicine and Rehabilitation, v. 81, p. 608-613.
Boninger, M. L.; Souza, A. L.; Cooper, R. A.; Fitzgerald,
S. G.; Koontz, A. M.; Fay, B. T., 2002. Propulsion
patterns and pushrim biomechanics in manual
wheelchair propulsion. Archives of Physical Medicine
and Rehabilitation, v. 83, p. 718-723.
Dicarlo, S. E.; Supp, M. D.; Taylor, H. C., 1983. Effect of
arm ergometry training on physical work capacity of
individuals with spinal cord injuries. Physical
Therapy, v. 63, p. 1104-1207.
Franchini, E., 2002. Teste anaeróbico de Wingate:
Conceitos e Aplicação. Revista Mackenzie de
Educação Física e Esporte, v. 1, p. 11-27.
García, A. F. Electromagnetísmo, 2005. Available in:
<http://www.sc.ehu.es/sbweb/fisica/elecmagnet/inducc
ion/foucault/foucault.htm>. Accessed in: May 28
2012.
Goosey-Tolfrey, V. L.; Kirk, J. H., 2003. Effect of push
frequency and strategy variations on economy and
perceived exertion during wheelchair propulsion.
European Journal of Applied Physiology, v. 90, p.
154-158.
Gordon, R. S.; Franklin, K. L.; Baker, J.; Davies, B., 2004.
Accurate assessment of the brake torque on a rope-
braked cycle ergometer. Sports Engineering, v. 7, p.
131-138.
Guimarães, J. I.; Stein, R.; Vilas-Boas, F.; Gavão, F.;
Nóbrega, A. C. L.; Castro, R. R. T.; Herdy, A. H.;
Chalella, W. A.; Araújo, C. G. S.; Brito, F. S., 2003.
Normatização de técnicas e equipamentos para
realização de exames em ergometria e
ergoespirometria. Arquivos Brasileiros de
Cardiologia, v. 80, p. 457-464.
Haisma, J. A.; Van Der Woude, L. H. V.; Stam, H. J.;
Bergen, M. P.; Sluis, T. A. R.; Bussmann, J. B. J.,
2006. Physical capacity in wheelchair-dependent
persons with a spinal cord injury - a critical review of
the literature. Spinal Cord, v. 44, p. 642-652.
Harman, E.; Knuttgem, H. G.; Frykman, P., 1987.
Automated data collection and processing for a cycle
ergometer. Journal of Applied Pshysiology, v. 62, p.
831-836.
Hjeltnes, N.; Jansen, T., 1990. Physical Endurance
Capacity, Functional Status and Medical
Complications in Spinal Cord Injured Subjects with
Long-standing Lesions. Paraplegia, v. 28, p. 428-432.
Kwarciak, A. M.; Sisto, S. A.; Yarossi, M.; Price, R.;
Komaroff, E.; Boninger, M. L., 2009. Redefining the
Manual Wheelchair Stroke Cycle: Identification and
Impact of Nonpropulsive Pushrim Contact. Archives of
Physical Medicine and Rehabilitation, v. 90, p. 20-26.
Lin, C. -J.; Lin, P. -C.; Su, F. -C., 2009. Preferred elbow
position in confined wheelchair configuration. Journal
of Biomechanics, v. 42, p. 1005-1009.
Margonato, V., 2008. Effects of training on
cardiorespiratory fitness and lipidic profile of
paraplegics. Sport Sciences for Health, v. 3, p. 7-9.
Nilsson, S.; Staff, P. H.; Pruett, E. D. R., 1975. Physical
work capacity and the effect of training on subjects
with long standing paraplegia. Scandinavian Journal
of Rehabilitation Medicine, v. 7, p. 51-56.
Novais, D. V., 2010. Projeto e construção de um
ergômetro para cadeirantes. 155p.
Salgado, G. L. A. C., 2009. Análise de um sistema de
geração de resistência eletromagnético utilizado em
um ergômetro para cadeirantes. 144 p.
Sasaki, M.; Iwami, T.; Obinata, G.; Miyawaki, K.;
Matsuo, K.; Kiguchi, K., 2007. Development of a new
adaptation system for a manual wheelchair based on
human body function. International Symposium on
Micro-NanoMechatronics and Human Science MHS
'07, p. 478-483.
Sasaki, M.; Shimakura, T.; Obinata, G.; Yamaguchi, M.,
2010. Adaptability evaluation of wheelchair based on
physical and mental load. International Symposium on
Micro-NanoMechatronics and Human Science (MHS),
p. 198-202.
Shimada, S. D.; Robertson, R. N.; Boninger, M. L.,
Cooper, R. A., 1998. Kinematic characterization of
wheelchair propulsion. Journal of Rehabilitation
Research and Development, v. 35, p. 210-218, 1998.
Sousa, M. S. C., 2007. Ergometria e ergoespirometria:
abordagem ao teste de banco. Laboratório de
Atividades Físicas Profª. Socorro Cirilo LTDA.
Available in: <http://laafisc.com.br/files/artigos/art06.
pdf>. Accessed in: July 07 2011.
Steele, C. A.; Kalnins, I. V.; Rossen, B. E.; Biggar, D. W.;
Bortolussi, J. A.; Jutai, J. W., 2004. Age-related health
risk behaviors of adolescents with physical disabilities.
Social and Preventive Medicine, v. 49, p. 132-141.
Yekutiel, M.; Brooks, M. E.; Ohry, A.; Yarom, J.; Carel,
R., 1989. The Prevalence of Hypertension, Ischaentic
Heart Disease and Diabetes in Trauntatic Spinal Cord
Injured Patients and Antputees. Paraplegia, v. 27, p.
58-62.
icSPORTS2014-InternationalCongressonSportSciencesResearchandTechnologySupport
76
