
Detrended-Fluctuation-Analysis (DFA)
and High-Frequency-Oscillation (HFO) Coefficients
and their Relationship to Epileptic Seizures
Fabrício Henrique Simozo
1
, João Batista Destro Filho
2
and Luiz Otávio Murta Junior
1
1
Department of Physics, University of São Paulo , Av. Bandeirantes, 3900, Ribeirão Preto, Brazil
2
School of Electrical Engineering, Federal University of Uberlandia, Av Joao Naves de Avila 2121, Uberlandia, Brazil
Keywords: Epilepsy, Electroencephalogram (EEG), Seizure Prediction, Detrended Fluctuation Analysis, High
Frequency Oscillations (HFO).
Abstract: We tested the applicability of methods based on Detrended Fluctuation Analysis and HFO detection to the
analysis of EEG signals from patients diagnosed with epilepsy, in order to test how efficient these methods
would behave in a seizure prediction application. We were able to statistically distinguish the coefficients
estimated in the pre-ictal period from the coefficients obtained on the inter-ictal period, suggesting that the
methods can be used to the development of seizure detection algorithms.
1 INTRODUCTION
1.1 EEG in Clinical Epilepsy
Epilepsy may be characterized by a diversity of
pathological neuronal conditions leading to
abnormal electric activity in a cortex region, thus
causing epileptic seizures (Fisher et al., 2005). Such
recurrent seizures impose harmful effects in life
quality, and frequently are associated with
irreversible damages in patient's cognitive
capabilities (Brodie, 2005).
The EEG signal is widely used to study the brain
clinical conditions, since it provides simple, costless
and non-invasive tool to investigate the brain
activity dynamics (Li et al., 2005).
For many years, the frequency band considered
clinically significant for analyzing the EEG signal
was lower than 70 (Jacobs et al., 2012). But the
identification of the patterns known as High
Frequency Oscillations (HFO) are pointing out that
biological relevant brain activity exceeds that
frequency band.
1.2 High Frequency Oscillations
High frequency oscillation (HFO) is a term used to
describe a high frequency EEG pattern including the
frequency range from 70 up to 500 Hz.
The first register of HFO patterns occurring
spontaneously in epileptic patients was obtained in
1999 (Bragin et al., 1999). Since then, several
researchers are studying the potential link between
the identification of HFOs and the occurrence of
epileptic seizures.
Detecting HFOs enable to identify the location of
the seizure onset zone in patients with normal
magnetic-resonance images (Andrade-Valenca et al.,
2012), and even non-invasive scalp EEG recordings
may provide enough data to support the use of HFOs
as biomarkers for the identification of the epileptic
zone (Andrade-Valenca et al., 2011), provided that
cerebral activity is carefully separated from
muscular artifacts.
However, some issues tied to the identification
of HFOs on healthy individuals suggests there is still
too much work to be done in order to better
understand and classify the high-frequency patterns
in a effective way (Buzsaki, Silva, 2012; Engel,
Silva, 2012).
1.3 Seizure Prediction
Seizure prediction may cause great benefit on
investigations related to diagnosis and treatment of
epilepsies. It enables pre-ictal SPECT exams (Li et
al., 2005), medical intervention to avoid the
occurrence of abnormal neuronal discharges and
99
Simozo F., Batista Destro Filho J. and Otávio Murta Junior L..
Detrended-Fluctuation-Analysis (DFA) and High-Frequency-Oscillation (HFO) Coefficients and Their Relationship to Epileptic Seizures.
DOI: 10.5220/0005095000990105
In Proceedings of the 2nd International Congress on Neurotechnology, Electronics and Informatics (NEUROTECHNIX-2014), pages 99-105
ISBN: 978-989-758-056-7
Copyright
c
2014 SCITEPRESS (Science and Technology Publications, Lda.)
even the self preparation of patients for the seizure,
making it easier and safer for those patients to
execute basic tasks, thus improving their life quality
(Quyen, 2005).
1.4 Goal
This article makes use of certain signal analysis
methods to extract characteristics from scalp EEG
signals of patients diagnosed with epilepsy, in order
to investigate seizures with information prior to their
occurrence. Consequently, we can evaluate the
usefulness of such methods in order to fund seizure
detection algorithms.
1.5 Signal Processing
1.5.1 Detrended Fluctuation Analysis
Detrended-Fluctuation Analysis (DFA) is a powerful
tool capable of providing a simple parameter to
represent the long-term power law correlation
proprieties of a signal. One advantage of this method
over the other fractal analysis methods is the
capability of detecting the correlations even when
the temporal series is not stationary (Chen et al.
2002). First described to analyze non-stationary
cardiac beating series (Peng et al. 1995), it has
already been successfully utilized in a variety of
studies in many areas (Lin et al., 2010; Zheng et al.,
2008; Lachowycz et al., 2013; Blesic et al., 2005).
Given a signal ,
0…
, wherein x
maybe the EEG recording, i represents the discrete
time and N is the total amount of signal samples, the
method consists of obtaining an integrate time series
∑
, so that the resulting signal is an
unbounded time series. This integrate series is then
divided in segments of size samples, and each
segment is approximated to a linear function of the
form . The square root mean deviation
between the integrated series and the linear
approximations is calculated using the expression.
1
(1)
One may conclude that grows as L
increases its amplitude, since using larger scales for
linear approximation will often result in larger
errors. In fact, it is given that the relation between
and is given by the power law
∝
(2)
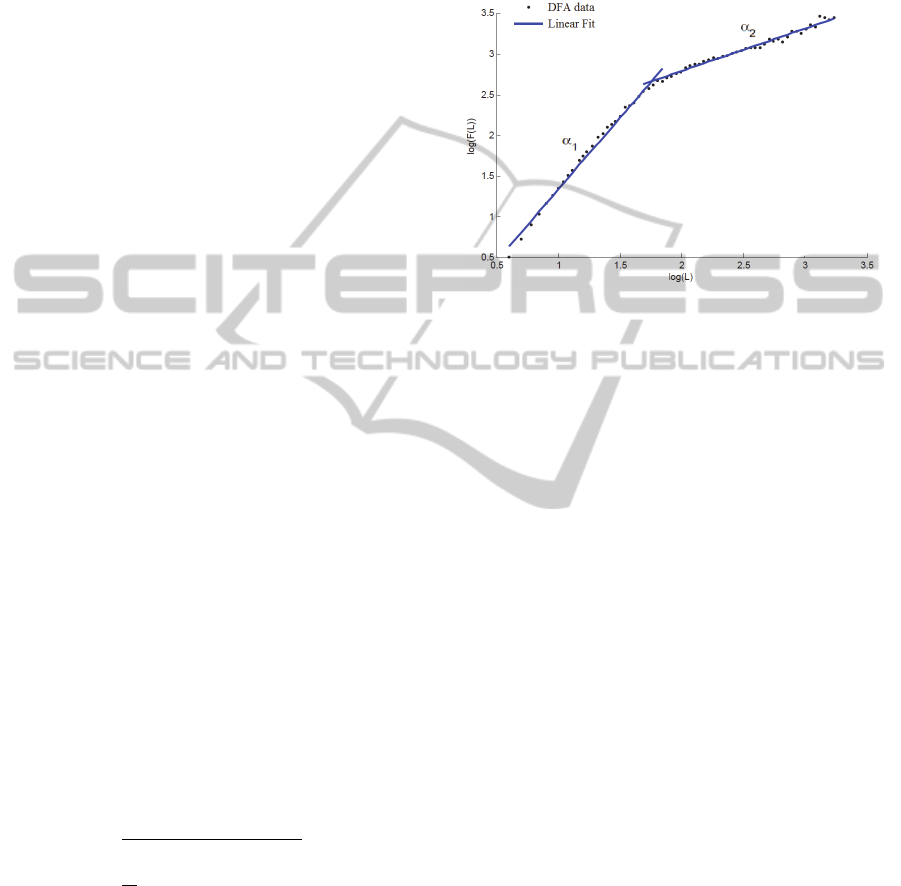
A plot of log
will provide the
coefficient as the angular coefficient of the
obtained line. Often, the log-log plot presents a
crossover phenomena and the data may be better
fitted if two angular coefficients,
and
, are
used, as depicted in Fig. 1.
Figure 1: Illustration of the crossover phenomena. It is
clear that the data is better adjusted by using two linear fits
with different angular coefficients
and
.
DFA method was already applied to studies
regarding epilepsy. It was suggested that the
coefficients obtained are capable of differentiate
ictal from inter-ictal epochs (Yuan et al. 2011), but it
is important to note that previous researches
involving DFA only considers the conventional
frequency band in EEG analysis and short time
interval records, resulting in limited portion of the
data (Parish et al. 2004; Yuan et al. 2011; Nikulin et
al. 2005). In this study we considered all frequency
bands available according to the Nyquist theorem.
Further, we analyzed several hours of EEG records
and considered both alpha coefficients provided by
the crossover effect. Therefore, resulting in a better
coverage for different frequency activities and better
estimates for the statistical analysis.
1.5.2 HFO Detection
Most of HFO detection methods are based on
detecting alterations on energy or power for various
segments of the signal, which is filtered to show
only the interest band of frequencies (Zelmann et al.,
2012).
There are comparisons between different types of
detectors, showing some algorithms may have better
results under certain circumstances, such as the
quantity of HFO in a small time interval (Zelmann et
al., 2012).
The implemented method used in this study was
based on the algorithm proposed by von Ellenriender
NEUROTECHNIX2014-InternationalCongressonNeurotechnology,ElectronicsandInformatics
100

and collaborators (Ellenriender et al., 2012), which
consists in a simple and functional method using a
moving threshold value, to which the local power of
the signal is compared to.
The original method consists in three steps.
The EEG signal is filtered, so that to consider a
few frequency bands of interest (high
frequency bands). The resulting signal will be
represented here by
,wherein the index k
will be associated to one single frequency
band. Notice that one may consider more than
one frequency band, resulting in more than one
filtered signal for the same EEG signal.
The moving threshold (
) and the Root
Mean Square () for a moving window
of size 4
for each filtered signal
are
calculated as shown in Equations (3) -(5),
wherein
is the number of samples tied to
one temporal cycle of the central frequency of
the kth frequency band in consideration.
1
1
2
2
(3)
min
,
(4)
1
4
1
(5)
Where
,
is the sample frequency of the
EEG signal and
being a fixed parameter. is the
proportionality constant,
The RMS (5) is then compared to the moving
threshold for each time sample , as shown in
(6). The result is a series with the same length
of the input signal (for each kth frequency
band), indicating the samples in which there
was an increase of the high frequency signal
power in reference to the basal activity.
0,
1,
(6)
The difference between the standard method of the
literature (Ellenriender et al., 2012) and our
proposition is related to the filtering of the signal
prior to the detection step. These differences are
noted in Section 2.2.
2 METHODS
2.1 Data Set Acquisition
All the EEG data used in this study was obtained
from the CHB-MIT database, which was collected
from epileptic patients on Children's Hospital
Boston. All signals were obtained with sampling
frequency of 256 and 16 bits resolution, using
the standard 10-20 international system for electrode
positioning.
All seizures observed during the recording of the
patients were marked by specialists with two time
markers, one for the start and one for the end of the
seizure.
The data bank is better described on Shoeb's
thesis (Shoeb, 2009) and is available on PhysioNet's
data bank (Goldberger et al., 2000).
Our dataset consists of a selection of 10 patients
from available data, including 54 epileptic seizures.
The selection was performed in order to automate
the algorithms to read and analyze the EEG signals,
since some of the files from the original database
contain extra channels, making some of the patients
having non standardized channel names and
distribution.
2.2 HFO Detection Parameters
For the pre-detection stage of the algorithm, the
EEG data was filtered using a band-pass FIR filter
designed based on the window method, considering
a Hamming window with 0.54. The cut-off
frequencies were
80 -
128 , and
the frequency response presented a ripple of
0.02, attenuation of 56 and transition band
width of 9.5.
2.3 Data Pre-Processing
To assess the behaviour of the methods' results in a
seizure prediction scenario, the methods were
applied in order to obtain the results as a function of
time.
The DFA method provides as result two
coefficients,
and
. To obtain a series of
and
in function of time, the original EEG signals were
divided into segments of length 5000, and to
each segment, the method was applied in order to
obtain both alphas. This leads to a time series for
each coefficient, and the time resolution of the series
is Δ/
, where
is the sample frequency of
Detrended-Fluctuation-Analysis(DFA)andHigh-Frequency-Oscillation(HFO)CoefficientsandTheirRelationshipto
EpilepticSeizures
101
the EEG data. In the case of this study, Δ
19.53.
In order to provide comparison between both
methods, the results from the HFO detection are
summarized by a time series with the same time
resolution of the time series generated from the DFA
analysis. The result is a time series for the
coefficients, indicating the rate of detected increases
on high frequency activity for each segment () of
length , as a function of time.
∑
.
.
(7)
2.4 Statistical Analysis
The statistical analysis was based on the distribution
of the coefficients obtained into four different
groups. The segments containing any part of the
signal belonging to a seizure are classified as the
seizure group (S group). The segments before the
occurrence of the seizure were classified as the
before-seizure group (BS group). The segments after
the occurrence of the seizure were classified as the
after-seizure group (AS group). The segments
distant to any seizure were classified as the distant-
seizure group (D group).
Our goal is to distinguish each of the groups
from the other ones, using a hypothesis test. We
have employed a “t test”, without the supposition
that the variances for the two compared distributions
are equal. This is also known as the “Welch t test”.
Hypothesis is that both groups under comparison are
generated from the same distribution and with
0.01, this hypothesis is rejected with 5%
confidence, meaning that the two compared
distributions are statistically different at that
confidence level.
2.5 Software
All steps of signal processing were developed using
our own software, which was particularly
implemented for visual analysis and processing of
EEG data. The software results from the need of an
efficient tool, including various processing methods
and offering an easy way of viewing and selecting
the EEG signal.
The software was written in C++, using Qt 4.8.5,
and it is still undergoing revisions and
improvements, so that to be released as free open
source software for general use of EEG data
processing.
All statistical analysis was made using scripts
from Mathworks MATLAB.
3 RESULTS AND DISCUSSION
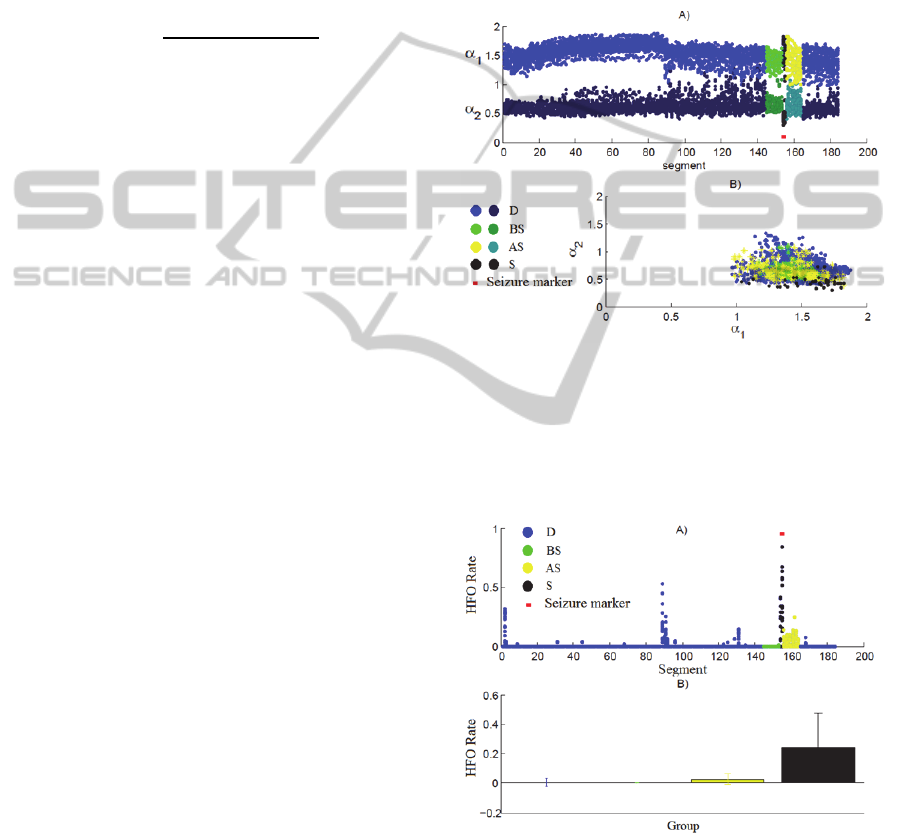
Figures 2 and 3 depicts results from the two
methods.
These figures show are tied to data for only one
seizure register of one single patient. For some
recordings, changes in the coefficients time
evolution near the occurrence of the epileptic seizure
is very clear, but in some cases the changes are
subtle or not present at all.
Figure 2: One-patient record example for: (A) the DFA
coefficients
and
presented as a function of the
segment number; (B) as
dispersion plot. Notice
the abrupt change on the behavior of
occurring around
segment 90. This change is not related to any marked fact,
but may be occurring due to changes on brain state or
muscular artifacts.
Figure 3: One-patient record example for: (A) HFO
detection rate, presented as a function of the segment
number; (B) mean and standard deviation for each one of
the segment groups within this record. One can note an
increased detection of high frequency activity around
segment 90 that is not related to any marked event, but
may be occurring due to changes on brain state or
muscular artifacts. This change is correspondent to the
behavior change visualized on Figure 2.
NEUROTECHNIX2014-InternationalCongressonNeurotechnology,ElectronicsandInformatics
102
There are some ruptures in both the DFA
coefficients and in the HFO rate coefficient time
course that are not related to any identified epileptic
activity, as seen in Figure (3A). These changes may
be due to muscular artifacts or even due to patient's
brain state changes (i.e, moving from sleep to awake
state).
In order to assess the consistency of the method,
we applied the statistical processing on all data,
including all patients and all seizures. Tables (1) and
(2) present the mean and standard deviation for the
four groups, following the classification of all data.
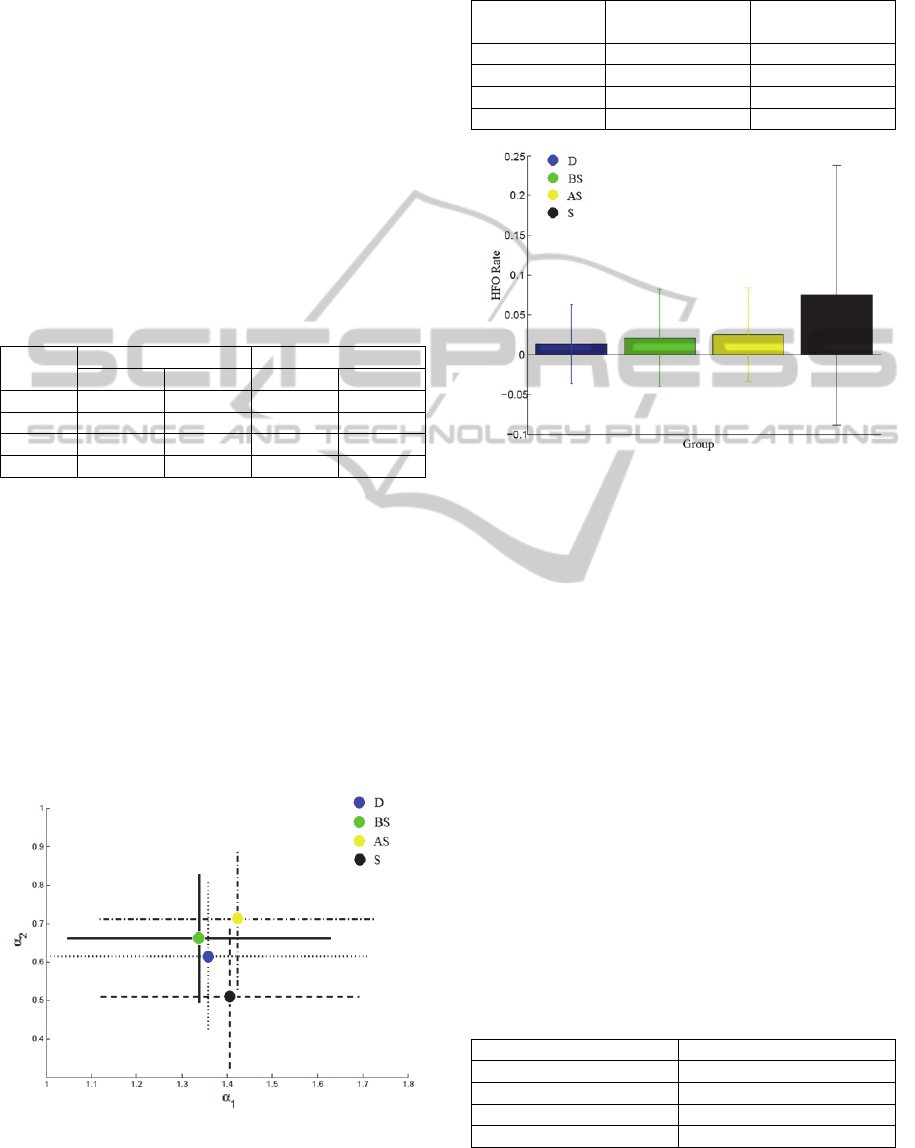
Figures 4 and 5 presents a better way of considering
the results respectively from Tables (1)-(2).
Table 1: Mean and standard deviation (SD) values of DFA
coefficients for each of the groups, considering all
recordings of the study (Section 2.4).
Group
Mean S.D. Mean S.D.
D 1.3587 0.3493 0.6165 0.1918
BS 1.3383 0.2913 0.6626 0.1675
AS 1.4234 0.3041 0.7105 0.1823
S 1.4061 0.2850 0.5107 0.1863
It is indeed clear that there are changes in the
mean for each group, even if the difference from one
group to another is small, also including huge
standard deviations. The
coefficient is increased
for both BS and AS groups, whereas for the S group,
the value of
coefficient is smaller when compared
to D group. Meanwhile, the
coefficient is smaller
for the BS group, but is increased for AS and S
groups, when compared to D group.
The HFO rate coefficient follows a more logical
and expected behavior, showing increased means for
BS and AS groups, and even higher mean for the S
group, when compared to the D group.
Figure 4: Mean and standard deviation for both DFA
coefficients, for each one of the four groups, considering
all recordings of the study (Section 2.4 and Table(1)).
Table 2: Mean and standard deviation values (SD) of the
HFO rate, estimated for each of the groups, considering all
recordings of the study (Section 2.4).
Group Mean HFO rate S.D.of HFO
rate
D 0.0134 0.0503
BS 0.0201 0.0613
AS 0.0247 0.0585
S 0.0747 0.1638
Figure 5: Mean and standard deviation of HFO detection
rate, for each one of the four groups, considering all
recordings included in the study (Section 2.4 and Table
(2)).
The SD is pretty high during the seizure.
After the statistical Welch t test was applied in
order to distinguish the different groups, it turned
out that, for any of the three coefficients, all the
groups are statistically different from one another.
All tests led to 0.01, which means that each
data group present a different statistical distribution
of coefficients, with 5% confidence margin.
While the HFO detection rate provides a very
high amplitude difference for each of the groups, it
is not the case for the DFA method, which presents
smaller differences between the mean of the
different groups. One of the explanations for how it
is possible to distinguish the groups is the fact that,
since the four groups contain data of all patients, the
number of segments in each distribution is very
large, as shown in Table 3.
Table 3: Total number of segments in each one of the four
groups, considering all recordings included in the study.
Group Number of segments
D 322161
BS 10395
AS 10353
S 4221
Detrended-Fluctuation-Analysis(DFA)andHigh-Frequency-Oscillation(HFO)CoefficientsandTheirRelationshipto
EpilepticSeizures
103

Using a segment length of 5000 is indeed a
good choice, since it leads to enough time resolution
for the time analysis of the coefficient changes.
Smaller segment sizes should be used carefully,
since the DFA method needs large number of signal
samples for the accurate estimation of the alpha
coefficients.
It should be pointed out that the practical clinical
framework of our article involves the application of
neuroprosthesis or continuous monitoring of critical
neurological patients. In both applications the
neurologist will not access the whole EEG data for
visually detecting HFOs, just because in the first
case recordings are not available to the external
environment, and in the second case the huge
amount of data prevents continuous visual analysis.
Consequently, data for the HFO detector was not
visually reviewed by a neurologist. In this context,
we can only assure that the detections pointed by the
HFO method depicts local increase in high
frequency activity of the brain, and may not be
directly related to the definition of pathological
HFO, used in most recent studies. Muscular artifacts
may also have been included as false positives for
high frequency brain activity, since they were not
treated in any specific way.
4 CONCLUSIONS
All classification groups were statistically
distinguished from one another. Notice that the
ability to separate the BS group from the D group is
really important as it suggests that it may be possible
to detect changes in HFO rate and long-term power
correlation of the EEG signal before the occurrence
of the epileptic seizure. The results also reinforce
previous researches, showing that the detection of
local increases on high frequency activity is related
to the occurrence of epileptic seizures (Engel, 2012).
Consequently, methods based on the Detrended
Fluctuation Analysis and HFO detection may
contribute to the development of seizure detection
algorithms. DFA methods may be even helpful to
locate the epileptogenic zone, through coefficient
variation maps generated along with MRI images.
Although there are previous studies
characterizing DFA analysis in identifying epileptic
seizures, this studies is novel in the scene of
analyzed frequency band and considered time
length. Therefore, target phenomenon are other than
in previous studies.
It is also worth noting that the methods are fairly
quick to run on current computers. Notice that the
HFO detection is slightly demanding in terms of
computational complexity than the DFA technique.
So algorithms based on these methods may be
applied in real time, enhancing the practical
capabilities provided by a seizure detector.
REFERENCES
Andrade-Valenca, L. P. et al., 2011. Interictal scalp fast
oscillations as a marker of the seizure onset zone.
Neurology, v. 77, n. 6, p. 524–3.
Andrade-Valenca, L. et al., 2012. Interictal high frequency
oscillations (HFOs) in patients with focal epilepsy and
normal MRI. Clinical neurophysiology : official
journal of the International Federation of Clinical
Neurophysiology, v. 123, n. 1,p. 100–5.
Blesic, S. et al., 2005. Detecting long-range correlations in
time series of dorsal horn neuron discharges. Annals of
the New York Academy of Sciences, v. 1048, p. 385–
91.
Bragin, a. et al., 1999. Hippocampal and entorhinal cortex
high-frequency oscillations (100–500 Hz) in human
epileptic brain and in kainic acid–treated rats with
chronic seizures. Epilepsia, v. 40, n. 2, p. 127–37.
Brodie, M. J., 2005. Diagnosing and predicting refractory
epilepsy. Acta neurologica Scandinavica.
Supplementum, v. 181, p. 36–9.
Buzsáki, G.; SILVA, F. L. da, 2012. High frequency
oscillations in the intact brain. Progress in
neurobiology, v. 98, n. 3, p. 241–9.
Chen, Z. et al., 2002. Effect of nonstationarities on
detrended fluctuation analysis. Physical review. E,
Statistical, nonlinear, and soft matter physics, v. 65, n.
4 Pt 1, p. 04110.
Ellenrieder, N. von et al., 2012. Automatic detection of
fast oscillations (40-200Hz) in scalp EEG recordings.
Clinical neurophysiology : official journal of the
International Federation of Clinical Neurophysiology,
v. 123, n. 4, p. 670–80.
Engel, J.; Silva, F. L. da, 2012. High-frequency
oscillations - where we are and where we need to go.
Progress in neurobiology, v. 98, n. 3, p. 316–8.
Fisher, R. S. et al., 2005. Epileptic seizures and epilepsy:
definitions proposed by the International League
Against Epilepsy (ILAE) and the International Bureau
for Epilepsy (IBE). Epilepsia, v. 46, n. 4, p. 470–2.
Goldberger, A. L. et al., 2000. PhysioBank, PhysioToolkit,
and PhysioNet: Components of a New Research
Resource for Complex Physiologic Signals.
Circulation, v. 101, n. 23, p. e215–e220.
Jacobs, J. et al., 2012. High-frequency oscillations (HFOs)
in clinical epilepsy. Progress in neurobiology, v. 98, n.
3, p. 302–15.
Lachowycz, S. M. et al., 2013. Long-range correlations
identified in time-series of volcano seismicity during
dome-forming eruptions using detrended fluctuation
analysis. Journal of Volcanology and Geothermal
Research, Elsevier B.V., v. 264, p. 197–209.
NEUROTECHNIX2014-InternationalCongressonNeurotechnology,ElectronicsandInformatics
104

Li, X. et al., 2005. Fractal spectral analysis of pre-epileptic
seizures in terms of criticality. Journal of Neural
Engineering, v. 2, p. 11-16.
Lin, L.-Y. et al., 2010 Detrended fluctuation analysis
predicts successful defibrillation for out-of-hospital
ventricular fibrillation cardiac arrest. Resuscitation, v.
81, n. 3, p. 297–301.
Peng, C. K. et al., 1995 Quantification of scaling
exponents and crossover phenomena in nonstationary
heartbeat time series. Chaos (Woodbury, N.Y.), v. 5, n.
1, p. 82–7.
Quyen, M. Le Van, 2005. Anticipating epileptic seizures:
from mathematics to clinical applications. Compte
Rendus Biologies 328, p. 187-198.
Shoeb, A. H., 2009. Application of Machine Learning to
Epileptic Seizure Onset Detection and Treatment.. 162
p. (PhD Thesis) — Massachusetts Institute of
Technology.
Zelmann, R. et al., 2012. A comparison between detectors
of high frequency oscillations. Clinical neuro-
physiology: official journal of the International
Federation of Clinical Neurophysiology, v. 123, n. 1,
p. 106–16.
Zheng, H. et al., 2008. Detrended fluctuation analysis of
forest fires and related weather parameters. Physica A:
Statistical Mechanics and its Applications, v. 387, n.
8-9, p. 2091–2099.
Detrended-Fluctuation-Analysis(DFA)andHigh-Frequency-Oscillation(HFO)CoefficientsandTheirRelationshipto
EpilepticSeizures
105
