
Software Reengineering Toolkit with Tangible Interface by Haptics
Makoto Yoshida
1
, Shinnta Okumura
1
and Noriyuki Iwane
2
1
Department of Information & Computer Engineering, Okayama University of Science, Okayama, Japan
2
Department of Information & Computer Science Hiroshima City University, Hiroshima, Japan
Keywords: Software Reengineering, Toolkit, Metrics, Haptics, Tangible User Interface.
Abstract: Software reengineering is an important task for software maintenance and improvement. Several metrics are
proposed for evaluating software programs, and the toolkits which evaluate the software using the metrics
are developed. The tool should be easy to understand, easy to modify the programs, enjoyable to use, and
must be effective. We developed the 3D visualized toolkit for software reengineering providing various
tangible user interfaces with haptics. The toolkit decomposes the java source program into small classes,
and integrates them into the harmonized program using haptic device. The decomposed classes can be given
the sound, colour and vibration attributes that can be touched and perceived, and can be merged into another
classes by moving the arm of the haptic device. This paper describes the toolkit which uses the haptic device
for program reorganization providing various tangible user interfaces. Software reengineering methodology
is proposed, and some experiments are performed and the results are presented.
1 INTRODUCTION
Most of the programs are not newly written; they are
reused, and the systems are maintained. The
objective of reengineering is to produce a new
maintainable system with least efforts (Stephen,
2007). The programs must be reorganized, and many
tools are developed (Serge, 2013). Metrics analysis
and visualization help to reorganize the programs
(Serge, 2000; Lanza, 2006). The reorganized
program must have adequate modularity; modules
with high cohesion and low coupling must be
maintained (Kionel, 1999; Fernando, 2000). M.
Lanza, et al, express the metrics of the program by
3D visualization and by the metaphor of cities
(Werrel, 2011; Greevy, 2006). Unharmonized
programs that may have intensive coupling, shotgun
surgery, dispersed coupling, god class, et al (Lanza,
2006), are recognized by visualizing the structure of
the program on metrics.
Looking at the tool interfaces, the user interface
has changed from CUI to GUI, namely from 1D
metrics values to 2D to 3D visualization, and now is
changing from GUI to TUI, the tangible user
interface. The TUI was first proposed by Ishii (Ishii,
1997), and now is used for as the next generation
interface. Ishii tried to operate the computer on
manipulating the virtual objects by touching and
moving the objects, connecting the body movement
with the computer operations (Ishii, 1997).
We developed the software reengineering toolkit
with tangible user interface by using hapatic device.
Two types of user interface: the active user interface
that the user can touch any objects and the passive
user interface that the arm of the haptic device
moves among objects automatically based on the
execution log of the program, are developed. As the
active user interface, the perceptual user interface
which can touch the program modules, which can
hear the sounds of program modules by hitting,
which can feel the vibration of program modules by
executing the program, are supported. As the passive
user interface, the movements of the arm of the
haptic device which follow the execution of the
program modules are supported. The program
modules are visualized as 3D objects like spheres
and cubes; each objects has its tangible attributes
mapped from the program metrics. The program
module structure is reorganized by decomposing and
coupling modules by using the tangible user
interface.
This paper describes the system framework and
the user interface of the toolkit for software
reengineering with some experiments. The
methodology using tangible user interface by haptics
is proposed and examined.
351
Yoshida M., Okumura S. and Iwane N..
Software Reengineering Toolkit with Tangible Interface by Haptics.
DOI: 10.5220/0005095203510356
In Proceedings of the 9th International Conference on Software Engineering and Applications (ICSOFT-EA-2014), pages 351-356
ISBN: 978-989-758-036-9
Copyright
c
2014 SCITEPRESS (Science and Technology Publications, Lda.)
2 TOOLKIT
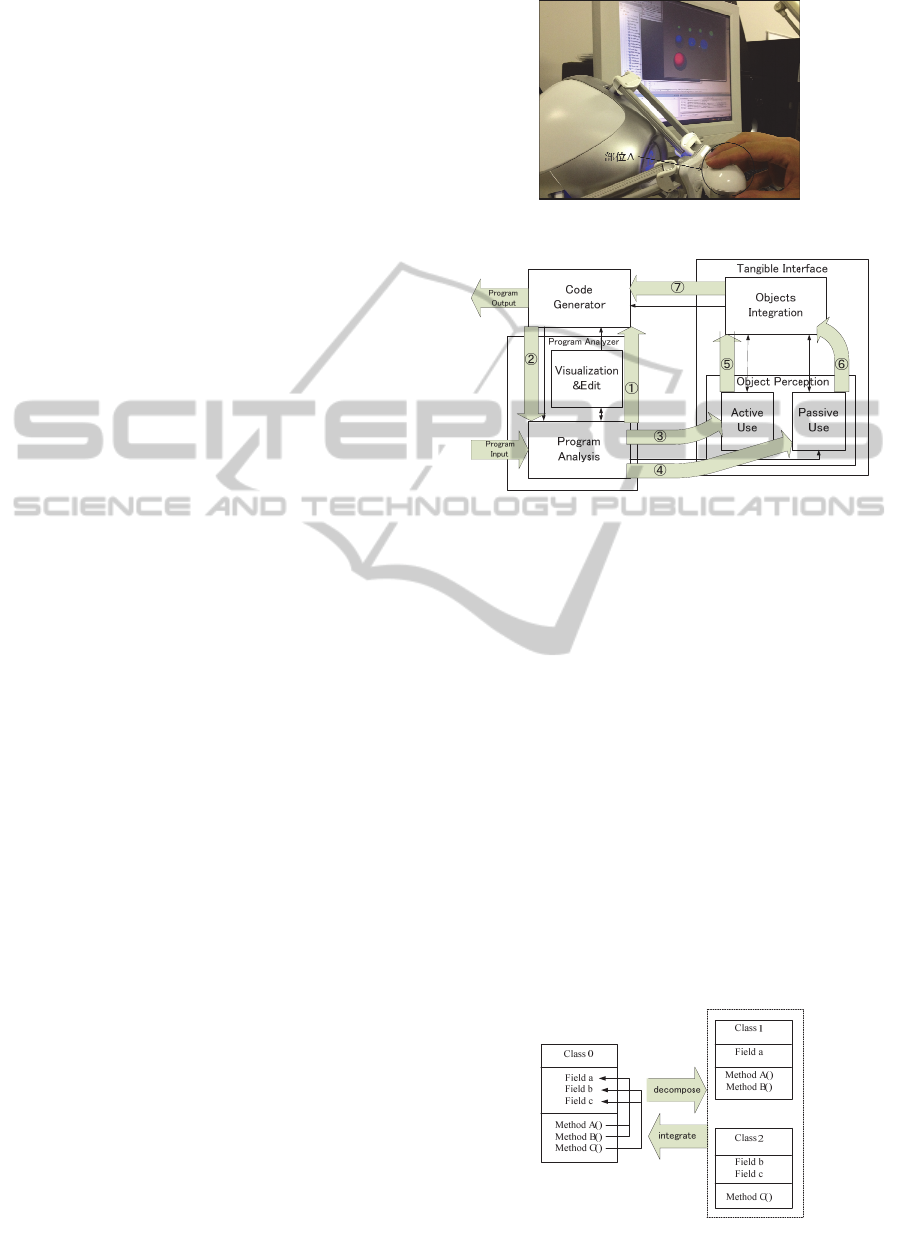
Figure 1 shows the haptic device, FALCON, the
physical device which provides the tangible user
interface to the toolkit. Through touching an object
displayed on the screen by the arm (catching Part A
in Figure 1), it can perceive the object. Recognizing
the object perception, it can couple the object putting
one onto another object. It integrates the objects
into one object.
Figure 2 shows the system framework of the
toolkit. It consists of three parts: the program
analysis part, the object perception part, and the
code generation part. The program analysis part
analyses the Java source program, and produces the
metrics of the program. Numbers of classes, lines,
methods, fields, dependency of classes, et al, are
analysed. It can also decompose the program into
smaller components. A class can be decomposed
into more small classes. Decomposed classes are
represented as the objects in the object perception
part given the device attributes mapped from the
metrics analysed. In object perception part, haptic
device shown in Figure 1 is used to manipulate the
object operations. In the code generation part, the
java source code is automatically generated from the
results of object integration operated either in the
object perception part or in the analysis part.
Figure 2 also shows the way that the program is
reengineered using the tangible user interface. There
exists three cycles in Figure 2. The first cycle is
depicted by the arrows ① and ②. This cycle uses
metrics to reorganize the program. In this cycle, the
metrics such as overviewPyramid, complexity,
hotspots and blueprint (Lanza, 2006) can be 2D
visualised, and used to reorganize the program. The
second cycle is depicted by the arrows ③,⑤ and ⑦.
The analyzed metrics are passed to the object
perception part, and those data are mapped to the
attributes of the haptic objects. As the user active
perception using the haptic device, the operations of
coupling and decomposing objects by sound hearing,
looking at the colours and feeling the vibration of
the objects, are provided. The third cycle is depicted
by the arrows ④,⑥ and ⑦. It is the user passive
perceptive operation using the haptic device. The
arm of the haptic device chases the program
execution. In addition to the above mentioned
mapping, it is possible to map the metrics into any
attributes of the haptic device. Any cycles can be
repeated any times; if n times cycles were repeated,
then 3
n
ways of the program reorganization can be
possible.
Figure 1: Haptic device.
Figure 2: Toolkit framework.
2.1 Program Analysis
Program analysis consists of two parts: the program
analysis part and the visualization & edit part. The
former analyses the program and produces the
metrics, and the latter visualizes and edits the
program and decomposes the program into smaller
elements such as subclasses and modules. One class
can be decomposed into several subclasses, or
integrated into one large class. This is shown in
Figure 3. Figure 3 shows that class 0 is decomposed
into two classes: class 1 and class 2, as the method A
and B only access the field a, and method C only
accesses the field b and c. Figure 3 also shows the
integration possibility of two classes, class 1 and
class 2, into a class 0. The basic policy for program
decomposition is the fact that the program can be
decomposed into the smaller unit if there exists no
dependency among units, namely if no units
interaction occurs.
Figure 3: Class decomposition & ntegration.
ICSOFT-EA2014-9thInternationalConferenceonSoftwareEngineeringandApplications
352
2.2 Object Perception
This section describes the object perception part in
the toolkit framework. The metrics of the programs
analyzed are passed to the object perception part,
and mapped to the haptic objects with appearance.
Haptic objects are displayed in the screen and
touched by using the arm of the haptic device. Two
types of tangible interface, active and passive
interface, are provided. As the active user interface,
object sounding, colouring, and vibrating are
introduced. As the passive user interface, automatic
arm chasing of the haptic device with program
execution is introduced.
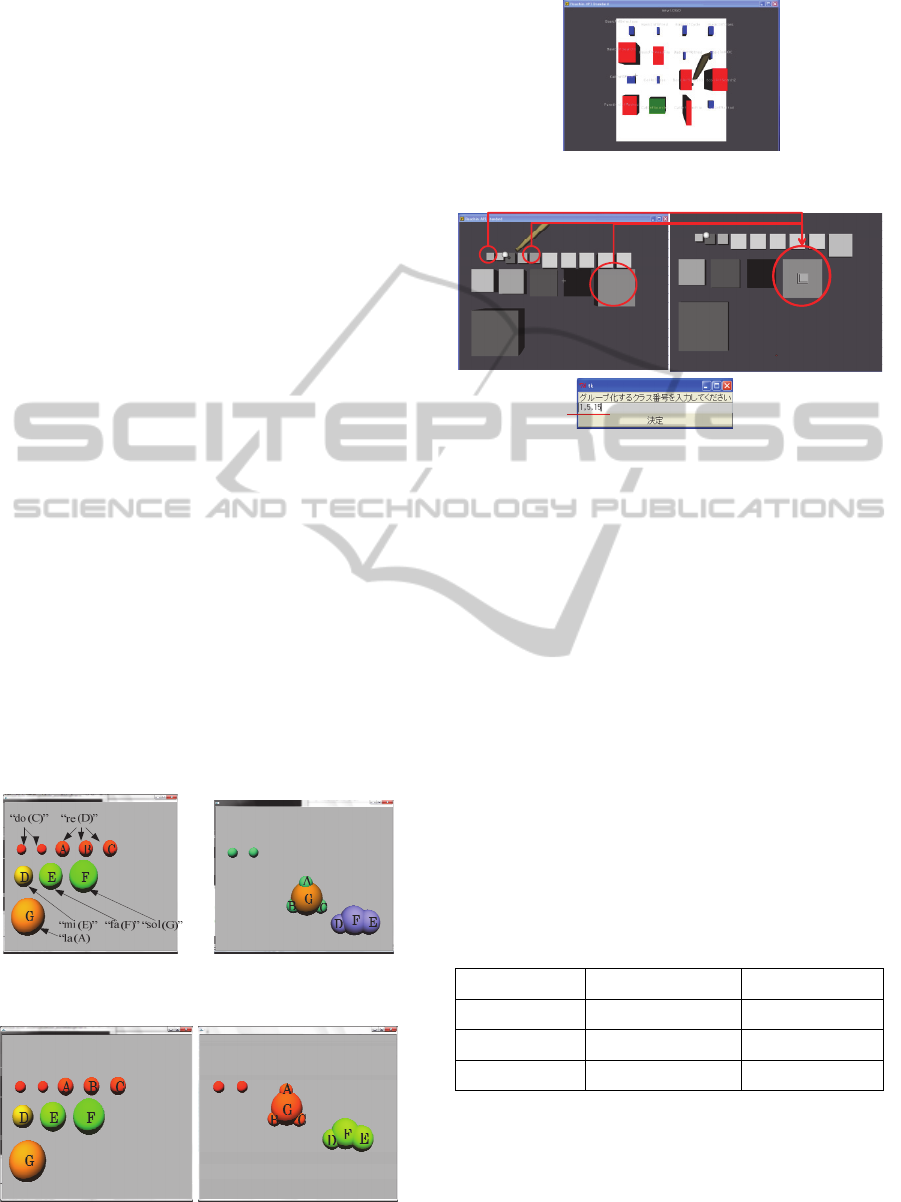
Figure 4 shows the example of the sound objects.
Touching and moving the objects, object A, B, C
and G are merged into one large object and the new
sound is assigned. In Figure 4(b), the sound ‘mi’ is
assigned, as the average sound of the objects merged.
The object can be given the colour. Figure 5(a)
indicates 9 objects, and each object is given the
colour. Touching and moving the objects, object A,
B, C and G are merged into one large object and the
colour ‘orange’ is assigned, as the average colour of
the objects merged.
Figure 6 shows an example of the vibrating
objects. It is based on the execution log of the
program. The execution of the program can be
recognized by vibrating and touching the objects.
Figure 7 shows the passive user interface. The
arm of the haptic device chases automatically with
the execution log of the program. Figure 7(b) shows
that the object 1, 5 and 15 are integrated into one
object.
(a) Sound Object (b) Sound Integration
Figure 4: Object sounding.
(a) Coloured Object (b) Colour Integration
Figure 5: Object colouring.
Figure 6: Object vibration.
12 3 4 5 6 7 8 9 10
11 12 13 14 15
16
(a) Arm Movement (b) Object Integration
Figure 7: Passive use interface.
3 HAPTICS OPERATION
EXAMINED
This section shows various haptic operations
performed for reengineering the program by using
tangible user interface. Table 1 shows the metrics
mapped to the object in this experiments. Two
metrics, metrics 1 and metrics 2, are used. The
metrics 1 is the number of lines per method, and the
metrics 2 is the number of methods per class (Lanza,
2006). The metrics 1 is used for decomposing the
program, and method 2 is used for measuring the
integration goodness of the program. In this section,
the left side of each Figures shows the program
structure of before the coupling, and the right side
shows the program structure of after the coupling.
Table 1: Metrics mapping example.
Metrics Sound Representation ColourRepresentation
# of classes # of objects # of objects
# of lines size of the object size of the object
# of lines/method sound of the object colour of the object
3.1 Sound Coupling
Figure 8 shows an example of sound coupling. Sixty
six sounds, ranging from 110Hz to 4693Hz, are
arranged, and the metrics 1 is mapped to the sound
of object. The objects which have high difference on
SoftwareReengineeringToolkitwithTangibleInterfacebyHaptics
353
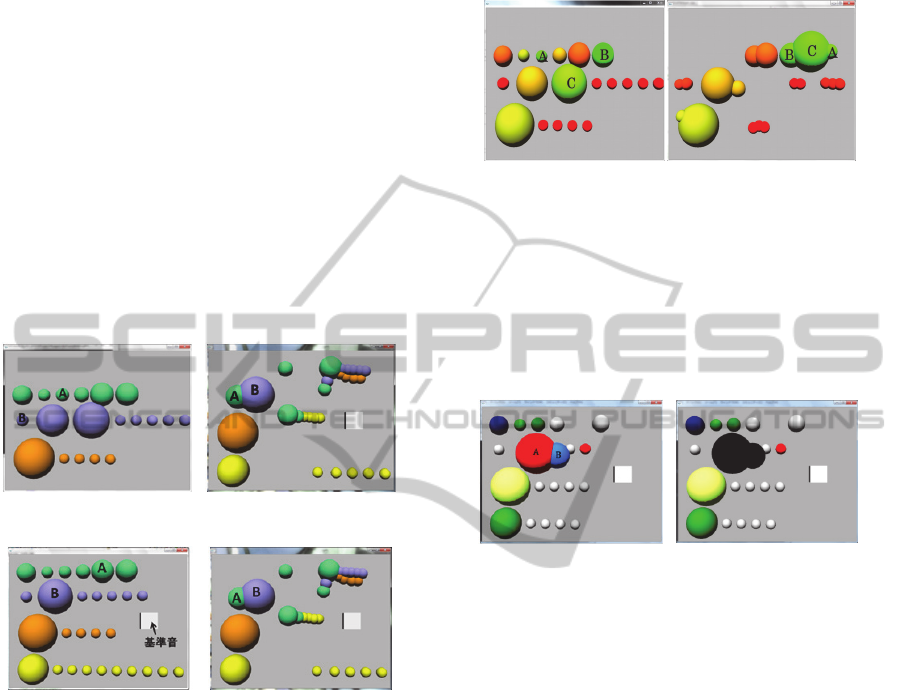
sound are coupled. In the example, object A, which
has the sound 293Hz, and object B, which has the
sound 123Hz, are coupled together into one object
AB, and the integrated sound became 165Hz. Figure
9 shows another example of sound coupling with
different coupling method. Several objects are
merged into one object to have the adequate object
sound after couplings. The adequate sound, whose
Hz is set to the average Hz of the whole objects, is
represented by the square in Figure 9. The sound of
the square object is preliminary settled, and user can
ascertain the sound of the object by hitting the
square object by haptic hand. Figure 9 shows the
object A ,whose sound is ‘so’ and its height is784Hz,
and the object B whose sound is ‘do’ and the height
is 1046Hz, are merged into the object AB, and the
sound ‘ra’ is assigned, and the height became
932Hz.
Figure 8: Example of sound coupling 1.
Figure 9: Example of sound coupling 2.
3.2 Colour Coupling
Figure 10 shows an example of colour coupling.
Sixty six colours, ranging from red to green, are
arranged. Metrics 1 is mapped to the colour of an
object. The experiments that couple the objects
which have similar colours are examined. In the left
of figure 10, the object A and B, both of which has
the colour green, and the object C which has the
colour yellow green, are merged, and produced the
object ABC coloured green.
3.3 Undo Coupling
Module should be in high cohesion and low
coupling. The execution log of the program, which
is the history of the objects executed, is collected.
The operation UNDO, which undoes the coupling
when the objects coupled have no access
relationship among them in the execution log, is
provided.
Figure 10: Example of colour coupling.
In the left figure of Figure 11, the object A and B
are coupled into one object. However, as the abject
A and B have no access relationship in the execution
log, its integration was denied by the toolkit, and the
colour of the coupled object changed to the black, as
is shown in the right figure of Figure 11. In this case,
the coupling operation must be undone.
Figure 11: Example of undone coupling.
4 METHODOLOGY
4.1 Coupling Schema
Several experiments were performed, and the
coupling schema was examined. Figure 12 shows
the coupling schema that the metrics must satisfy. A
dotted rectangle in the Figure 12 shows the
appropriate domain of the program, and it shows that
two metrics of the program are converging into the
rectangular. The right figure of Figure 12 is the
general schema. Two metrics, metrics 1(M1) and
metrics 2(M2), are adopted. M1 is the number of
methods in a class, and M2 is the lines of code in a
method [1]. The schema adapted for object
integration is as follows;
Operation1. First, decompose the program, and
map the metrics M1 to the object. The toolkit we
developed decomposes a class into smaller units of
module, and creates the corresponding objects. This
operation always decreases the value of M1, and it is
repeated until the M1’s value of the program
ICSOFT-EA2014-9thInternationalConferenceonSoftwareEngineeringandApplications
354

becomes lower than the lower bound predefined (see
the right figure of Figure12).
Operation2. Use the metrics M2 to integrate the
objects. The coupling operations provided should be
performed to lead the M2’s value to converge into
the dotted rectangular area.
Figure 12: Object integration schema.
4.2 Discussions
Reengineering programs using the toolkit by haptics
was examined. In the Appendix, the metrics of the
program experimented are depicted. The original
program was reorganized using several coupling
methods following the methodology described in
section 4.1, and the reorganized metrics were
collected.
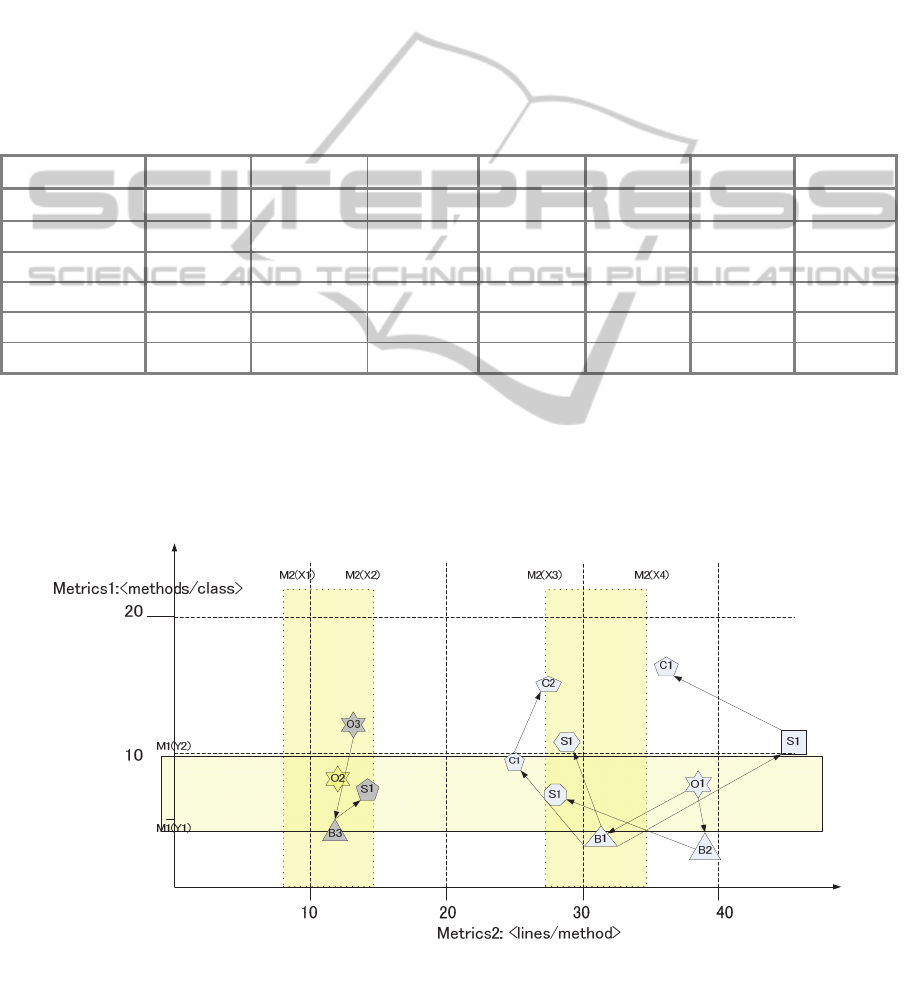
Table 2 shows five experimental results. The
transition of metrics 1 and 2 of the programs
followed by the coupling schema is shown in Figure
13. In Figure 13, the original program is denoted as
O1, and the succeeding reorganization of the
program is described as arrows. Three programs, O1,
O2 and O3, are reengineered. S stands for Sound,
and objects are integrated by sound coupling, C
stands for Colour, and objects are integrated by
colour coupling. M1(Y1) and M1(Y2) are the
boundaries of metrics 1, and the program had better
be in this boundary when reorganized. M2(X1) and
M2(X2) are the boundary of metrics 2; M2(X3) and
M2(X4) are the other boundary of metrics 2. These
boundaries are predefined and the integration of
objects was performed to be converged in these
boundaries.
Michele Lanza (Lanza, 2006) computed the
methods per class (M1) and the lines per method
(M2) by analyzing 45 java projects, and showed that
the average of M1 is 7 ranging from 4 to 10, and the
average of M2 is 10 ranging from 7 to 13. The
suitable metrics area of the program by the reference
(Lanza, 2006) is between M2(X1) and M2(X2) for
metrics 2 and between M1 (x 1) and M1 (x 2) for
metrics 1.
In Figure 13, it can be seen that the metrics M1
for the program O1 was decomposed, and changed
the metrics M1 to B1 and B2, and then changed to
C1 and S1 after integration. The program O3 is
decomposed, and changed to B3, and then integrated
to S1. If we follow the reference (Lanza, 2006), only
an object O2 had the appropriate metrics, and O3’s
reengineering was performed well, but O1’s
reengineering was not appropriate.
5 CONCLUSIONS
This paper described the software reengineering
toolkit with tangible user interface by using haptic
device. The system framework of the toolkit, the
program decomposition method and several
coupling methods of the objects are described. Two
types of the tangible user interface by haptics, the
active user interface and the passive user interface,
are introduced. Several object coupling methods are
described and discussed. The methodology of the
program integration by using haptic device is
proposed. Two metrics, methods per class and lines
per method, are adopted, and some experiments for
software program reengineering were performed.
The discussion of the results examined the
usefulness of the toolkit.
Software visualization is changing from 2D to
3D, and the user interface is changing from GUI to
TUI (Ishii, 1997). The interface devices with body
movement, and 3D visualization tools with more
sophisticated metaphor are emerging (Wettel, 2011).
This paper introduced the new tangible user
interface by using the haptic device, and examined
some experiments.
However, we need more efforts for practical use.
Shaping up the toolkit, and validating the
effectiveness of the toolkit with more experiments,
we are going to use the toolkit to the first
programming course to learn the style of the
program, and also be going to provide to the people
who is not familiar with the programming.
ACKNOWLEDGEMENTS
This study was partially supported by JSPS
KAKENHI Grant Number 24501142.
REFERENCES
Lanza, M., Marinescu, R., 2006. Object oriented metrics
in practice, New York.
SoftwareReengineeringToolkitwithTangibleInterfacebyHaptics
355
Briand, K. C., Daly, J. W., Wust, J. K., 1999. A Unified
Framework for Coupling Measurement in Object-
Oriented Systems, IEEE Transactions on Software
Engineering,Vol.25, No.1, January/February.
Btito e Abreu, F., et al., 2000. A Coupling-Guided Cluster
Analysis Approach to Reengineering the Modularity to
Object-Oriented Systems, CMMR2000.
Demeyer, S., Ducasse, S., Nierstrasz, O., 2000. Finding
refactorings via change metrics, OOPSLA ’00.
Demeyer, S., Ducasse, S., Nierstrasz, O., 2013. Object-
Oriented Reengineering Patterns, free download from
http://scg.unibe.ch/oorp/.
Wettel, R., Lanza, M., Robbes, R., 2011. Software System
as Cities: A Controlled Experiment, ICSE’11.
Greevy, O., Lanza, M., Wysseier, C., 2006. Visualizing
Live Software Systems in 3D, SoftVis 2006 , 3rd
International ACM Symposium on Software
Visualization.
Schach, S. R., 2007. From Modules to Object, in book,
Object-Oriented & Classical Software Engineering,
McGRAW-Hill International Edition,
Ishii, H. Ullmer, B., 1997. Tangible Bits: Towards
Seamless Interfaces between People, Bits and Atoms,
CHI 1997.
APPENDIX
Table 2: Metrics of the experiments.
Metrics Original Decomposed Integrated1
Integrated2 Integrated3 Integrated4 Integrated5
# of classes 10 19 7
11 8 5 5
# of fields 126 126 126
126 126 126 126
# of lines 2171 2186 2167
2175 2169 2153 2163
# of methods 76 76 76
76 76 76 76
lines/method 38.5 31.7 28.3
28.1 24.8 35.7 27.6
methods/class 7.6 4.0 10.9
6.9 9.5 15.2 15.2
*Original: The metrics of the original program. O1 in Figure 13.
Decomposed: The metrics of the decomposed program. Denoted by B1 in Figure 13.
Integrated1: Integrated by using ① and ② in Figure2. TUI is not used.
Integrated2: Integrated by sound coupling. TUI is used. The metrics of Figure 9. Denoted by S1 in Figure 13.
Integrated3: Integrated by colour coupling. TUI is used. The metrics of Figure 10. Denoted by C1 in Figure 13.
Integrated4: Integrated by sound and colour coupling. Sound coupling followed by colour coupling.
Integrated5: Integrated by two times of colour couplings. Denoted by C2 in Figure 13.
Figure 13: Metrics of the experiments.
ICSOFT-EA2014-9thInternationalConferenceonSoftwareEngineeringandApplications
356
