
Continuous Queries over Distributed Streams of Heterogeneous
Monitoring Data in Cloud Datacenters
Daniel Tovar
ˇ
n
´
ak and Tom
´
a
ˇ
s Pitner
Masaryk University, Faculty of Informatics, Botanick
´
a 68a, 60200 Brno, Czech Republic
Keywords:
Stream Processing, Distributed Architectures, Monitoring, Cloud.
Abstract:
The use of stream processing for state monitoring of distributed infrastructures has been advocated by some in
order to overcome the issues of traditional monitoring solutions when tasked with complex continuous queries.
However, in the domain of behavior monitoring the situation gets more complicated. It is mainly because of
the low-quality source of behavior-related monitoring information (natural language computer logs). Existing
approaches prevalently rely on indexing and real-time data-mining of the behavior-related data rather than on
using event/stream processing techniques and the many corresponding benefits. The goal of this paper is to
present a general notion of Distributed Event-Driven Monitoring Architecture that will enable an easy definition
of expressive continuous queries over many distributed and heterogeneous streams of behavior-related (and
state-related) monitoring data.
1 INTRODUCTION
Well-designed monitoring architecture poses a fun-
damental precondition for a successful and effective
operation of any large-scale distributed infrastructure.
Monitoring information is continuously used in a wide
spectrum of ways ranging from mission-critical jobs
such as accounting, audit tracking, incident handling,
job scheduling, provisioning and recovery to equally
important development-related tasks. These include,
but are not limited to: debugging, diagnosis, fault-
detection, performance analysis, and profiling. Cloud
monitoring especially is an interesting research chal-
lenge given the volume, velocity, and variability of the
monitoring data produced by modern datacenters and
the overall complexity of monitoring ecosystem.
When working with state-related monitoring data
(e.g. CPU load) the existing traditional solutions based
on batch processing are already approaching their lim-
its when tasked with complex continuous queries (e.g.
trends detection). In this case, researchers already
proposed the use of stream processing to some extent.
However, when processing/querying behavior-related
information (e.g. web server crash) the situation starts
to be more complicated. It is mainly because of the
nature of the produced monitoring data in the form of
natural language logs, its volume and variability, and
the characteristics of the cloud environment itself (e.g.
multi-tenancy, and elasticity). Existing approaches
nowadays primarily rely on indexing and real-time
data-mining of the behavior-related data rather than
on using event/stream processing techniques and the
many corresponding benefits.
The goal of this paper is to present a general notion
of Distributed Event-Driven Monitoring Architecture
that will allow for definition of expressive continuous
queries over many distributed behavior-related and
state-related monitoring data streams alike. We will
describe the key components of the architecture in de-
tail and discuss the design decisions and mechanisms
that need to be used in order to overcome the main
obstacles that hinder the implementation of cloud dat-
acenters behavior monitoring systems.
The rest of the paper is structured as follows: Sec-
tion 2 discusses the specifics of cloud behavior mon-
itoring. In Section 3 the related work is discussed.
Section 4 deals with the proposed monitoring architec-
ture itself. In Section 5 a prototypical implementation
of the architecture is presented. Section 6 concludes
the paper and discusses future work.
2 CLOUD DATACENTERS
BEHAVIOR MONITORING
When operating distributed computing environment
(such as cloud) it is crucial to be informed about the
470
Tovar
ˇ
nák D. and Pitner T..
Continuous Queries over Distributed Streams of Heterogeneous Monitoring Data in Cloud Datacenters.
DOI: 10.5220/0005095504700481
In Proceedings of the 9th International Conference on Software Engineering and Applications (ICSOFT-EA-2014), pages 470-481
ISBN: 978-989-758-036-9
Copyright
c
2014 SCITEPRESS (Science and Technology Publications, Lda.)

state and behavior of its respective constituents (com-
ponents). The data from these distributed components
(producing entities) need to be collected, analyzed,
correlated, and evaluated – a task we can simply re-
fer to as monitoring. Therefore,
MONITORING
is a
continuous and systematic collection, analysis, corre-
lation, and evaluation of data related to the state and
behavior of a monitored entity.
The definitions of state and behavior paraphrase
the original definitions given by (Mansouri-Samani,
1995):
STATE
of the monitored entity is a measure
of its behavior at a discrete point in time and it is
represented by a set of state variables contained within
a state vector.
BEHAVIOR
is an action or an internal
state change of the monitored entity represented by a
corresponding event.
2.1 State vs. Behavior Monitoring
Our research is particularly aimed at behavior monitor-
ing, i.e. collection and analysis of data related to the
actions and changes of state of the monitored entities
(e.g. web service crash, and repeated login attempt)
as opposed to the monitoring of measurable state (e.g.
CPU load). The purpose of state monitoring is to de-
termine whether the state of some entity deviates from
normal. The goal of behavior monitoring, on the other
hand, is to detect behavior deviations.
For example, state monitoring often focuses on de-
tecting simple threshold violations, e.g. the monitored
cluster’s current load is above 80%. In contrast, behav-
ior monitoring aims at detection of (known) patterns
of behavior, e.g. detection of multiple unsuccessful
login attempts in a certain time-frame, or detection
of an unusual network traffic volume. Note, that the
state-related monitoring data can be used for behavior
monitoring (e.g. for anomaly detection), and in turn,
behavior-related monitoring data can be used for state
monitoring (e.g. for computation of requests/s metric
from Apache httpd logs). Whatever the case, both the
state and behavior-related monitoring data should be
supported by the monitoring system in order to enable
state-behavior correlations. This is the reason why
we aim to process/query both the behavior-related and
state-related monitoring data alike. To succeed in this
task we employ a simple abstraction – both the state
and behavior-related monitoring data take the form
of events, i.e. they have defined type and this type
imposes the event’s data schema.
2.2 Cloud Datacenters Monitoring
Based on the work of Cloud Security Alliance
(Brunette and Mogull, 2009) Spring in his work
(Spring, 2011) presented a simple layered model parti-
tioning cloud infrastructure into seven layers that must
be monitored in order to facilitate overall cloud secu-
rity. For the sake of clarity we extended the model
with one additional layer (Virtualization).
The model should help to illustrate the immense
variability and volume of the monitoring data produced
by the modern datacenters. From the monitoring stand-
point we perceive the respective layers (ordered from
bottom up) as follows:
Facility:
can be simply described as the area (building)
that physically contains the hardware and equipment
of data center. Facility monitoring is generally related
to the environmental conditions (e.g. temperature, hu-
midity, and physical security) of the critical areas and
the state of related equipment (e.g. power supply, AC).
Network:
(possibly virtualized) forms the distributed
environment by interconnecting the computing re-
sources both inside the data center as well as across
multiple data centers. Network monitoring is con-
cerned with the performance, security and health of
the computer network using data collected from fire-
walls, routers, switches and other network devices.
Hardware:
layer represents the computing power in
the form of physical computer system. Hardware mon-
itoring per se relates to the state of the computer sys-
tem components (e.g. CPU Temperature, Voltages,
and Fan speed). However, the majority of hardware
resources (e.g. CPU and Memory utilization) and com-
ponents (e.g. HDD S.M.A.R.T data) is monitored via
the means of upper layers.
Virtualization:
layer is responsible for hardware vir-
tualization to enable physical resource sharing. The
virtualization is achieved via hypervisor that can be
running either on the top of host operating system or
directly on the physical hardware (i.e. bare-metal hy-
pervisor). Virtualization layer is specific since it can
be a gateway for monitoring both the physical and
virtualized hardware (i.e. virtual machines). The mon-
itoring of virtualization layer itself generally differs
little from the operating system monitoring.
Operating System:
is a software that serves as an
intermediary between (virtualized) hardware and pro-
grams. Apart from monitoring (virtualized) hardware
resources, operating system monitoring focuses on the
state and behavior of its components and modules (e.g.
I/O subsystem, process scheduler, and memory man-
agement).
Middleware:
(e.g. application server, and message
broker) is ”a software layer between operating plat-
form and application that enables the interaction of
ContinuousQueriesoverDistributedStreamsofHeterogeneousMonitoringDatainCloudDatacenters
471

potentially distributed application components, reach-
ing a certain degree of transparency and independence
from the surrounding runtime environments” (Rackl,
2001). Being a software application itself, middleware
monitoring do not differ much from the application
monitoring discussed below.
Application:
monitoring is focused on the domain-
specific behavior and state of targeted software appli-
cation (e.g. web app deployed on application server,
and SQL database). It is specific (together with middle-
ware and user interaction) since the related monitoring
data can be potentially produced by many distributed
producers spread across the computing nodes.
User:
is represented by human or software agent from
the outside of cloud environment (e.g. web browser).
The monitoring is focused on the interactions realized
by the users on lower layers. User monitoring has
a wide portfolio of uses – e.g. security monitoring,
business activity monitoring, and website interaction
monitoring.
2.3 Monitoring System Design
Considerations
Here we provide a list of basic non-functional require-
ments that, (not only) from our point of view, should
be considered while making decisions when design-
ing monitoring system and its architecture. When not
stated otherwise, the definitions are either of our own,
or they are paraphrased from the general software qual-
ity standard ISO 25010 (ISO/IEC 25010:2011, 2011).
We do not claim that the provided list is complete
nor it is an attempt to define a general set of require-
ments for monitoring system. The requirements aim
to establish basic terminology used in this paper
and should also help to illustrate the number and
complexity of the design decisions one must make in
order to create a working monitoring system.
• Accuracy:
refers to the difference between the
actual state of monitored entity and the state known
to the monitoring system.
• Elasticity:
degree to which a monitoring system is
able to cope with changing and dynamic infrastruc-
ture in order to correctly monitor resources created
and destroyed by expanding and contracting net-
works (Clayman et al., 2010).
• Interoperability:
degree to which a monitoring
system uses communication protocols and data for-
mats that allow for an easy exchange of monitoring
data and their consequent use.
• Intrusiveness:
the magnitude of effects induced
on the monitored entity’s operation and resources
by the monitoring process (Mansouri-Samani,
1995). In other words, an amount of computing re-
sources utilized by the programmatic components
that facilitate the monitoring process.
• Latency:
time-difference between the occurrence
of a monitoring event and its detection, processing,
or evaluation by the monitoring system.
• Maintainability:
degree to which a monitoring
system is extensible and changeable with respect
to supported monitored resources as well as used
monitoring data types.
• Network Overhead:
the magnitude of effects in-
duced on the computer network (Mansouri-Samani,
1995) by the collection of the monitoring data with
respect to its volume and velocity.
• Performance:
degree to which a monitoring sys-
tem performs satisfactorily in all the phases of
monitoring process with respect to the overall
throughput, latency, and processing speed.
• Reliability:
degree to which a monitoring system
or its component is able to perform its required
functions under stated conditions for a specified
period of time (e.g. data transfer reliability).
• Scalability:
degree to which a monitoring system
is able to cope with: increasing volume, variety,
and velocity of generated data; increasing number
of agents that generate the data; growing number
of producers (e.g. virtual machine instances), and
also in turn growing number of consumers.
• Security:
degree to which a monitoring system is
able to ensure data privacy and integrity in order
to be able to facilitate both preventive and detec-
tive security controls, e.g. for accountability and
auditability purposes.
• Time-behavior:
degree to which a monitoring sys-
tem is able to cope with time synchronization and
message ordering.
2.4 Processing/Querying of
Behavior-related Monitoring Data
The key issues in the domain of cloud behavior moni-
toring are mainly result of a poor quality of behavior-
related monitoring data as well as missing functionality
of entities that generate and produce the monitoring
data (in cloud datacenters the primary producing enti-
ties of monitoring data are usually virtual machines).
Bellow, we list several factors that, from our perspec-
tive, prevent datacenters’ users from defining continu-
ous queries over produced monitoring data in order to
facilitate behavior monitoring.
Low-grade Behavior-related Data:
State-related
monitoring data are usually directly generated in the
form of metrics suitable for automated processing and
ICSOFT-EA2014-9thInternationalConferenceonSoftwareEngineeringandApplications
472

there are many existing tools available. They can also
take the form of events easily. However, behavior-
related monitoring data are not so directly obtainable.
Usually, the only mechanism for gaining visibility into
the behavior of monitored entities are computer logs
(system logs, console logs, or simply logs) (Oliner and
Stearley, 2007). They are generated in an inconsistent
manner, lack semantics and structure, and use natural
language messages that cannot be directly processed.
Therefore, there is a need for post-processing and pat-
tern matching to facilitate log abstraction which can
be difficult, given the volume and variability of the
produced monitoring data. Log abstraction is the sep-
aration of static and dynamic part of the log message
in natural language (Nagappan and Vouk, 2010). The
static part is referred to as the type of the message,
whilst the dynamic part is represented by a set of vari-
ables. For example, log message
User xtovarn logged in
would be abstracted into {type=login, user=xtovarn}.
Log abstraction is a way to turn natural language
logs into events. Not from the point of view of se-
mantics, but from the point of view of syntax. As per
definition by (Etzion and Niblett, 2010), event is an
occurrence within a particular system or domain; it
is something that has happened, or is contemplated
as having happened in that domain. The word event
is also used to refer to a properly structured program-
ming entity that represents such an occurrence in a
computing system.
Volume, Variability, Velocity:
The previous sec-
tion illustrated the immense variability of monitor-
ing data produced by cloud datacenters. Moreover,
as reported in (Boulon et al., 2008) a two-thousand
node Hadoop cluster configured for normal operation
can generate around 20 gigabytes of application-level
(behavior-related) monitoring data per hour. However,
there are reports of peak monitoring data rates up to 1
megabyte per second per node (Cre
t¸
u-Cioc
ˆ
arlie et al.,
2008). In addition, the produced monitoring data can
be filtered only to a limited extent since without pre-
processing (parsing) there is only a limited informa-
tion available based on which the data can be filtered.
Therefore, mechanisms that allow for selective collec-
tion of monitoring data (e.g. publish-subscribe) cannot
be directly used. Such volumes of highly variable
data must be processed using distributed architectures
which are not easy to design and implement.
No Support for Multi-tenancy:
Multi-tenancy
is a degree to which a monitoring system is able to
achieve: concurrency, i.e. multiple consumers are
able to access identical monitoring information simul-
taneously; isolation, i.e. tenants are not able to ac-
cess monitoring information that is not addressed to
them; integrity – once generated, nobody can modify
or delete a particular piece of monitoring information;
proof of origin – the origin of generated monitoring
information is non-repudiable, i.e. the monitoring in-
formation cannot be counterfeited. For example, in the
case of a Platform-as-a-Service model the access to the
monitoring data from middleware layer is extremely
limited for the cloud user (as opposed to the cloud
provider) (Tovar
ˇ
n
´
ak and Pitner, 2012).
3 RELATED WORK
There is a large collection of works related to mon-
itoring of distributed infrastructures. This overview
focuses in detail only on works that to some extent
deal with the issues discussed in the previous section.
We do not focus on traditional infrastructure monitor-
ing tools and architectures such as Nagios
1
, Ganglia
(Massie et al., 2004), and OpenNMS
2
. For throughout
surveys of the existing works and tools see (Zanikolas
and Sakellariou, 2005) for grid monitoring, and (Aceto
et al., 2013) for cloud monitoring.
(De Chaves et al., 2011) introduced private cloud
state monitoring system (PCMONS) based on the in-
tegration of existing monitoring tools (e.g. Nagios).
The design of the architecture is quite general and
rather straightforward and it is not thoroughly dis-
cussed. Interestingly, the authors suggest that in the
case of private clouds multi-tenant monitoring is not
much relevant. We argue that it is on the contrary, even
in relatively small scale deployments there is need for
multiple concurrent consumers support as well as mon-
itoring data privacy and integrity for accountability and
auditability purposes. Hence, we agree with others and
consider multi-tenancy to be important functional re-
quirement for monitoring system deployed in cloud
datacenter, regardless its size.
(Hasselmeyer and d’Heureuse, 2010) study an ap-
proach towards holistic (in the terms of monitoring
information and in the terms of tenants) state monitor-
ing system for cloud datacenters that aims to be multi-
tenant, scalable, dynamic, simple, and comprehen-
sive. The authors present functional building blocks as
well as related data format utilizing XML. The agent-
based architecture introduces a central message bus
connected to filtering and aggregation engine. The
agents as well as possibly multiple consumers are con-
nected to the message bus via adapters following data
normalization pattern.
(Lu et al., 2012) propose a monitoring architecture
to ”deal with the flexibility, scalability, and efficiency
1
http://www.nagios.org
2
http://www.opennms.org
ContinuousQueriesoverDistributedStreamsofHeterogeneousMonitoringDatainCloudDatacenters
473

challenges of cloud monitoring”. Even though a gen-
eral monitoring architecture using Complex Event
Processing (CEP) component is proposed (with very
little detail), the work itself focuses entirely on effi-
cient monitoring data distribution. The authors pro-
pose a topic-based dissemination framework based
on Data Distribution Service (DDS) (Object Manage-
ment Group, 2007), an OMG’s standard for publish-
subscribe systems. We argue that the used topic struc-
ture, with 4 topics based the on monitoring data types
(e.g. status updates, and event reports), is very coarse-
grained. The publish-subscribe architecture is in fact
used only for simple aggregation, not employing its
full capabilities (especially multi-tenancy).
(Balis et al., 2011) proposed a monitoring architec-
ture utilizing Complex Event Processing and evaluated
its use for online grid monitoring. The authors achieve
data reduction to minimize network overhead by using
aggregating queries and in addition basic distributed
query processing deployment. In such deployment
the complex queries are decomposed into sub-queries
and forwarded to CEP engines deployed as close to
event sources as possible, even at the level of pro-
ducers on the monitored nodes. The authors further
discuss their approach for distributed query processing
in (Balis et al., 2012). The capabilities of the proposed
monitoring architecture were demonstrated on several
dynamic resource allocation use cases (e.g. dynamic
load balancing and job reconfiguration). We argue
that even in low velocity (400 events/s) scenarios the
CPU overhead imposed on the monitored nodes was
very high (˜10-30%), also when considering that the
architecture was used solely for state monitoring.
The authors of (Teixeira et al., 2010) describe ar-
chitecture of HOLMES, state monitoring system using
CEP. The system architecture centers around publish-
subscribe (topic-based) message broker serving as a
simple message bus. Nagios is used as the main pro-
ducer of low level state-related data. The Esper CEP
engine is then utilized to evaluate continuous queries
provided by users. The most interesting part of the ar-
chitecture is a machine learning module using an unsu-
pervised streaming algorithm for an anomaly detection.
CEP queries can be used to join multiple streams in or-
der to produce appropriate input vector needed for the
algorithm. The rest of the paper presents visualization
and user interface, and two use cases.
(Narayanan et al., 2011) presented integrated mon-
itoring and management framework based on Com-
plex Event Processing, yet the authors provide only
scarce details about the framework design itself. The
work rather discusses construction and examples of
Complex Event Processing queries for Cayuga
3
CEP
3
http://www.cs.cornell.edu/bigreddata/cayuga/
engine to combine monitoring information produced
by different monitoring sources (e.g. applications, and
network) in a meaningful way.
Many monitoring applications require huge
amounts of monitoring data to be delivered in real-
time in order to be used for online processing and
evaluation. The minimization of the macro-level la-
tency (minutes) is one of the main reasons for the
use of stream processing instead of batch processing.
Several works demonstrate that leveraging stream pro-
cessing for monitoring affords similar benefits as in the
case of its other applications, e.g. financial services.
Exposing the state-related monitoring data as contin-
uous streams allows them to be efficiently accessed
in real-time. Stream processing mechanisms enable
on-demand definition of advanced queries for the com-
putation of derived monitoring metrics, for example
aggregations over sliding windows, joining of multiple
streams, and detecting event patterns and correlations.
However, the presented works that utilize stream pro-
cessing have one important downside in common –
they focus primarily on state-related monitoring data.
To the best of our knowledge, the works related
to processing/querying of behavior-related monitor-
ing data do not consider working with streams of ab-
stracted logs. The first group of approaches such as
Splunk
4
and Elasticsearch
5
rely on elaborate stream
indexing and data-mining allowing for the data to be
queried later. From our point of view, this is still not
enough since the most important information is still
hidden in the natural language log messages (even if it
is indexed for search). The second group of approaches
focuses on collection and arbitrary distributed batch
processing of the monitoring data (with the cost of
high latency and limited query expressiveness).
In (Rabkin and Katz, 2010) the authors introduce
Chukwa, a system for large-scale log collection and
storage built atop Hadoop
6
Distributed File System
and MapReduce programming model. Agents de-
ployed on the nodes forward the raw traditional logs
to collectors which aggregate the collected data into
large chunks more suitable for HDFS. Once stored in
HDFS the data can be processed by MapReduce jobs.
Such solution allow for high-throughput distributed
batch processing (yet we would not call it offline per
se) using MapReduce programming model. However,
it is suitable only when latency (approx. 5 minutes) is
not of concern.
Kafka (Kreps et al., 2011) is a distributed mes-
saging system for collecting high volumes of (log)
data and distributing it with very low latency. Kafka
4
http://www.splunk.com/
5
http://www.elasticsearch.org/
6
http://hadoop.apache.org/
ICSOFT-EA2014-9thInternationalConferenceonSoftwareEngineeringandApplications
474
is a topic-based publish-subscribe system using de-
centralized brokers. The system inherently supports
concurrent tenants and introduces the notion of con-
sumer groups, i.e. consumers that jointly consume a
set of subscribed topics. The subscribed messages are
evenly segmented across the consumer group allowing
for parallel consumption/processing.
4 DISTRIBUTED EVENT-DRIVEN
MONITORING
ARCHITECTURE
To tackle the issues discussed in the previous two
sections we propose the notion of Distributed Event-
Driven Monitoring Architecture. The goal of the ar-
chitecture is simple – allow for an easy definition of
expressive continuous queries over many distributed
heterogeneous streams of behavior-related and state-
related monitoring data. We refer to the architecture as
to being event-driven since as the arbitrary monitoring
data pass through the architecture, they are normal-
ized into the streams of events in order to be easily
queryable. Note, that the state-related data can be
easily converted into events, for behavior-related data
log abstraction must be utilized. The architecture is
designed in a way that its individual components can
be easily distributed and replicated in order to achieve
desired levels of scalability and reliability.
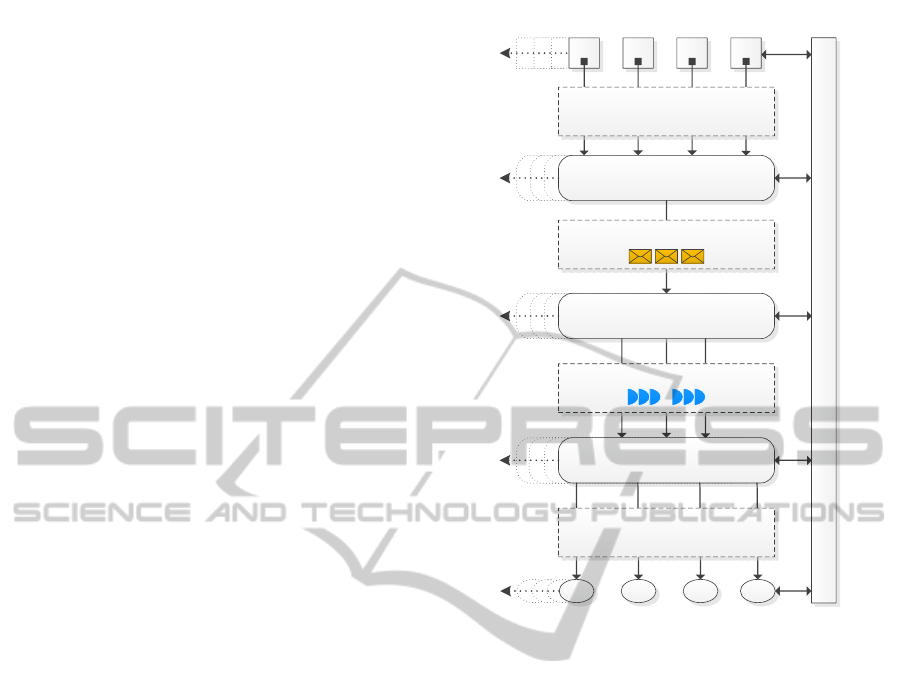
As can be seen on 1 the architecture consists of
five main components, four data exchanges, and stan-
dalone configuration component. Since we treat the
architecture as a general concept, we first describe the
main building blocks and then discuss our specific pro-
totypical implementation (Section 5). The used tech-
nologies and tools presented in this paper are therefore
not mandatory for the architecture to be successfully
implemented as long as the implementation follows
the proposed general concepts.
4.1 Producing Entities and Agents
Producing entity is a computer system (or device) hav-
ing raw monitoring data generated within its bound-
aries based on the system’s operation. The literature
sometimes recognizes agent-based and agent-less mon-
itoring depending on whether or not the monitoring
data are generated using specialized programmatic
component (agent) that is a part of the monitored en-
tity. However, one can argue that there is no such thing
as an agent-less monitoring since there is always some
programmatic component involved that allows for the
data generation.
Producing Entities
Consuming Entities
Event Processing Sys.
Delivery System
Monitoring Bus
Derived Monitoring Data Streams
∑ ∑ ∑ ∑
Virtual Monitoring Data Streams
Raw Monitoring Data
72 6F 6E 6F 4D
Normalized Monitoring Data
Control and Configuration
A A A A
A
L
E
S
C
Figure 1: General Architecture Overview.
For example, SNMP-based monitoring is often re-
ferred to as agent-less, yet the standard itself specifies
the role of an SNMP agent component. Therefore, we
always consider the raw monitoring data to be gener-
ated by some monitoring agent that is a part of the pro-
ducing entity. We refer to the counterpart of the agent
(client) as to the agent-manager (server). In cloud dat-
acenters the common producing entities include, but
are not limited to: networking devices, firewalls, intru-
sion detection systems, physical machines, and most
importantly, virtual machines.
The configuration of the individual agents (or the
corresponding agent-managers) strongly influences the
accuracy, intrusiveness, and network overhead of the
state monitoring. Typically, the raw monitoring data
related to state are either pulled by the agent-manager
(i.e. generated by the agents on demand) periodically,
or generated automatically, again in defined periodic
intervals, and pushed to the agent-manager. The con-
sequences are rather straightforward – the longer the
periodic update interval, the lower the accuracy is. At
the same time, however, this means lower overhead
imposed on the network, and less intrusiveness (less
work) of the agent on the producing entity. This natu-
rally applies vice-versa.
ContinuousQueriesoverDistributedStreamsofHeterogeneousMonitoringDatainCloudDatacenters
475

In general, the more work is performed by the mon-
itoring agents within the boundaries of the producing
entity, the less work is needed to be performed by the
agent-managers, and vice-versa. The actual workload
distribution influences either the intrusiveness of the
agents, or the overall performance of the monitoring
bus (discussed below) since it is composed of agent-
managers in the form of the adapters. This must be
kept in mind, since the number of producing entities
and the volume of the generated monitoring data are
the main variables the whole monitoring system must
scale to.
4.2 Raw Monitoring Data Exchange
Once the raw monitoring data are generated they must
be transfered past the first data exchange to be ac-
tually useful. In general terms, communication and
subsequent data transfer between two parties can be
initiated both by data producer (i.e. push model) and
data consumer (i.e. pull model). In the pull model the
monitoring data are (usually periodically) requested
by consumer from producer. On the other hand, in the
push model the data are transferred to consumer as
soon as they are generated and ready to be sent.
Nowadays, the monitoring agents use variety of
protocols (both push and pull-based) and data for-
mats (text, binary) to communicate with their agent-
managers. They range from fully standardized (eg.
SNMP, and Syslog) to highly proprietary (e.g. col-
lectd, Nagios). Note, that currently used agents, their
protocols, and corresponding data formats vary greatly
throughout datacenters. That is also one of the reasons
for introducing the notion of a component we refer to
as monitoring bus.
4.3 Monitoring Bus
To facilitate the abstraction of raw monitoring data
into events and also to overcome other interoperabil-
ity and data format-related issues in the monitoring
domain, monitoring bus is the key concept to be used.
Simply put, monitoring bus is a collection of input and
output adapters, transformation mechanisms, and nor-
malization logic that allows for an interoperability of
various communication and monitoring protocols and
data formats. Its key role is to serve as a gateway that
is able to ingress raw data from vast variety of moni-
toring agents, parse them, filter them, normalize them,
transform them, and pass them along as continuous
streams of monitoring data in the form of events using
protocols and data formats of choice. The complexity
of individual tasks performed by the monitoring bus
can range from relatively low (e.g. conversion from
JSON to XML-based monitoring data) to very high
(e.g. parsing natural language logs to facilitate log
abstraction, and using adaptive push-and-pull proto-
cols for metric/state readings). The more input and
output adapters are supported by the bus, the better
for the overall interoperability. However note, that the
monitoring data normalization negatively influences
the performance, and in turn latency, of the monitor-
ing system as a whole. The monitoring bus must not
perform any correlation tasks in order to be easily
replicable (for reliability reasons) and distributable
(for scalability reasons).
4.4 Normalized Monitoring Data
Exchange
The variety of protocols and data formats used for com-
munication on the egress side of the monitoring bus
depends on the number of supported (implemented)
adapters, and transformation filters. The benefits for
interoperability when supporting many different data
formats are most apparent when using protocols that
can serve as an envelope for arbitrary text, or binary
data (e.g. AMQP). We refer to the data passing through
the second exchange as to normalized monitoring data,
i.e. they can be processed ‘as-is‘ without the need for
any additional transformation on the consumer side.
The normalized data have the form of events with de-
fined type, schema and producing entity they relate
to. This in effect allows for seamless shipment of
the normalized data into the delivery system as well
as it enables communication with wide portfolio of
secondary external systems such as long-term data-
stores (e.g. MongoDB), and visualization tools (e.g.
Graphite).
4.5 Delivery System
The delivery system is responsible for fast, reliable,
and scalable delivery of the normalized monitoring
data and usually takes the form of a messaging system.
The messaging system must support publish-subscribe
mechanisms that are able to distinguish between events
related to the different producing entities and their
groups. Principles and internal workings of such sys-
tems are well covered in literature and there are many
implementations (both commercial and open-source)
available. In addition to that, several standardization
efforts are in process. Please note, that although the
delivery system could theoretically be part of the mon-
itoring bus, the separated design allows for looser cou-
pling of the architecture as a whole. It also enables
easier distribution, replication, and clustering of the
ICSOFT-EA2014-9thInternationalConferenceonSoftwareEngineeringandApplications
476

delivery system nodes to achieve the desired levels of
scalability, performance, and reliability.
4.6 Virtual Monitoring Data Streams
Exchange
The notion of virtual monitoring data streams is an-
other key concept of the architecture and, in a way, one
of its main goals. It allows the consumers to access
the individual normalized monitoring data streams (in
the form of events) related to the particular producing
entities in a transparent way, i.e. as if the consumers
were directly communicating with the entities. The
consumers use publish-subscribe interaction pattern
for communication with the delivery system. When
the consumer subscribes for a particular subset of mon-
itoring data the virtual stream is then materialized.
Please note, that the characteristics of the exchange
are tied to the underlying delivery system and in turn
its communication protocol. In its basic form the
third data exchange enables access to monitoring data
streams of the individual producing entities as well as
their groups. Note, that the more capable the delivery
system is the more fine-grained virtual monitoring data
streams and their combinations can be created (e.g. by
using content-based matching). In order to achieve in-
teroperability of the architecture as a whole one must
carefully choose the protocols and formats both for the
virtual monitoring data streams exchange and derived
monitoring data streams exchange (see below).
4.7 Event/Stream Processing System
At this stage in the architecture, multiple consumers
are able to ingress normalized monitoring data from
arbitrary combination of materialized data streams. To
fulfill the goals of the architecture the main consumer
is in our case an event processing system (EPS). EPS
is able to evaluate continuous queries over the mon-
itoring data, perform correlations, aggregations and
many other complex operations. The expressiveness
of the queries depends on the capabilities of the EPS.
In our architecture we work with traditional stream
processing model, i.e. the result of a continuous query
over stream is again a stream. As a result, the deliv-
ery of the resulting derived monitoring data must be
taken into consideration. From scalability perspective,
the loosely coupled delivery system and the notion of
virtual monitoring data streams are a perfect founda-
tion for distributed stream processing – as long as the
delivery system is able to scale.
4.8 Derived Monitoring Data Streams
Exchange
We refer to the streaming data passing through the
last exchange as to derived monitoring data since they
are a product of continuous queries possibly combin-
ing many virtual data streams and processing opera-
tors. The characteristics of the derived monitoring data
streams exchange are the direct result of the used EPS.
To the best of our knowledge, there are no existing
communication protocols, that can be used for this
last exchange, i.e. to instrument the EPS to compute
specific continuous queries over specific (materialized)
virtual monitoring data streams. Our vision is a spe-
cialized protocol based on a combination of publish-
subscribe functionality and event processing language.
Similarly to the virtual monitoring data streams ex-
change, the derived monitoring data streams exchange
must support multiple tenants (consumers).
4.9 Consuming Entities
Consuming entity is any end computer system, that is
able to ingress the derived monitoring data (i.e. the
result of the continuous queries), evaluate them (or
visualize them), and eventually perform an automated
reaction. For example, the consuming entity can be a
combination of a visualization component and event-
condition-action system.
4.10 Control & Configuration
Component
The control & configuration component is a prerequi-
site for a successful day-to-day operation of any sys-
tem in the environment of distributed datacenters and
has its place in our architecture. The control & config-
uration component serves as a proxy that glues all the
other parts of the architecture together (configuration-
wise). Properly working control & configuration com-
ponent is a prerequisite for elasticity of the solution as
a whole.
5 PROTOTYPICAL
IMPLEMENTATION
Section 2 depicts the overview of prototypical imple-
mentation of the proposed Distributed Event-Driven
Monitoring Architecture. As it is with all prototypes
also this one is not perfect, the current version is aimed
solely on event/stream processing, therefore it does not
use any kind of long-term storage for drill-down and
ContinuousQueriesoverDistributedStreamsofHeterogeneousMonitoringDatainCloudDatacenters
477
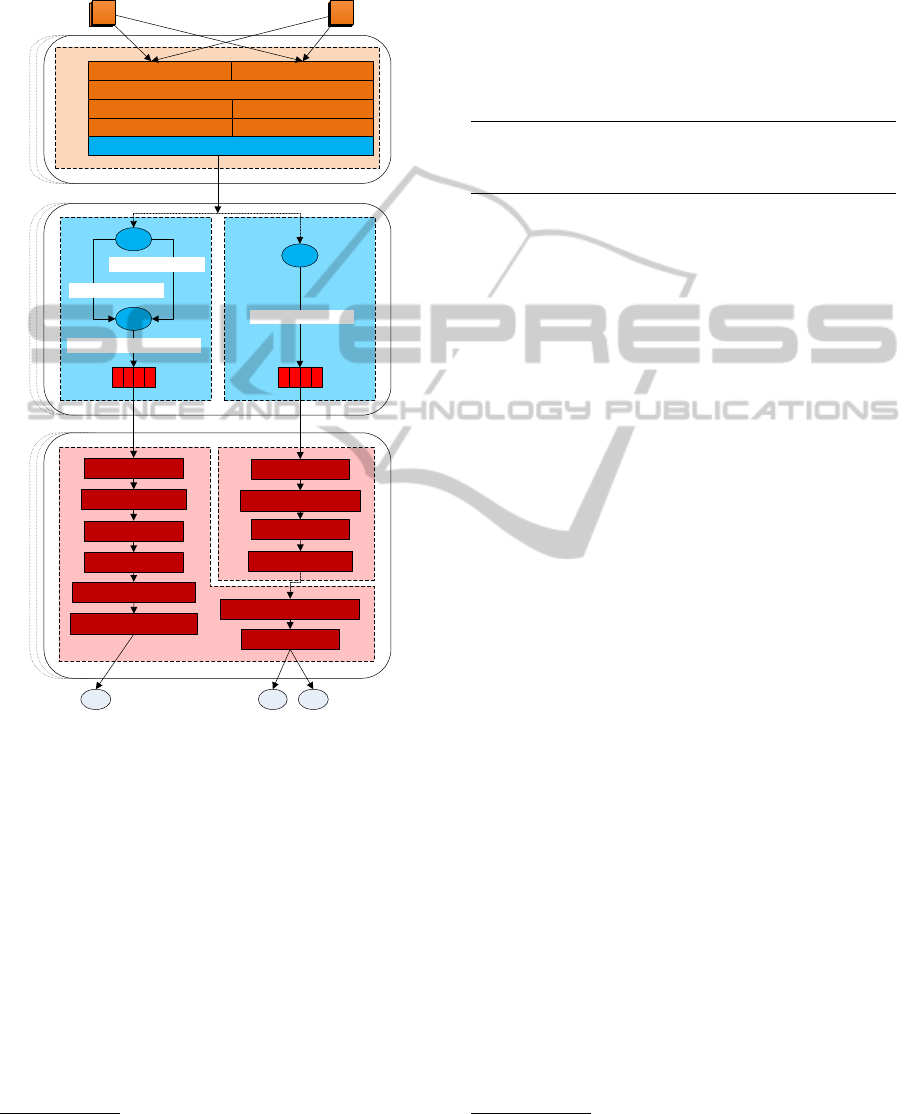
post-mortem analysis, and it is configured only stati-
cally. The components bounded by dashed lines can
reside on individual distributed nodes.
SEAL
SEAL
Virtual Mon. Data Streams
Derived Monitoring Data
Streams
window:tu(1min)
subscr(Q1)
window:tu(9min)
filter(e.avg>0.87)
subscr(Q2)
proj(e.LOAD.midterm)
group_by(e.entity)
agg:avg(e.LOAD.midterm)
agg:count
filter(e.max>3*e.avg)
window:sl(20min)
agg:max+avg(e.count)
Embus
RSyslog Adapter (IA)collectd Adapter (IA)
Filter
AMQP Adapter (OA)
Raw Monitoring Data
Normalized Monitoring Data
RabbitMQ
X1
ip-147-251-50-15.#
ip-147-251-50-16.#
G1
*.sshd.PASSWORD_FAILED
RabbitMQ
*.collectd.load.LOAD
X1
Q2Q1
VMVM
C CC
Monitoring BusDelivery SystemEvent Processing System
AttributeMapper
AttributeMapper
PatternMatcher
Projection
Figure 2: Prototypical implementation of DEDMA.
5.1 Producing Entities & Raw
Monitoring Data Exchange
The prototype is focused on monitoring linux-based
physical and virtual machines. There is a vast amount
of existing monitoring agents which can be roughly
divided into two simple categories: log shippers (for
behavior monitoring), and metric collectors (for state
monitoring). In order to keep the overhead as low
as possible, the monitored machines are running two
lightweight agents – collectd
7
, and RSyslog
8
. collectd
is a UNIX-daemon used for collecting state-related
monitoring data and transferring them over network.
7
http://http://collectd.org/
8
http://www.rsyslog.com/
RSyslog is a utility for UNIX-like systems used for
computer log collection and forwarding. Note, that
there are many existing agents providing more or less
the same functionality, e.g. Nagios, Ganglia, logtail,
and syslog-ng. Both agents use push-based interaction
over TCP layer. Syslog protocol is standardized and
described in (Gerhards, 2009), collectd uses propri-
etary binary protocol.
2014 -02 -01 T08 :26 : 2 8.000 + 000 Z 1 4 7.2 5 1 .50 . 15 \
Fail e d pass w o rd f o r x t ovarn from 1 47.2 5 1.42 . 49 \
port 41853 s s h 2
Listing 1: Syslog-based natural language log.
5.2 Monitoring Bus
In the first versions of our prototype the monitoring
bus component consisted of a pair of individual tools
connected via message broker. On the ingress side,
Logstash
9
was used for the raw monitoring data nor-
malization (mainly because of the variety of its input
and output adapters); for the pattern matching and
abstraction of computer logs, Gomatch
10
was used
as our first attempt to implement a fast multi-pattern
matching algorithm.
Mainly due to performance and scalability reasons
we decided to implement a standalone monitoring bus
component that we refer to as Embus. Embus is written
in Erlang programming language and it is a variation
on a message bus design pattern (Hohpe and Woolf,
2004) with an emphasis on monitoring data normaliza-
tion. Apart from a simple internal logic (e.g. routing,
supervision, ordering) the monitoring bus is currently
based on four basic concepts.
• Input Adapters:
represent the gateway to the
monitoring bus and to the architecture as a whole.
They facilitate the necessary functionality that is
needed in order to convert the raw monitoring data
into an internal data format that can be further pro-
cessed inside the monitoring bus. Note that the
input adapters can work either in push (streaming)
or pull mode, i.e. the raw monitoring data do not
necessarily need to be streaming data.
• Processors:
are the programmatic entities that per-
form all the necessary steps needed for successful
monitoring data normalization. Such steps include,
but are not limited to: parsing, attribute mapping,
filtering, projection, translation, pattern matching,
and more.
9
http://logstash.net
10
https://github.com/lasaris/gomatch
ICSOFT-EA2014-9thInternationalConferenceonSoftwareEngineeringandApplications
478

• Output Adapters:
ship the normalized monitor-
ing data into external systems such as messaging
queues, databases, and files using data formats and
protocols that are understood by those systems.
• Serialization Formats:
are mainly relevant when
using output adapter that relies on some envelope-
based data format (e.g. AMQP). In those cases one
can use the most suitable serialization format for
the task/situation at hand.
Section 2 shows a particular setup of the monitor-
ing bus that is used in our DEDMA prototype. The
most important internal components include: two input
adapters (rsyslog, and collectd), filter, basic attribute
mappers, pattern matcher, and AMQP-based output
adapter.
INPUT JSON :
{ " @tim e stamp " : " 2 0 1 4 - 0 2 - 0 1 T 0 8 : 26: 28.00 0 Z " ,
" @ent i t y " :" ip - 1 4 7 - 2 5 1 - 5 0 -15 ",
" @mes s age ": " Fa i l ed pass w o rd for x tovarn \
from 1 4 7.25 1 .42. 4 9 p o r t 4 1853 ssh2 " ... }
APP L I ED MAT C H ING RULE :
sshd . PAS S WORD _ FAI L E D ## \
Fail e d pass w o rd f o r %{ USER : u s e r } \
from % {IP : r h o s t } port % { POR T : port } % { WORD : sshv }
OUTP U T J S O N :
{ ...
" @type ": " sshd . PA S S WOR D _FAI L ED " ,
" @ p ": {
" user " :" xto v a rn ",
" rhost ": " 14 7 . 251 . 4 2.4 9 " ,
" port " : 418 5 3 ,
" sshv " : " ssh2 " } ... }
Listing 2: Log abstraction – input, applied rule, and
corresponding output
From the log abstraction and normalization per-
spective, pattern matcher is the key processor in our
setup, and also the most complex one. It was designed
and developed in order to match large number of pat-
terns (thousands) over single line input. It uses a
hybrid trie-based regex matching structure and cor-
responding algorithm that shows to be much faster
than traditional approaches to multi-pattern matching
(at the cost of slightly lower pattern expressiveness).
Section 2 shows an example of a single match on the
message of a single log.
The processor effectively solves the problems that
stem from an unstructured plain-text logging in natural
language. The only two disadvantages are: latency
penalization, and the fact that the pattern rule-set must
be often defined manually.
5.3 Normalized Monitoring Data
Exchange
On the egress side, the monitoring bus communicates
via Advanced Message Queuing Protocol (AMQP) v0-
9-1, taking advantage of a RabbitMQ
11
broker that
is used as the delivery system. If the reader is not
familiar with the AMQP, we suggest consulting its
basic principles.
AMQP . rout i ng_k e y =
ip -147 -251 - 5 0 - 1 5 . sshd . PAS S WORD _ FAI L ED
AMQP . payloa d = {
" @ti m estam p " :" 2014 -02 -01 T08: 26: 28.0 0 0 Z ",
" @ent i t y " :" ip - 1 4 7 - 2 5 1 - 5 0 -15 ",
" @type ": " sshd . PA S S WOR D _FAI L ED " ,
" @ p ": {
" user " :" xto v a rn ",
" rhost ": " 14 7 . 251 . 4 2.4 9 " ,
" port " : 418 5 3 ,
" sshv " : " ssh2 " } }
-- --- - -- - --- - -- - --- - -- - --- - -- - --- - -- - --- --- -
AMQP . rout i ng_k e y =
ip -147 -251 - 5 0 - 1 5 . c o l lectd . load . L O A D
AMQP . payloa d = {
" @ti m estam p " : " 2014 -02 -01 T08 : 26 : 2 5 . 000 Z" ,
" @ent i t y " : " ip -147 -251 - 5 0 - 1 5 " ,
" @type ": " coll e ctd . l o a d . LOAD " ,
" @ p " {
" sho r t term " : 0.68 ,
" midt e r m " : 0.51 ,
" long t erm ": 0 . 4 7 }}
Listing 3: Normalized monitoring data – routing key and
payload of the AMQP message
As a consequence, the normalized events take the
form of AMQP messages with the payload in serialized
JSON (structured in a way that can be seen in Section
3). To be able to route the messages accordingly in
the delivery system, the AMQP routing key equals to
@entity.@type
, i.e. the values of the corresponding JSON
attributes.
5.4 Delivery System & Virtual
Monitoring Data Streams Exchange
As stated above, the delivery system functionality is
facilitated via RabbitMQ – a popular open source mes-
sage broker that implements AMQP protocol. The
broker is written in Erlang and it is built on the Open
Telecom Platform framework for clustering and fail-
over. Using the AMQP’s topic-based exchanges the
RabbitMQ effectively enables us to materialize the
virtual monitoring data streams.
11
http://www.rabbitmq.com/
ContinuousQueriesoverDistributedStreamsofHeterogeneousMonitoringDatainCloudDatacenters
479

As we have already discussed, the AMQP routing
key is in the form of
@entity.@type
which we can now
take advantage of. Thanks to the AMQP’s topic-based
routing mechanisms multiple subscribers can sub-
scribe for a subset of monitoring events (based on their
type) related to particular producing entities. For ex-
ample: all the monitoring data from all the producing
entities (
#
), all the monitoring data from one particular
virtual machine (
ip-147-251-50-15.#
), and all the moni-
toring data of a particular type (*.collectd.load.LOAD).
The RabbitMQ also supports exchange-to-
exchange bindings which allows for a definition
of arbitrary topic topologies. This can be mainly
used for creating groups of virtual machines one is
interested in (see G1 exchange in Section Section
2). When combined with the RabbitMQ’s supported
(yet somehow limited) access control, it is a basis for
secure monitoring.
Note, that the broker can be relatively easily dis-
tributed when needed. The distributed instances
(nodes) can either form a cluster to operate as a single
logical broker, or they can form a federation to create
a topology of the broker instances. In the future we
plan to thoroughly evaluate other messaging systems
(e.g. Apache Kafka) that would be capable of serving
as a delivery system.
5.5 Event Processing System
For event/stream processing the prototype uses a
lightweight experimental event processing engine writ-
ten in Erlang we refer to as SEAL (Simple Event AL-
gebra). It is an operator-based (box-and-arrows) pro-
cessing system, i.e. the query is specified in the form
of connected operators. It aims at parallel-distributed
stream processing – its goal is operator distribution
(i.e. the operators of the specified query/topology can
be placed on different computing nodes), and to some
extent also operator parallelism (i.e. single operator
can be spread over multiple CPU threads or comput-
ing nodes). Currently, the engine supports three types
of windows (sliding, tumbling, and jumping), group
by operator, aggregation operators (max, min, avg,
stdev, count, sum), and sequence detection operator.
However, since AMQP is used for the delivery, it is
extremely easy to use any capable stream/event pro-
cessing system instead of SEAL.
5.6 Derived Monitoring Data Streams
Exchange & Consuming Entities
Since the client counterpart for the SEAL engine is
also written in Erlang, Erlang Distribution Protocol is
used as the primary carrier between the two commu-
nication parties (nodes). The client must first define
the virtual monitoring data streams to subscribe to (to
materialize them) and then define queries over them.
This in turn results in the materialization of derived
monitoring data streams the client can then consume
from. It is a clever combination of publish-subscribe
and stream processing. Note, that since there is cur-
rently no common (yet alone standardized) way to
communicate with stream processing engines, the na-
ture of this last exchange will depend on the stream
processing engine used.
5.7 Example Streams and Queries
Apart from the overall architecture of the prototype
Section 2 depicts an example of the defined streams
and queries. First, two virtual monitoring data streams
are materialized in the delivery system. The Q1 stream
consists of events with the type
sshd.PASSWORD FAILED
(rep-
resenting a failed login) produced by two virtual ma-
chines forming a single group (
ip-147-251-50-15
and
ip-147-251-50-16
). The second stream consist of events
with the type
collectd.load.LOAD
(carrying information
about the current load) produced by any entity con-
nected to the monitoring bus.
The
first query
(over the stream Q1) can be de-
scribed as follows: first, calculate one-minute count-
aggregates over the stream (i.e. the number of man-
ifested events); then, generate a derived event if and
only if their (maximum) count is thrice the higher than
the average count over the last 20 minutes. Such
queries (although somewhat more complex) can be
used for anomaly detection.
The
second query
(over the stream Q2) can be
described as follows: first, calculate nine-minute
average-aggregates over the midterm load attribute
grouped by the entity producing the events; If this av-
erage is higher than 0.87, generate a derived event.
This type of queries (but again more complex ones)
can be used for load-related pattern detection, e.g. for
provisioning purposes.
6 CONCLUSIONS AND FUTURE
WORK
To overcome the issues of cloud datacenters behavior
monitoring we have proposed the notion of Distributed
Event-Driven Monitoring Architecture, discussed it in
detail, and also presented its prototypical implemen-
tation. The architecture and the resulting prototype
allows for an easy definition of expressive continuous
queries over many distributed heterogeneous streams
ICSOFT-EA2014-9thInternationalConferenceonSoftwareEngineeringandApplications
480

of behavior and state-related monitoring data in cloud
datacenters.
In the future we will primarily focus on the fine tun-
ing of the prototype and careful evaluation of the per-
formed changes in the terms of their impact on the mea-
surable characteristics of the prototype. This will in-
clude throughout evaluation of accuracy, intrusiveness,
network overhead, latency, performance (throughput),
and scalability. The other key factors we fill focus on
will be the overall reliability and time-behavior of the
architecture as a whole.
REFERENCES
Aceto, G., Botta, A., de Donato, W., and Pescap
`
e, A. (2013).
Cloud monitoring: A survey. Computer Networks,
57(9).
Balis, B., Dyk, G., and Bubak, M. (2012). On-line grid
monitoring based on distributed query processing. In
Wyrzykowski, R., Dongarra, J., Karczewski, K., and
Wa
´
sniewski, J., editors, Parallel Processing and Ap-
plied Mathematics, volume 7204 of Lecture Notes in
Computer Science. Springer Berlin Heidelberg.
Balis, B., Kowalewski, B., and Bubak, M. (2011). Real-time
grid monitoring based on complex event processing.
Future Generation Computer Systems, 27(8).
Boulon, J., Konwinski, A., Qi, R., Rabkin, A., Yang, E., and
Yang, M. (2008). Chukwa, a large-scale monitoring
system. In Proceedings of CCA, volume 8.
Brunette, G. and Mogull, R. (2009). Security guidance for
critical areas of focus in cloud computing v2.1. Cloud
Security Alliance, (December):1–76.
Clayman, S., Galis, A., and Mamatas, L. (2010). Monitoring
virtual networks with lattice. In Network Operations
and Management Symposium Workshops (NOMS Wk-
sps), 2010 IEEE/IFIP.
Cre
t¸
u-Cioc
ˆ
arlie, G. F., Budiu, M., and Goldszmidt, M.
(2008). Hunting for problems with artemis. In Pro-
ceedings of the First USENIX conference on Analysis of
system logs, WASL’08, Berkeley, CA, USA. USENIX
Association.
De Chaves, S., Uriarte, R., and Westphall, C. (2011). Toward
an architecture for monitoring private clouds. Commu-
nications Magazine, IEEE, 49(12).
Etzion, O. and Niblett, P. (2010). Event Processing in Action.
Manning Publications Co., Greenwich, CT, USA, 1st
edition.
Gerhards, R. (2009). The Syslog Protocol. Online:
http://tools.ietf.org/html/rfc5424.
Hasselmeyer, P. and d’Heureuse, N. (2010). Towards holistic
multi-tenant monitoring for virtual data centers. In Net-
work Operations and Management Symposium Work-
shops (NOMS Wksps), 2010 IEEE/IFIP.
Hohpe, G. and Woolf, B. (2004). Enterprise integration pat-
terns: Designing, building, and deploying messaging
solutions. Addison-Wesley Professional.
ISO/IEC 25010:2011 (2011). Systems and software engineer-
ing — Systems and software Quality Requirements and
Evaluation (SQuaRE) – System and software quality
models. International Organization for Standardiza-
tion, Geneva, Switzerland.
Kreps, J., Narkhede, N., and Rao, J. (2011). Kafka: A dis-
tributed messaging system for log processing. In Pro-
ceedings of 6th International Workshop on Networking
Meets Databases (NetDB), Athens, Greece.
Lu, X., Yin, J., Li, Y., Deng, S., and Zhu, M. (2012). An
efficient data dissemination approach for cloud mon-
itoring. In Liu, C., Ludwig, H., Toumani, F., and Yu,
Q., editors, Service-Oriented Computing, volume 7636
of LNCS. Springer Berlin Heidelberg.
Mansouri-Samani, M. (1995). Monitoring of distributed sys-
tems. PhD thesis, Imperial College London (University
of London).
Massie, M. L., Chun, B. N., and Culler, D. E. (2004). The
ganglia distributed monitoring system: design, imple-
mentation, and experience. Parallel Computing, 30(7).
Nagappan, M. and Vouk, M. (2010). Abstracting log lines
to log event types for mining software system logs. In
Mining Software Repositories (MSR), 2010 7th IEEE
Working Conference on.
Narayanan, K., Bose, S. K., and Rao, S. (2011). Towards
’integrated’ monitoring and management of datacen-
ters using complex event processing techniques. In
Proceedings of the Fourth Annual ACM Bangalore
Conference, COMPUTE ’11, NY, NY, USA. ACM.
Object Management Group (2007). Data Distribution Ser-
vice for Real-time Systems, Version 1.2. Technical
report.
Oliner, A. and Stearley, J. (2007). What supercomputers say:
A study of five system logs. In Dependable Systems
and Networks, 2007. DSN ’07. 37th Annual IEEE/IFIP
International Conference on.
Rabkin, A. and Katz, R. (2010). Chukwa: a system for
reliable large-scale log collection. In Proceedings of
the 24th international conference on Large installation
system administration, LISA’10, Berkeley, CA, USA.
USENIX Association.
Rackl, G. (2001). Monitoring and Managing Heteroge-
neous Middleware. PhD thesis, Technische Universit
¨
at
M
¨
unchen, Universit
¨
atsbibliothek.
Spring, J. (2011). Monitoring Cloud Computing by Layer,
Part 1, Part2. Security & Privacy, IEEE, 9(2).
Teixeira, P. H. d. S., Clemente, R. G., Kaiser, R. A., and
Vieira, Jr., D. A. (2010). Holmes: an event-driven
solution to monitor data centers through continuous
queries and machine learning. In Proceedings of the
Fourth ACM International Conference on Distributed
Event-Based Systems, DEBS ’10, NY, NY, USA. ACM.
Tovar
ˇ
n
´
ak, D. and Pitner, T. (2012). Towards Multi-Tenant
and Interoperable Monitoring of Virtual Machines in
Cloud. SYNASC 2012, MICAS Workshop.
Zanikolas, S. and Sakellariou, R. (2005). A taxonomy of
grid monitoring systems. Future Generation Computer
Systems, 21(1).
ContinuousQueriesoverDistributedStreamsofHeterogeneousMonitoringDatainCloudDatacenters
481
