
e-Shop User Preferences via User Behavior
Peter Vojtáš and Ladislav Peška
Dpt. Software Engineering, Faculty of Mathematics and Physics, Charles University,
Malostranske nam. 25, 118 00 Prague, Czech Republic
Keywords: Web Market without Dominant Seller, Small to Medium Company e-Shop, User Behavior, User Models,
User Preference Learning, Performance Metrics, Offline Experiments, Production Data.
Abstract: We deal with the problem of using user behavior for business relevant analytic task processing. We describe
our acquaintance with preference learning from behavior data from an e-shop. Based on our experience and
problems we propose a model for collecting (java script tracking) and processing user behavior data. We
present several results of offline experiments on real production data. We show that mere data on users
(implicit) behavior are sufficient for improvement of prediction of user preference. As a future work we
present richer data on time dependent user behavior.
1 INTRODUCTION
An increasing number of trading activities moved to
the web. It is interest of both sellers and customers
to better understand processes behind a web shop.
A usual way of supporting product search is to
use ratings. User can provide explicit ratings. The
ration between user’s effort (cost) needed to provide
explicit rating and benefit the user perceives is
crucial for getting explicit ratings in a scale one can
derive reliable conclusions.
It is very often that users do not input explicit
ratings. Alternative solution is to track user behavior
as implicit indicators of user’s interests.
Our use case is a real world application in a
domain ranging from entertainment to tourist
industry.
The problem we would like to address here is:
do mere data on users’ implicit behavior suffice for
some business relevant conclusions? That is, we do
not have any additional data about users, we do not
have any additional data about objects we have only
data from tracking user behavior on the web. We
obtain these data using features of browsers which
enable to run java script tracking mouse actions and
reporting (asynchronously) these to server.
Implicit measures are generally thought to be
less accurate than explicit (Nichols, 1997). Because
of the situation on the market there is no other
possibility in our domain than to collect implicit data
about user behavior.
1.1 Domain Description
Our research is tightly connected to experiments
with data from a real life web shop running on a
cloud providing web server, database and system
with programming environment.
Our web shop acts in the area ranging from
entertainment to tourism and it is rather a small to
medium company. What is typical for this domain –
there is no dominant seller and there is a big number
of competing portals. We omit in this paper
appearance of aggregation portals (our web shop is
not listed at any of these).
This forces users visiting and browsing big
number of portals and indirectly this means that a
typical user is not registered to any of these systems.
This further leads to the fact that our knowledge
about user is restricted to data coming from cookies.
This causes additional noise in our research, because
whenever cookies are deleted (or expired), we
cannot identify that user anymore.
1.2 Users Visiting Portal
Big amount of users come to our portal redirected
from search engines and/or through various links
and almost immediately leave and never come back
(nevertheless causing load increase on server side).
Users interested in products / services offered in
portal under investigation, can be classified into
several groups. In our domain of entertainment and
Vojtáš P. and Peška L..
e-Shop User Preferences via User Behavior.
DOI: 10.5220/0005102300680075
In Proceedings of the 11th International Conference on e-Business (ICE-B-2014), pages 68-75
ISBN: 978-989-758-043-7
Copyright
c
2014 SCITEPRESS (Science and Technology Publications, Lda.)

tourism, there is a big part of users coming to buy
product without searching (usually a single popular
event) and never come back (or at least we cannot
identify their return by cookies). Moreover purchase
of such product is not connected to registration and
we do not get any information about these
customers.
Our focus is on users which are searching for a
more expensive product, return several times, open
details to several offers (we can assume that they
behave similarly on competing web shops). These
users form a quite small fraction of portal visitors
(let us call them target group) and from those only a
very small fraction purchases a product.
Nevertheless, in our domain, a purchase is not an
every day event, it usually appears only once-twice a
year per customer (and hence for him/her it is quite
important to make a good choice).
1.3 The Goal and Contributions
From the above we can summarize:
- We do not have here any information about
content of purchased objects; we have only
information about user behavior
- Our target group in this research are users
which visit / display several objects
- The only preference indicator is purchases
- We would like to improve recommendation on
our target group
Goal of this paper is to check whether mere data
on users’ (implicit) behavior are sufficient for any
business relevant conclusions about user
preferences.
We are able to show that our methods improved
quality of recommendation based solely on user
behavior data.
Main contributions of the paper are:
- Models, methods and experimental tools for
learning user preference from behavioral data
- Experiments on real production data and order
sensitive metrics showing improvement of
recommendation
- Report on collection of time dependent user
behavior data for future research
2 DATA, MODEL, METHODS
In this chapter we describe our application domain
(which influences the formal model) and problem
formulation.
To protect our data source from disclosing
business relevant data, all results in this paper are
only relative portions of measured phenomenon
(relativized to maximal value). Offline experiments
were provided with unrelativized real production
data.
2.1 Implicit Factors Describing User
Behavior
In our situation, as described above, we have users
identified per cookies. We have two possibilities;
either to require explicit or implicit feedback.
Explicit feedback forces users to additional activities
beyond their normal search behavior (Kelly and
Teevan, 2003). Following natural user interaction
and collecting implicit feedback with system is
possible through new browser technologies. Data
collected on the client side can be (asynchronously)
stored on the server side. Kelly and Teevan, 2003,
argue: as large quantities of implicit data can be
gathered at no extra cost to the user, they are
attractive alternatives.
Table 1: Example of entries of the dataset, here implicit
factors are abbreviated as follows: userID = uID, Object
ID = OID, Purchase = Pur, Pageview = Page, scroll = scr,
timeOnPage = timeOP, mouseMoves = moMo,
openFromList = opFL.
uID OID Pur Page scr timeOP moMo opFL
Id1 56 1 2 0 77 100 0
Id2 164 1 3 28 414 900 0
Id3 74 0 1 3 2 0 0
Id4 1990 0 1 0 160 20 1
In our system, we follow only users from our
target group. We collect data in following structure
(F
i
’s are called implicit factors):
userID,objectId,purchase,F
1
=pageView,F
2
=scroll,
F
3
=timeOnPage,F
4
=mouseMoves,F
5
=openFromList
Data are collected incrementally, that is after a
certain period (depending on the attribute) database
entry is appropriately increased. We collect data per
user and object (see example in Table 1).
Dependence between number of page views and
purchases is illustrated in Figure 1.
In general a point in data cube (representing user
behavior) is of form
(b
1
ui
, …, b
5
ui
) D
F
j
(1)
Because these are explanation variables, we try
to show that purchase is a dependent variable.
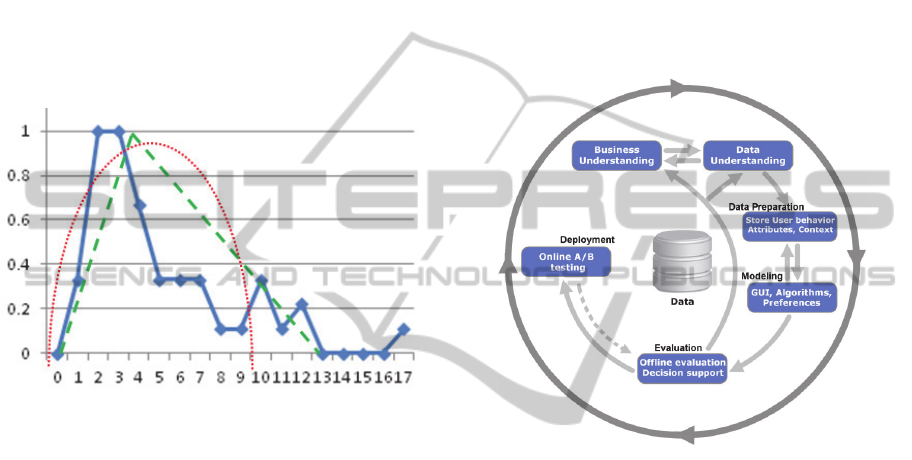
2.2 Modification of CRISP-DM
We use for description of our task CRISP-DM
methodology (Shearer, 2000). This consists of
following phases: Business Understanding, Data
Understanding, Data Preparation, Modeling,
Evaluation and Deployment. In our case of an e-
shop it can be depicted as in Figure 2. In our present
understanding the biggest effort is on double arrows
first between Business Understanding and Data
Understanding (we do not deal with this issue here),
second, between Data Preparation and Modeling
(our emphasis is on Preference learning, we consider
GUI issue in future work) and Evaluation.
Figure 1: Blue (solid) line is number of purchases (y-axis,
relativized to maximum) depending on number of page
views per user and object. Red (round dot) and green
(dashed) line are examples of learning local preferences
(see section 2.3 and 2.4).
2.2.1 Business Understanding and Data
Understanding
In this part, our data come from a medium sized
travel agency. Main activity is via web. We omit
various marketing issues and concentrate on part of
the page headed “We recommend”. So far we
provide only offline test on real production data.
Data are collected using Jscript in php which
collect browser actions.
2.2.2 Data Preparation and Modeling
Data preparation consists of writing scripts and
decision what to collect. These tasks are repeatedly
evaluated in connection with business.
Our model has two steps – local preferences and
global preferences. In our case there is only one
direct preference indicator – purchase. Local
preference learning contains methods which try to
learn preferences on each single implicit factor. Here
we mention only local methods peak and quadratic
(see Eckhardt, 2012 and Eckhardt, 2009).
2.2.3 Evaluation and Deployment
Our final goal is to provide online A/B testing.
Nevertheless to able to deploy methods we have to
consider not only good data mining evaluation
results (mostly tuning different parameters of
methods) but also ability to use it for each single
user coming to our web. Moreover we have to
convince managers to make a decision for online
tests.
Figure 2: Our modified Crisp-DM process diagram
(Jensen).
2.3 Local and Global Preference
Models
Each user is characterized by several implicit factors
(mainly numeric). These can be measured on item
page and/or catalogue page.
To normalize preferences we first represent
influence of each preference factor by a function
f
j
: D
F
j
[0,1], j=1,…,5 (2)
Where D
Fj
is the domain of respective implicit
factor, f
j
tries to mimic influence of value on
preference indicator (which is here purchase). This
function has to be learned by a local preference
learning method. In Figure 1 we see different
possibilities for f
1
a local preference function for F
1
= pageView.
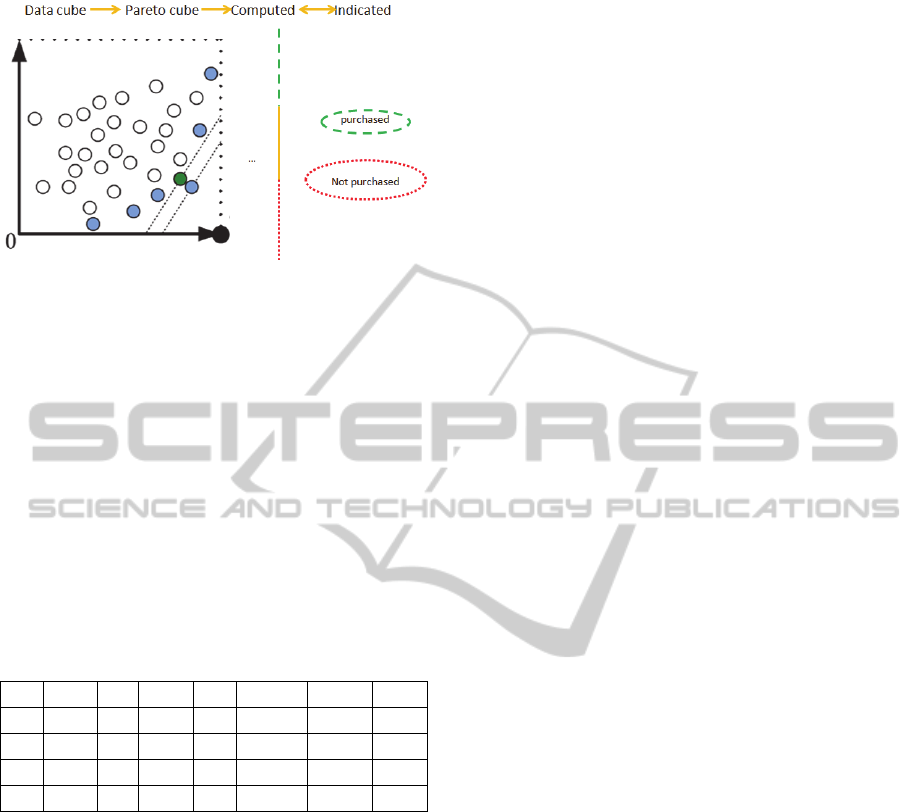
Figure 3: Illustration of steps of our method: Data cube
(left) is via Pareto cube (not depicted) transformed to
linear ordering (two left to right arrow) and this is
compared to preference by purchases (left-right arrow).
Local preferences transform the data cube D
Fj
(left in Figure 3, x axis has preference the bigger the
better, y-axis has preference the smaller the better)
into preference cube [0,1]
5
ordered by Pareto
ordering (not depicted). See also Table 2 where
illustration of possible transformation of point from
Table 1 is given.
Table 2: Illustration, how can local preferences transform
data from Table 1 to preference degrees (prefix L denotes
transformed attributes), corresponding preference cube
consists of attributes (axes) LPage, Lscr, LtimeOP,
LmoMo, LopFL of [0, 1]
5
.
uID OID Pur LPage Lscr LtimeOP LmoMo LopFL
Id1 56 1 0.6 0 0.4 0.6 0
Id2 164 1 0.9 0.4 0.2 0.1 0
Id3 74 0 0.3 0.1 0 0 0
Id4 1990 0 0.3 0 0.8 0.3 0.5
Second step of our model is a monotone
aggregation function
a: [0,1]
5
[0,1] (3)
which transforms each local preference tupple to
global preference, which orders all entries (depicted
in Figure 3 in middle).
2.4 Methods
We discuss now methods which learn user
preferences. The idea is that a stabile user comes to a
catalogue page and visits several item pages.
Assume for each user u and item i we have data
about 5 behavior factors b
1
ui
, …, b
5
ui
. Considering all
users and all visited items we get data points { b
1
ui
,
…, b
5
ui
: u, i}. More over we know which items were
purchased (in training set). This gives us a direct
preference indicator (of course with many ties on 1 =
purchased, 0 = not purchased).
For learning local preference we consider two
methods. First is method “quadratic” (which is
practically quadratic regression (see red round dot
line in Figure 1)). Second local preference learning
methods is peak: we first try to find an ideal point in
D
Fi
and then twice to use linear regression to get a
triangle shaped preference function (green dashed
line in Figure 1).
To learn aggregation we use methods from
Eckhardt and Vojtas, 2008.
(b
1
ui
, …, b
5
ui
) (4)
(f
1
(b
1
ui
), …, f
5
(b
5
ui
)) [0,1]
5
(5)
a((f
1
(b
1
ui
), …, f
5
(b
5
ui
))) [0,1]
(6)
The idea is, that if a new user comes (from
testing set, hence we do not know whether he/she
will purchase, we know only (b
1
ui
, …, b
5
ui
)). For
transforming (4) to (5) we use local preference
learned either by quadratic or peak method. To get
from (5) to (6) we use an aggregation a.
For comparison of our methods we consider also
direct data mining techniques which transform the
data points (4) directly to preference degree (6), see
Table 6.
3 EXPERIMENTS
In this chapter we describe our experiments. To
check the quality of computed ordering, we have to
compare it with indicated ordering (see Figure 3
right, purchased items are ordered higher than those
which were not purchased).
We present here two ways to check this quality,
first the quality of generated Pareto order and second
is the quality of final liner preference order
consistency with purchase – non purchase order.
3.1 From Data Cube to Preference
Cube
Each user is characterized by five implicit factors.
These can be measured on item page and/or
catalogue page.
First possibility of judging quality of our
preference learning is to check the quality of
transformed data points in Pareto ordering (where

i
1
i
2
if (f
j
(b
j
ui1
) f
j
(b
j
ui2
) for all j=1,…,5
(7)
the vector (1,1,…,1) is the highest preference).
Pareto ordering (and eventual preference) of two
items is given by (7) in a little bit simplified form.
Assume the total number of items is n. Pair i
1
i
2
is concordant if Purchase(i
1
)
Purchase(i
2
). If the
order is opposite the pair is called discordant.
Otherwise the pair is not Pareto comparable. The
number of concordant pairs is denoted n
c
, the
number of discordant pairs is denoted n
d
, the rest is
number of incomparable pairs n
inc
.
The quality of learning local preferences can be
evaluated by those numbers. As far as aggregation is
a monotone function, a discordant pair cannot be
repaired, and its position in the final ordering will be
opposite to that of purchase ordering. A concordant
Table 3: Purchase order versus Pareto order on preference
cube, number a ratio of discordant pairs.
localmethod n
d
ratiodiscord
peak 2181 0.0596
quadratic 2223 0.0608
Table 4: Purchase order versus Pareto order on preference
cube, number a ratio of concordant pairs.
localmethod n
c
ratioconcord
peak 18215 0.4980
quadratic 17498 0.4784
Table 5: Purchase order versus Pareto order on preference
cube, number a ratio of incomparable pairs.
localmethod n
in
c
Ratioincomp
peak 16180 0.4423
quadratic 16855 0.4608
pair is already well ordered and will preserve it also
after the a transformation into the final computed
preference ordering. Incomparable pairs can be
repaired by the aggregation.
In Tables 3, 4 and 5 we show (non)violation of
purchase (better) and non-purchase order after
transformation by various local preference methods.
Of course it can happen that some images are not
comparable.
We consider results quite interesting. Using an
experience of Holland, Ester and Kiessling, 2003,
incomparable elements can be used to get a Pareto
front which can be interesting for offering not only
best/top-k (probably very similar object) but also
diversify results.
3.2 Can Aggregation Help? from
Preference Cube to Linear
Ordering
We would like to have all items ordered linearly for
recommendation. Our preliminary tests show
performance of our local methods coupled with an
aggregation (Eckhardt and Vojtas, 2008) compared
to direct mapping by tools from Weka (composition
of both arrows in (4, 5, 6)).
Table 6: Results, here SMOreg is Weka support vector
machine for regression (Sourceforge, SMO Classifier) and
M5P is a Weka tree classifier (Sourceforge, M5P
Classifier).
Method
B
A
Peak + Eckhardt, 2012 0.724682 0.157858
Quadratic+Eckhardt,2012 0.670330 0.146018
SMOre
g
0.683289 0.148841
M5P 0.707622 0.154142
where
(8)
(9)
1/2
(10)
1/2
(11)
1/2
(12)
Here we use for comparison Kendal correlation
coefficient (Wikipedia, Kendall), where
A
does not
incorporate ties and
B
calculates with number of ties
(especially ties on purchases). In (11), t
i
is the
number of tied values in the i-th group of ties for the
first quantity (computed ordering). In (12), u
j
is the
number of tied values in the j-th group of ties for the
second quantity (purchase / non-purchase ordering).
Best result is in bold. We did not check statistical
significance of our improvement.
4 CONCLUSIONS AND FUTURE
WORK
In this chapter we describe conclusions and a little
bit extended section on future work with some new
user behavior data collected (so far not used for
preference learning, nevertheless indicating some
promising hypothesis).
4.1 Conclusions
In this paper we have presented continuation of our
project of preference learning for recommendation
on an e-shop along with some observation and
results. Our results were computed on combination
of tools from (Eckhardt, 2009 and 2012) and (Peska
et al. 2011).
We succeeded to show that based solely on user
behavior data we can improve user preference
learning. Our methods are based on two local
preference learning and one global preference
learning methods. We presented two types of
experiment. First, number of discordant pairs in
corresponding Pareto cube is only about 6% (this
shows that our local preference methods are not
making big irreparable mistakes). Second, we tested
the quality of linear preference order in comparison
to purchase / non-purchase order. Here our methods
outperformed standard machine learning methods.
4.2 Future Work
In this section we would like to describe additional
data collected. We present some summarizing
overviews. These will probably influence our future
work.
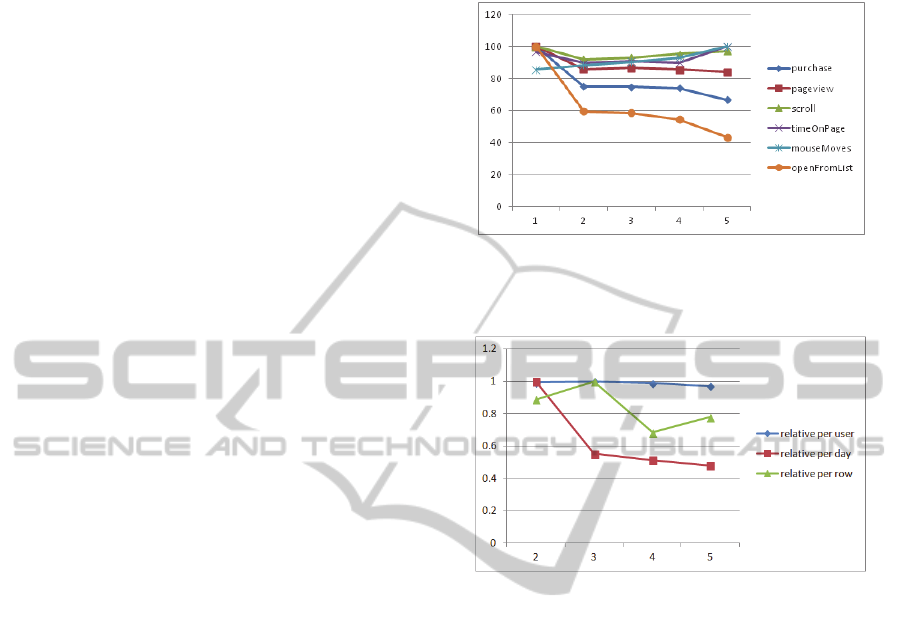
4.2.1 Time Distribution
In our data collection by scripts, we do not
distinguish between sessions. Temporal aspects of
implicit user behavior were split to five consecutive
periods (for each period we have only total sum of
implicit factor. Nevertheless server load is here the
main concern). In Figure 4 we depict development
of these data during five time periods from October
2012 to January 2013. All series are depicted as
percentage from maxima and relative per number of
users in respective period. E.g. number of purchases
per users was maximal in first period; measure of
mouse moves was maximal in last period relative to
number of users in this period.
4.2.2 Change of User Interface – A
Business Decision
In Figure 4 three parameters visibly decreased after
first period. This was probably caused by a business
decision (which was out of our control): list of
suggested items no longer appears on the first page.
Figure 4: Time development of implicit features relative
per user (normalized to maximum) in 5 consecutive time
periods.
Figure 5: Time series of number of relative comparison of
pageView (y-axis) in different time periods (x-axis,
omitting first period before change of UI).
It is out of scope of this paper to describe how
this list is created and to evaluate this business
decision.
In what follows we deal only with data collected
through periods 2 to 5.
For pageView we were interested in time
development during periods 2 to 5 (see Figure 5).
We can see that number of page view was relatively
stable when calculated per users.
There are clear trends when depicting pageView
relative to number of days a period lasts and to rows
in our data matrix (a row represents data collected
for a tuple (userID, objectID)).
This initial observation led us to decision to
change the data collection model and take content
into account.
4.2.3 Observation on Stability and Changes
of Page Types
In this point of data collection we came to another
point that it is more or less clear that we have to
follow navigation of a user between different pages.

Principally most important are catalogue pages and
item detail pages.
First problem of user understanding are users’
changes navigating between different catalogue
types of pages. This can be an indicator that the user
is not totally sure what he/she is looking for.
Nevertheless purchases after leaving can indicate
that he/she finally found what was looking for.
To our surprise, users’ behavior is quite stabile
and users do not purchase frequently after changing
type of pages (Table 7 and 8).
We can see, that users, after leaving search in
first type of tours and switching to another type of
tours, do not purchase that often (rather seldom).
Table 7: Main catalogue types of tours and number of
visitors leaving that type of tour.
Type Visits total
Purchase
total
Left for
other
type total
Sports event 31015 859 2974
Wellness tours 19611 536 3146
Sightseeing 26522 363 4488
Mountain tours 7081 325 1724
Ski holidays 2979 108 866
One-day trip 9938 254 2945
Beach holidays 13546 439 4043
Faraway tours 1595 17 1051
Table 8: Main catalogue types of tours, ratio of leaving
that type and purchases after leaving.
Type Ratio left
Purchased
after left
Sports event 0.096 30
Wellness tours 0.160 50
sightseeing tours 0.169 54
Mountain tours 0.243 17
Ski holidays 0.291 23
One-day trip 0.296 45
Beach holidays 0.298 64
Faraway tours 0.659 15
4.2.4 Richer Data Structure
Based on this stability observation, it seems we have
to concentrate on user behavior on pages of one
type.
Nevertheless, there are also opposite behavior
patterns.
On Figure 6 (time running from left to right) we
present a behavior pattern which can be interesting
from the business understanding point view. A user
is at a catalogue page which is interesting for
her/him and opens several tabs with items details.
At the beginning user is landing at index page.
Then in a separate browser tab, he/she opens
catalogue 1 page of type: “beach holiday” and after a
while restricting to catalogue 3 “beach holiday with
price < 500 EUR”.
Almost simultaneously he/she opens another tab
with catalogue 2 “France” and continuing with a
conjunctive query to catalogue 4 “France and beach
holiday”. Additional opening of catalogue 5 “Spain”
and viewing details of object 3 does not bring result
and both tabs are closed (marked x).
The search continues from catalogue 3 to page
view of object 1 and in another tab to object 2 of
same type (beach holidays with price <500EUR) and
viewing a similar object 4.
Finally the whole procedure is finished by
purchasing object1.
Figure 6: Schematic behavior in time pattern of opening
several tabs, catalogue types and objects, which can be
interesting for improving preference learning.
Behavior data of such type are probably of a big
interest and can indicate user interest. Such data can
be also used to increase preference degree of items
open (in comparison to those which were not
opened).
So far we were not able to fully understand such
rich behavior data and bring it to experimentally
verified results. Nevertheless it gives us a hypothesis
which can be tested in further progress of this work.
From this future work section we can learn four
lessons:
- Change of user interface can have impact on
behavior data collected
- We have to take into account temporal aspects
of user behavior
- We have to incorporate content based
recommendation
- We have to follow behavior in parallel browser
tabs
This is really a task for future work: to develop
models and methods that reflect these changes.
ACKNOWLEDGEMENTS
This work was supported by Czech grants SVV-
2013-267312, P46 and GAUK-126313. Authors
would like to thank the e-shop for providing data.

REFERENCES
Eckhardt, A. Prefwork - a framework for user preference
learning methods testing. In Proceedings of ITAT 2009
Information Technologies - Applications and Theory,
Slovakia. CEUR-WS, 7–13
Eckhardt, A., 2012. PrefWork - a framework for testing
methods for user preference learning.
http://code.google.com/p/prefwork/
Eckhardt, A. & Vojtas, P. Considering Data Mining Tech-
niques in User Preference Learning, In Proc. 2008
IEEE/WIC/ACM IC WI-IAT, IEEE, 33 – 36
Holland, S. & Ester, M. & Kiessling, W. Preference mi-
ning: A novel approach on mining user preferences for
personalized applications. In Knowledge Discovery in
Databases: PKDD 2003, Springer Berlin / Heidelberg,
2003, 204–216
Jensen, K. Crisp-DM process diagram, http://en.
wikipedia.org/wiki/File:CRISP-DM_Process_
Diagram.png
Kelly, D. & Teevan, J., 2003. Implicit feedback for
inferring user preference: a bibliography. Newsletter
ACM SIGIR Forum, 37.2 ,18 - 28.
Nichols, D.M. Implicit rating and filtering. In Proceedings
of 5th DELOS Workshop on Filtering and Collaborati-
ve Filtering . Budapest, ERCIM 1997
Peska, L. & Eckhardt, A. & Vojtas, P. Upcomp - a php
component for recommendation based on user beha-
vior. In Proc. 2011 IEEE/WIC/ACM IC WI-IAT, IEEE,
306–309
Shearer, C. , 2000. The CRISP-DM model: the new blue-
print for data mining, J Data Warehousing 5 , 13–22
Sourceforge, SMO Classifier, http://weka.sourceforge.net/
doc.dev/ weka/classifiers/functions/SMOreg.html, last
visited 05/07/2014
Sourceforge, M5P Classifier, http://weka.sourceforge.net/
doc.dev/weka/classifiers/trees/M5P.html, last visited
05/07/2014
Wikipedia, Kendall tau rank correlation coefficient,
http://en.wikipedia.org/wiki/Kendall_tau_rank_
correlation_ coefficient, last visited 05/07/2014
