
WSN-based near Real-time Environmental Monitoring for Shelf Life
Prediction through Data Processing to Improve
Food Safety and Certification
G. E. Biccario, V. F. Annese, S. Cipriani and D. De Venuto
Department of Electric and Informatic Engineering - DEI, Politecnico di Bari, Via Orabona 4, Bari, 70125, Italy
Keywords: Environmental Control, Food Safety, Food Certification, Shelf Life Prediction, Wireless Sensor Network.
Abstract: This position paper aims to support a control technique in the perishables goods supply-chain through a
combination of near real-time wireless sensor network (WSN) for environmental monitoring and further
data processing to predict the shelf life of the product. This approach returns a low cost, versatile and
efficient tool that can significantly improve the safety and food certification through the organoleptic
qualities control using three different sensors, i.e. temperature, light and humidity. In this article, therefore,
the advantages of the proposed technique are explained and a case study is presented to support this
approach, as well as an example of processing algorithm for shelf life evaluation.
1 INTRODUCTION
Nowadays, food safety and certification through-out
all the supply chain have become very strict
requirements, so that global associations such as the
FDA (“Food and drug administration”) or the WHO
(“World Health Organization”) are continuously in
activity to develop and promote more selective
methods of monitoring and control (FAO/WHO,
2007). Organoleptic properties of food, raw food,
cosmetics, drugs, specialty oral use and other
perishable products, affect considerably not only the
safety of the product for human use but also its
consumption and commercial success. Hence the
need to study, define and evaluate them correctly in
order to prevent their earlier degradation. In fact, the
loss of perishable products is estimated at approx.
$35 billion annually all around the world and
especially in US (Hoppough, Apr. 24, 2006).
A multitude of security and certification
protocols has been developed and spread in all areas
of the food supply chain and, among all, the “Hazard
analysis and critical control points” (HACCP)
method continues to be worldwide increasingly
prevalent. HACCP is a scientific and technical
approach for the prevention of biological, chemical,
and physical hazards, whose seven fundamental
principles are released and determined by the
standard ISO 22000 (ISO, 2005).
The HACCP aim is to identify the different
critical control points (CCPs) in food production and
to define the parameters of interest for suitably
monitoring every phase of the productive process.
This approach creates a major emphasis on food
quality, particularly with regard to health and safety,
a concept that goes beyond mere customer
satisfaction, but rather pointing to the protection of
public health (FAO/WHO, 2007).
An “ad hoc” WSN is an effective solution for
monitoring perishable goods during all their chain
supply. The near real time data availability, the low
power consumption, the possibility of expand the
WSN using the most appropriate components for
each application, the moderation of the production
costs and the adequate precision of the measures are
all great reasons that make a WSN an advantageous
solution in perishable food supply chain. The
gathered data can be used to prevent not
recommended environmental conditions, in
particular during the storage and distribution phases,
according to HACCP-like methods, in order to
prevent product rapid decay and, therefore, losses.
Moreover, they can be used to evaluate product
freshness via shelf-life (Labuza, 2001) parameter,
which is the period of time in which a perishable
product is compliant with declared nutritional data
values and sensory, chemical, physical and
microbiological characteristics, without becoming
unhealthy for use or consumption, when stored
under well-defined conditions (Institute of Food
777
Biccario G., Annese V., Cipriani S. and De Venuto D..
WSN-based near Real-time Environmental Monitoring for Shelf Life Prediction through Data Processing to Improve Food Safety and Certification.
DOI: 10.5220/0005102407770782
In Proceedings of the 11th International Conference on Informatics in Control, Automation and Robotics (ICINCO-2014), pages 777-782
ISBN: 978-989-758-039-0
Copyright
c
2014 SCITEPRESS (Science and Technology Publications, Lda.)
Science and Technology, 1993). In this paper, a
WSN-based environmental monitoring is described
as a case study to prove the effectiveness of this
approach. An algorithm for later data processing is
proposed for the near real-time availability of shelf-
life evaluation.
The paper is organized as follows: sections 2 and
3 propose related works and WSN architecture,
including (in section 4) a demonstrative monitoring
of three storage conditions affecting the organoleptic
properties of perishable goods, i.e. temperature,
relative humidity and light exposition, as case study.
The measurements have been realized in a
warehouse for storage of agricultural products. The
section 5 shows an algorithm for the processing of
the obtained data: a shelf life estimation through a
calculation algorithm based on the Arrhenius law.
The paragraph 6 shows an attempt of financial
statement.
2 RELATED WORKS
A Wireless sensor network (WSN) is an
infrastructure composed by wireless nodes, with
little memory and a low-performance CPUs, capable
of performing measurements, processing and
communicating wirelessly to a central point, where
the data are managed (Sohraby, 2007). The structure
typically involves several wireless scattered nodes in
a specific area periodically sending the collected
data to a coordinator point (gateway), which
manages the network and forwards them to another
remote system for further processing (Dargie, 2010).
The wireless access is usually a “contention-oriented
random access” type, as defined in the IEEE 802,
but IEEE 802.15.4 is the most commonly used
standard, in particular ZigBee standard. This is due
to IEEE 802.15.4 applicative advantages like
worldwide defined operative band (2.4 GHz ISM),
good data rate (250 kbps) and range of action
(several tens of meters), low power consumption,
possibility of routing and retransmission in case of
errors (Lee, 2007).
WSN effectiveness has been proved in many
applications concerning agro-food context (Yoo,
2007). In (Garcia-Sanchez, 2011) ZigBee-based
WSN is used for data-monitoring and video
surveillance in precision agriculture over distributed
crops. Other examples of monitoring during the
production phase are precision viticulture, as
presented in (Matese, 2009), and greenhouse control
(Dae-Heon Park, 2011). As concern storage
monitoring, WSN solution has been employed in
grain warehouse (Zhao, 2010) and fresh food
supermarket (Yang Chenwei, 2011). As described in
(Ko, 2014), WSN have proved to be an excellent
solution for real time traceability and monitoring of
agricultural product.
Although WSNs have already been effectively
employed in environment monitoring from
production to distribution phases, so that gathered
data can be used to generate alarms when specific
events are detected (Dennis J. A. Bijwaard, 2011),
they are not supported by a shelf-life evaluation,
which would ensure product adequate quality along
the supply chain.
In this paper a WSN-based monitoring,
supported by shelf-life valuation from environmental
variables, is presented; the collected data are used in
a simple degradation model to calculate shelf-life
which is communicate to the users through an
algorithm and can be used to send alarms when
recommended conditions are not verified anymore.
3 WIRELESS SENSOR
NETWORK ARCHITECTURE
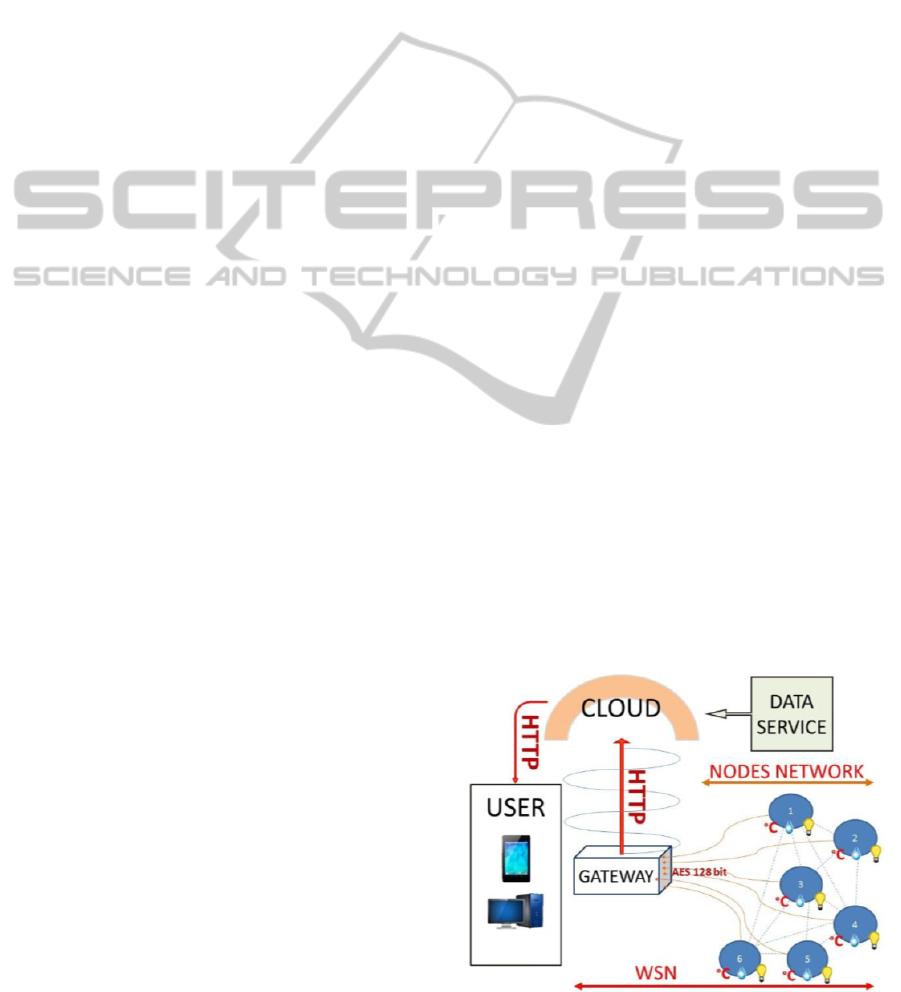
The WSN used for the monitoring activity consists
of several nodes equipped with three different
sensors to obtain information about the
environmental light, temperature and humidity
(figure 1). Each unit sends data to a coordinator
whose task is to make them available in almost real
time (neglecting the communication delays). The
communication between each node and gateway is
wireless using Zigbee protocol. Subsequently, the
gateway uploads the data to a cloud using an internet
connection. The data are available on the web using
a tablet, a smartphone, a PC or any device with
internet connectivity by logging in the data cloud
Figure 1: Architecture of the employed WSN.
ICINCO2014-11thInternationalConferenceonInformaticsinControl,AutomationandRobotics
778
that manages the data. An appropriate authentication
system allows access only to authorized users.
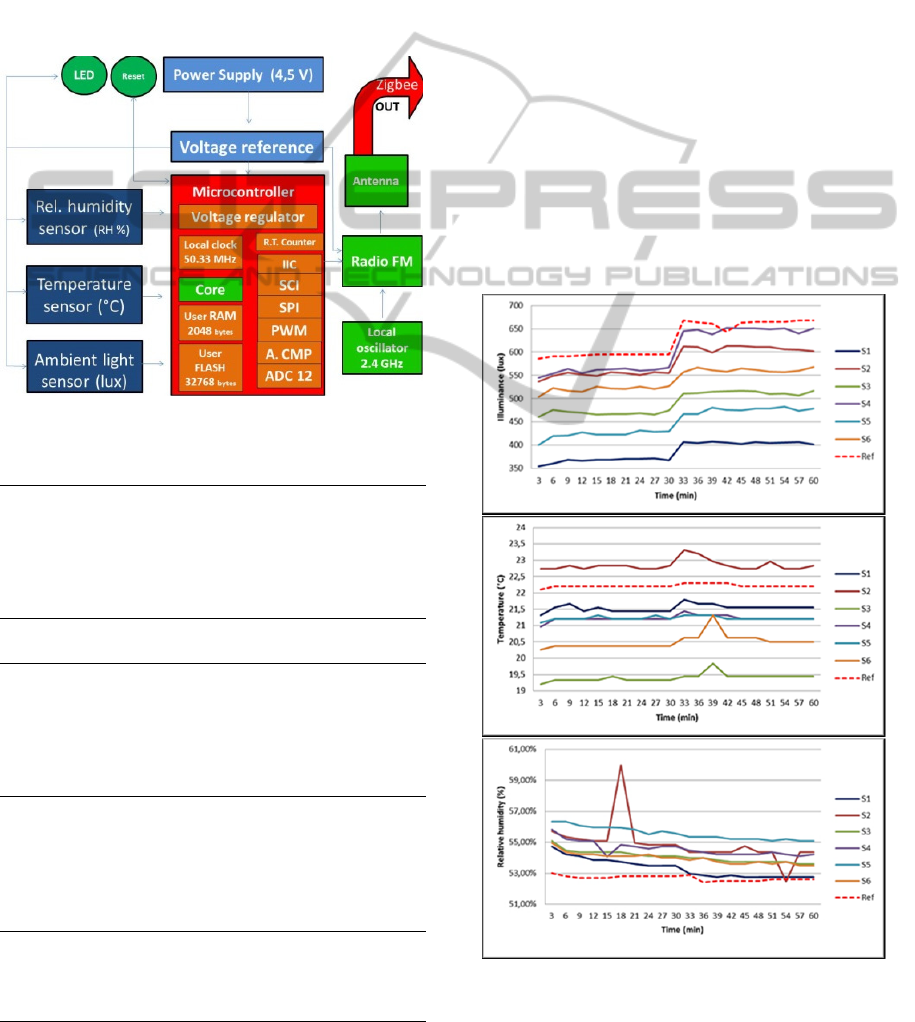
In figure 2 there is a demonstrative diagram
about the overall architecture of a single node.The
small size (6.85 cm x 6.35 cm x 3.30 cm) and the
independent power supplyallow proper positioning
of the sensors. Due to the use of the Zigbee
technology and to its low power consumption, the
battery life is durable.
Table 1 summarizes the main performance of
each node. The analog outputs of the sensors are
digitized by a 12 bit resolution ADC and then are
Figure 2: Architecture of a node of the WSN.
Table 1: Node sensor performances.
Specification Value
Power
supply
Read-sleep
cycle/ battery
life
1 per 30s/ 1.5 y
1 per 60s/ 2.5y
AC input V 3 x AA 1.5V
b
atter
y
Temp.
sensor
Ran
g
e -18 to +55 °C
Accurac
y
+/- 2
Ambient
light
sensor
Bandwidth
Ran
g
e
360 to 970 n
m
Wavelength of
p
eak sensitivit
y
570 n
m
Luminance
range
10 to 1000 lux
(+/-20%)
Relative
humidity
sensor
Range 0 to 95% RH
Interchangeabil
ity
+/- 5% (0 to 59%
RH)
+/- 8%(60 to 95%
RH)
Accurac
y
+/- 3.5% RH
Zi
g
bee
transmiss
ion
RF date rate 250kbps
Frequenc
y
ISM 2.4GHz
Indoor/line of
si
g
ht ran
g
e
40m / 120
m
processed for transmission. sensor specifications
should match the requirements of the product they
are intended to monitor. since this wsn has a
demonstrative purpose their values have to be
considered suggestive.
4 WSN IN A PERISHABLES
GOODS SUPPLY-CHAIN:
EXPERIMENTAL RESULTS
In this paragraph a case study is described to
demonstrate the feasibility and effectiveness of the
proposed solution. An “ad-hoc” solution requires an
adequate choice of the smart sensor selected once
inside the “working” environment and a positioning
and mapping phase of the nodes to get the
traceability of the product.
4.1 Sensor Performance Analysis
A preliminary performance analysis of the nodes had
Figure 3: from the top: illuminance, temperature and
relative humidity values collected during sensor accuracy
analysis and compared to the reference ones.
WSN-basednearReal-timeEnvironmentalMonitoringforShelfLifePredictionthroughDataProcessingtoImproveFood
SafetyandCertification
779
been performed: using comparative reference,
sensors accuracy have been evaluated. During one
hour session20 samples have been collected and
compared with those of more accurate instruments
(hygrometer–thermometer: Testo 608-H1; luxmeter:
Yokogawa 510 O2).
Measurements were carried out indoor with
artificial lights. The obtained values are shown in
figure 3, where the red dashed line represents the
values given by the instrument used as reference.
Sensors average values (table 2) have been
compared with reference average value to calculate
accuracy; standard deviation from average values is
useful to evaluate sensors precision. Sensors
performances are sufficient for an environmental
monitoring which therefore does not require extreme
precision.
Table 2 Illuminance, temperature and relative
humidity sensor averages and standard deviation for
accuracy and precision evaluation.
Average [lux] Std. Dev. [lux]
S1
385.6 19.78
S2
580.05 28.73
S3
491.05 22.48
S4
603.65 44.30
S5
449.45 27.47
S6
540.75 21.24
Ref.
628.1 -
Average [°C] Std. Dev. [°C]
S1
21.54 0.11
S2
22.84 0.16
S3
19.05 0.12
S4
21.21 0.086
S5
21.22 0.06
S6
20.50 0.22
Ref.
22,21 -
Average [rh%] Std. Dev. [rh%]
S1
53.32 0.0060
S2
54.89 0.0132
S3
54.06 0.0036
S4
54.57 0.0045
S5
55.56 0.0041
S6
53.95 0.0035
Ref.
52.68 -
4.2 WSN-based Monitoring of a
Dehydrated Agricultural Product
Warehouse
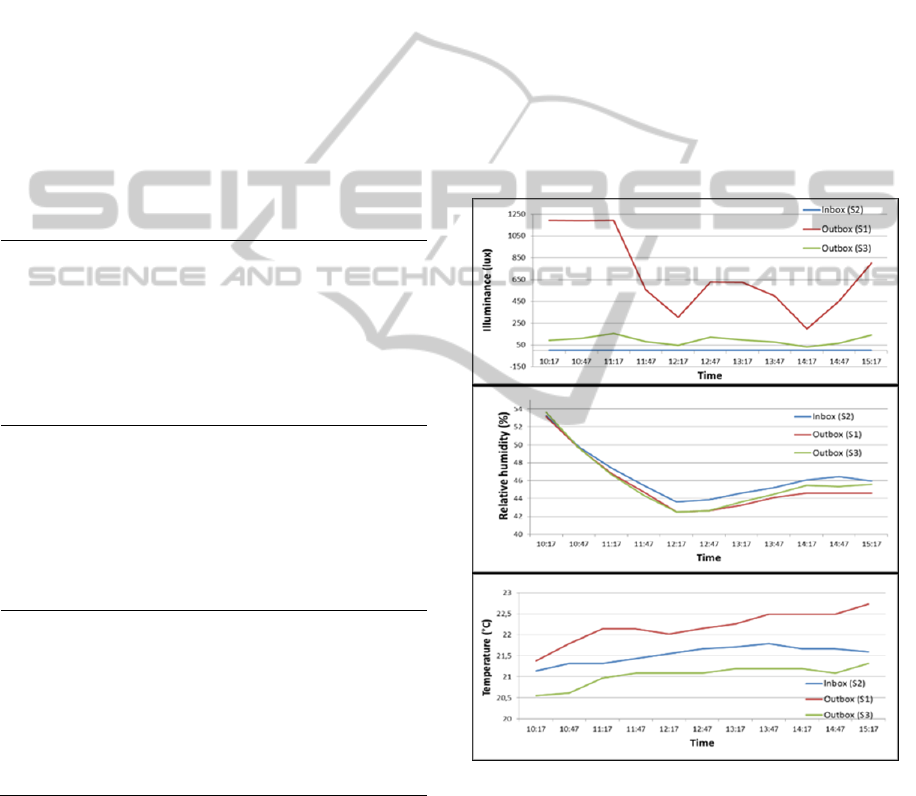
The presented WSN has been employed for the
monitoring of a warehouse of dehydrated
agricultural products. Three multi-sensor nodes have
been used to monitor three different pallets in the
same environment. Figure 4 shows collected data
values of the temperature, relative humidity and
light exposition during a 5 hours monitoring, from
10:17 to 15:17; three values per second were
collected and then averaged to reduce data through-
put. One node was placed in an indoor pallet (blue
curve), the others out of the pallet but in the
warehouse. Thanks to the battery life durability, it
would be possible a monitoring of the entire food
chain it in the same way. However, sampling data
could be significantly reduced to increase node lives.
This would promote transparency in the food chain,
becoming a guarantee for the consumer, a powerful
low-cost tool for the producer and a simple control
method for the predisposed organs. The collected
data became available to any authorized user in the
world almost in real time, neglecting a little latency
due to communication (few tens of ms).
Figure 4: from the top, illuminance (lux), relative humidity
(%) and temperature (°C) values collected during the
monitoring of a dehydrated agricultural products.
5 SHELF LIFE ESTIMATION
FROM QUALITY
DEGRADATION RATE
Shelf-life evaluation depends on the nature of the
ICINCO2014-11thInternationalConferenceonInformaticsinControl,AutomationandRobotics
780
considered product and, thus, on the environmental
factors involved in its degradation. Temperature,
light exposition and humidity affect product quality
at the same time but as concern the products in the
presented study, the implementation of Arrhenius
and Lambert law in a calculation algorithm has been
considered to estimate the degradation rate of the
agricultural products, and thus their shelf life,
assuming that recommended characteristics are
known.
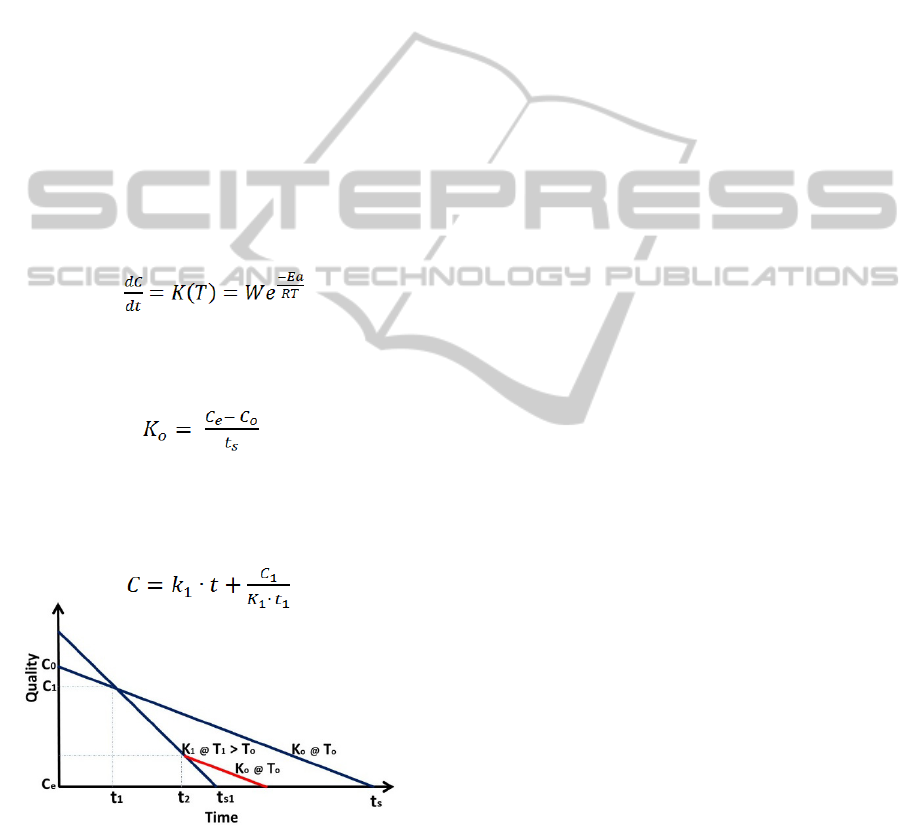
5.1 Linear Mathematical Model of
Quality Degradation Prediction
The relationship between product’s quality and time
is considered approximately linear (Figure 5):
stands for the food quality (
: recommended
condition;
: minimum quality level),
for the
shelf time, for the quality degradation speed. K
depends on the temperature according to Arrhenius
law [4]
(1)
,
,
,
, the recommended storage temperature,
have to be considered known (reference situation).
So
, the reference degradation speed is given by:
(2)
If at time
the temperature rises up to
,
above a certain threshold, it’s possible to estimate
(the new degradation speed) using eq. (1). The new
characteristic can be expressed as:
(3)
Figure 5: Linear model of quality degradation.
The new perspective produces a lower shelf-time
. If the temperature returns from
to
, the
shelf life must not change: by now the product
quality has been spoiled.
5.2 Algorithm for Shelf Life Prediction
Similarly to (Azanha, 2005), an algorithm for shelf
life prediction is proposed, according to the model
described above. The purpose is to create an
application for smartphone and tablet which is able
to calculate in real time how long the product
preserve the quality specifications in that
environment.
I. Store input data about standard shelf life (SLo
[h]), temperature (To), Humidity (Rho) and
illuminance (Lxo) of recommended value. Acquire
from the WSN information about current T, Rh, Lx,
than show them.
II. Verify if the current conditions are above
certain thresholds from the reference ones (the
chosen range is due to sensors performances). If not,
calculate the
. The SL is the same as the
reference SL (stored in input).
III. If the product is not in the standard condition,
create an alert signal. Than calculate the new
degradation speed coefficient (K) through Arrhenius
equation (1) and estimate the new shelf life as a
fraction of the standard one: the new shelf time is
calculated using the ratio between the current
degradation speed and the previous one. In order to
perform these calculation, a database with all the
required constant values is needed. Finally set the
new SL as a optimistic value: the product has been
spoiled (in a preventive view) and the SL cannot be
restored (even if returning in the recommended
conditions).
IV. Show remaining shelf time and repeat the loop
every hour.
5.3 Accuracy of Shelf-Life Prediction
The calculation system proposed exhibits a certain
degree of approximation. Firstly, the calculation is
made assuming the degradation as a linear function
of time although in reality it is not. Moreover,
considering that the temperature sensors have an
accuracy of + / - 2 ° C, we can reasonably assume
that the new value of the rate of degradation
is to
be understood between a
and
, evaluated
according to the Arrhenius law (equation (1)) at
2° and
2° respectively. Therefore the
shelf life is valid in an interval between
and
, according to eq. (3), using respectively
and
.
The accuracy of the system can surely be
improved by using more accurate sensors for the
measurement of the temperature and implementing a
method of calculation based on a more specific
WSN-basednearReal-timeEnvironmentalMonitoringforShelfLifePredictionthroughDataProcessingtoImproveFood
SafetyandCertification
781

mathematical (even better if the model is
differentiated by class of foods).
6 FINANCIAL CONSIDERATION:
COSTS AND BENEFITS
The proposed solution is not expensive and allows a
safe monitoring of several typology of goods. Just
for give an estimation of the costs let's try to make a
budget statement. If produced in a supply chain, we
can estimate the cost of each node of about €15
(considering nodes of high quality with re-
programmability and reusability characteristics) and
about €500 for each gateway. A system made by 3
gateways and 45 sensors (considered sufficient to
manage a medium-sized productive environment)
would cost about € 2,175. Estimating the lifetime of
the gateway (changing individual nodes is not a
problem) for about 4 years, we are talking about €
544 annually. Regarding the shelf life estimation and
the implementation of the dedicated application, we
can assume that in a supply chain cost is negligible
if compared to the WSN one. These costs would
certainly be overcome by the consequent reduction
of wastage in perishables chain and the
corresponding increase in sales (due to the added
value that such a monitoring system can provide the
product).
7 CONCLUSIONS
Safety and certification for food production is not an
objectionable topic but a strong need: WSN can be
used as an effective tool to allow both a reduction of
the waste in the supply chain through corrective
actions when recommended conditions are not
satisfied anymore and an improvement of food
safety through shelf-life estimation. A case study of
warehouse monitoring with a WSN architecture has
been described to support the feasibility and low
cost characteristic of this solution; three
environmental conditions, affecting the organoleptic
properties of perishable goods, i.e. temperature,
humidity and light exposition have been used in a
proposed algorithm, based on the Arrhenius law, to
estimate shelf life. Our work was therefore just a
demonstration of feasibility, but future prospects are
even more persuasive thanks to the several
application fields (not only agri-food) and the
flexibility of WSN architectures.
REFERENCES
Azanha, A., 2005. Use of mathematical models for
estimating the shelf-life of cornflakes in flexible
packaging. Packaging Technology and Science, 18(4),
pp. 171-178.
Dae-Heon Park, e. a., 2011. A Study on Greenhouse
Automatic Control System Based on Wireless Sensor
Network. Wireless Pers Commun, Volume 56, pp.
117-130.
Dargie, W. a. P., 2010. Fundamentals of wireless sensor
networks: theory and practice. s.l.:C.John Wiley and
Sons.
Dennis J. A. Bijwaard, e. a., 2011. Industry: using
dynamic WSNs in smart logistics for fruits and
pharmacy. Seattle, USA, Proceedings of the 9th ACM
Conference on Embedded Networked Sensor Systems,
pp. 218-213.
FAO/WHO, 2007. FAO/WHO guidance to governments
on the application of HACCP in small and/or less-
developed food businesses. s.l.:s.n.
Garcia-Sanchez, A. J., 2011. Wireless sensor network
deployment for integrating video-surveillance and
data-monitoring in precision agriculture over
distributed crops. Computers and Electronics in
Agriculture, 72(2), pp. 288-303.
Hoppough, S., Apr. 24, 2006. Shelf life. Forbes.
Institute of Food Science and Technology, 1993. Shelf-life
of foods: guidelines for its determination and
prediction. London: s.n.
ISO, 2005. ISO22000, Food Safety Management System.
s.l.:s.n.
Ko, D., 2014. Real Time Traceability and Monitoring
System for Agricultural Products Based on Wireless
Sensor Network. International Journal of Distributed
Sensor Networks, Volume 2014.
Labuza, T. P. S. L., 2001. Open dating of Foods. II ed.
Trumbull, Connecticut, USA: Food and Nutrition
Press.
Lee, J., 2007. A Comparative Study of Wireless Protocols:
Bluetooth, UWB, ZigBee, and Wi-Fi. Taipei, Taiwan,
s.n.
Matese, A. D. G. S. F., 2009. A wireless sensor network
for precision viticulture: the NAV system. Computer
and Electronics in agricolture, 69(1), pp. 51-58.
Sohraby, K., 2007. Wireless sensor networks: technology,
protocols, and applications. Hoboken, New Jersey:
John Wiley and Sons.
Yang Chenwei, L. D. Y. D. Y. S. L. Z., 2011. Design of
Monitor-and-control System for Supermarket Fresh
Area Based on ZigBee. Wuhan, IEEE, pp. 1302-1305.
Yoo, S., 2007. A2S: Automated agriculture system based
on WSN. Irving, ISCE 2007. IEEE International
Symposium on Consumer Electronics.
Zhao, Y., 2010. The grain depot temperature
measurement system’s research based on wireless
sensor networks. Jinan: IEEE.
ICINCO2014-11thInternationalConferenceonInformaticsinControl,AutomationandRobotics
782
