
Tsunami Evacuation Simulation
Case Studies for Tsunami Mitigation at Indonesia, Thailand and Japan
E. Mas
1
, S. Koshimura
1
, F. Imamura
1
, A. Suppasri
1
, A. Muhari
1
and B. Adriano
2
1
International Research Institute of Disaster Science, Tohoku University, Sendai, Japan
2
Graduate School of Engineering, Tohoku University, Sendai, Japan
Keywords:
Tsunami Evacuation, Evacuation Simulation, Agent Based Model, 2004 Indian Ocean, 2011 Tohoku Japan.
Abstract:
The 2004 Indian Ocean tsunami and the 2011 Great East Japan tsunami left several lessons for future events.
Both tsunami events confirmed the importance of early evacuation, tsunami awareness and the need of devel-
oping much more resilient communities with effective evacuation plans. To support reconstruction activities
and efforts on developing resilient communities, tsunami evacuation simulation are applied to tsunami mitiga-
tion and evacuation planning. In this paper we highlight the importance of tsunami evacuation simulation as
a tool in disaster management. Case studies of application of a tsunami evacuation model developed by the
authors are presented here. Applications in Indonesia, Thailand and Japan tsunami prone areas are reported.
In addition, challenges and future research directions for tsunami evacuation modeling are briefly discussed.
1 INTRODUCTION
The 2004 Indian Ocean Tsunami (IOT) was reported
and recorded at several locations in Indonesia, Thai-
land and other countries in the Andaman Sea. It
was probably the first time for many people around
the world to watch footages of a devastating tsunami
event. (Synolakis and Bernard, 2006) referred to
the surprising images of tourists in Phuket, Thailand,
watching the onslaught of the tsunami without tak-
ing any protective action. Tsunami risk involves not
only the hazard assessment, but also the social com-
ponent of human behavior against disasters. In addi-
tion, evacuation has proofed to be the best way to save
lives against tsunami (Shuto, 2009). The 2011 Great
East Japan Tsunami (GEJT) was one of the biggest
tsunami events in Japans modern history. The large
inundation and tsunami heights reported destroyed
several towns and villages along the coast. Still, there
was a 96% survival rate of people living in the areas
inundated (Suppasri et al., 2012). The unfortunate af-
termath resulted from the 2004 IOT was attributed to
the lack of warning information, tsunami awareness
and early evacuation response. Conversely, the 2011
GEJT left many lessons for future events and con-
firmed the importance of early evacuation, tsunami
awareness and development of resilient communities
with effective evacuation plans. In this paper, we
present four case studies of tsunami evacuation sim-
ulation conducted to support tsunami mitigation and
evacuation planning in areas at risk.
2 BACKGROUND
Computation power of large amount of data has made
it possible to move the tsunami evacuation modeling
approach from network based (L
¨
ammel et al., 2010)
to grid based (Mas et al., 2012), potential fields (Me-
guro and Oda, 2005) or hybrid modeling approaches
to optimize calculation times(Kato et al., 2009). Re-
search methodologies are using much more data with
finer levels of granularity through agent based mod-
eling and high performance computing (Wijerathne
et al., 2013). In addition, the interest to incorpo-
rate human behavior in evacuation models has in-
creased (Fujioka et al., 2002; Suzuki and Imamura,
2005; Mas et al., 2012). After the 2004 IOT and 2011
GEJT, tsunami evacuation modelers are looking into
practical applications of simulators, to solve particu-
lar problems that have been present in these events.
Some issues that concern researchers and stakehold-
ers are evacuation timing, bottleneck and congestions
from vehicle evacuation, shelter allocation, evacuees
behavior, risk communication, etc. In addition, the
reconstruction process of tsunami affected areas de-
mand for new evacuation plans following new urban
layouts. The assessment of effective evacuation plans
249
Mas E., Koshimura S., Imamura F., Suppasri A., Muhari A. and Adriano B..
Tsunami Evacuation Simulation - Case Studies for Tsunami Mitigation at Indonesia, Thailand and Japan.
DOI: 10.5220/0005104802490254
In Proceedings of the 4th International Conference on Simulation and Modeling Methodologies, Technologies and Applications (SIMULTECH-2014),
pages 249-254
ISBN: 978-989-758-038-3
Copyright
c
2014 SCITEPRESS (Science and Technology Publications, Lda.)
under new urban spatial conditions can be analyzed
and evaluated first using evacuation models.
3 CASE STUDIES
Tsunami evacuation simulation is becoming an im-
portant tool to simulate the response to warnings, the
estimation of casualties, the evaluation of evacuation
plans and alternatives for tsunami mitigation. These
experiments are guiding the development of more ef-
fective educational and mitigation programs at many
countries (Bernard et al., 2006). Here, we show sev-
eral examples of case studies of tsunami evacuation
modeling applied to verify, analyze and evaluate real
and predicted tsunami scenarios of evacuation. The
authors had used in a number of cases a tsunami
evacuation model developed in NetLogo (Wilensky,
2001)—an agent-based platform to simulate complex
systems. First, tsunami numerical simulation is con-
ducted using the Tohoku University Numerical Anal-
ysis Model for Investigation of Near-field tsunami No.
2 (TUNAMI-N2). In TUNAMI, nonlinear shallow
water equations are discretized on a staggered-leap
frog finite difference scheme (Imamura, 1996). Re-
sults of the tsunami simulation are integrated to the
NetLogo environment where agents are built to es-
cape from disaster to nearby shelters or exits within
the computational area (Mas et al., 2012; Mas et al.,
2013a).
3.1 Padang, Indonesia
Padang is located on the center of the west coast of
Sumatra in Indonesia. After the IOT in 2004 sev-
eral earthquakes occurred in the southern part of the
Sunda Trench. These events put on alert the city of
Padang and brought attention to an existing seismic
gap. (Imamura et al., 2012) described the assessment
of tsunami hazard in this area based on a megathrust
earthquake scenario for tsunami simulation and using
high-resolution bathymetry and topography data. The
extent of the resulted inundation area covered approx-
imately 25 km
2
with approximately 235,000 people
at risk of tsunami inundation depths from 3 m to 8
m. In Padang there is a lack of vertical evacuation
facilities inside the predicted inundation area. In ad-
dition, from the experiences of 2007, 2009 and 2010
tsunami warning events, it has been found that resi-
dents mainly use vehicles or motorcycles for evacu-
ation despite traffic jam experiences. Consequently,
in this case study, it was necessary to identify the
time needed by the evacuees to leave the tsunami in-
undation area and assess the routes of possible con-
gestion during the evacuation. Tsunami evacuation
simulation was used to identify times for evacuation
and bottleneck points. A total of 104,352 agents were
modeled within a 15 km
2
area south in Padang city.
The agent-based model was used (Mas et al., 2012),
modeling residents to respond at different times to
the tsunami threat and evacuate towards the exits and
shelters located on the east side of the city (Figure 1).
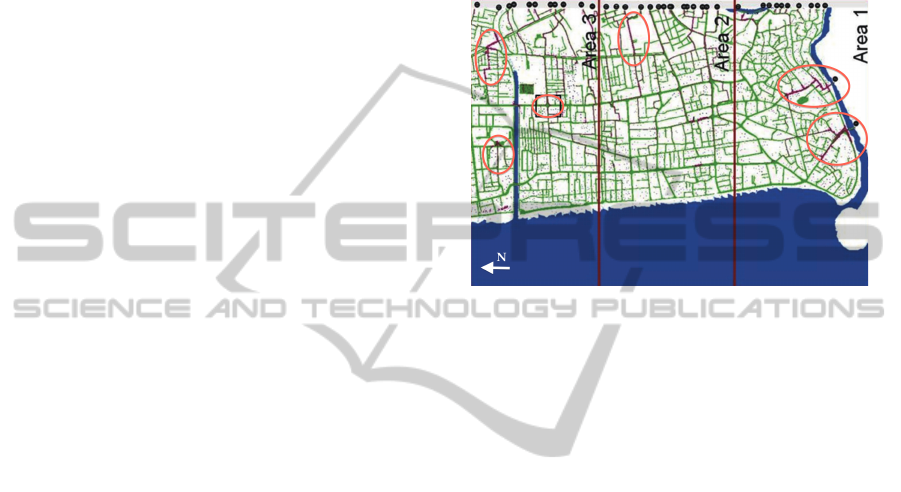
Figure 1: Padang city. The areas of evacuation simulation
and, surrounded by circles, the streets which resulted on
congestion.
The timing for evacuation decision was based
on results from questionnaire surveys conducted in
Padang after 2007 and 2009 events. With the amount
of population modeled, and the evacuation behavior
for departure as input in the model, the casualty esti-
mation, time for evacuation and points of bottleneck
were identified. Fatalities were estimated on 37.7% of
the population simulated in this scenario. In addition,
we identified several streets congested on the north
part of the study area due to high demand of some exit
points. Areas near the shopping center and the tradi-
tional market center were highly congested due to the
large density of population gathered. Moreover, to
the south of the simulation domain, agents evacuated
to high ground crossing the river through a bridge; the
large number of evacuees resulted on large cues and
crowd congestion.
3.2 Pakarang Cape, Thailand
The next case study is the evacuation simulation of
Pakarang Cape population in Thailand (Mas et al.,
2013b). The Pakarang Cape is in the Khao Lak beach
resort area of Phang Nga province in Thailand, and it
is located at the coast of the Andaman Sea. This area
was devastated by the IOT on 2004. The Thai Me-
teorological Department (TMD) provided population
data and its spatial distribution. A total of 2,649 resi-
dents were modeled based on a night-time population
scenario. The objective was to explore the influence
SIMULTECH2014-4thInternationalConferenceonSimulationandModelingMethodologies,Technologiesand
Applications
250
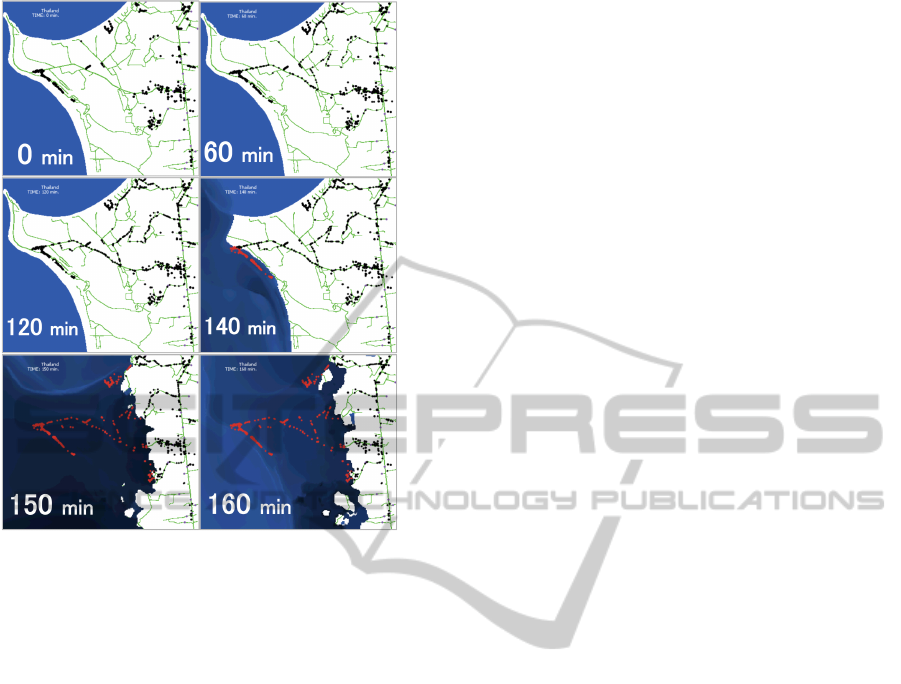
Figure 2: Snapshots of the worst-case scenario, where the
evacuation is towards the shelters located on the right side
of the area.
of vehicles in the evacuation, combined with differ-
ent reaction times from residents. A set of percent-
age of evacuees in vehicles (passengers and drivers)
was assumed among the population to build several
scenarios for simulation. Therefore, 0%, 25%, 50%,
75% and 100% of agents were reduced from the total
population and grouped in 4 passengers to build the
vehicle agent population data. The start time decision
of evacuation followed several departure curves of
Rayleigh distribution characterized by its mean value.
The value of the mean of the distribution, which fits
to the results of a questionnaire survey applied in the
area to 57 residents in different villages among Phang
Nga and Phuket (south of the study area), was 30 min.
In addition to the distribution curve from the question-
naire, three possible scenarios were added: a worst-
case scenario with late evacuation reaction of 120
min mean value—this is the estimated arrival time of
tsunami for the 2004 IOT event in this area—and two
intermediate scenarios with 60 min and 90 min mean
value. The fatality rate was defined as the ratio of es-
timated casualties over the total population involved
in the simulation. Due to the long distance for evac-
uation, approximately 2 km, the worst-case scenario
of evacuation, shown in Figure 2, is a non vehicle
use and on-foot evacuation, added to the late reaction.
The application of tsunami evacuation simulation in
this case study showed the capability of evacuation
modeling to evaluate the feasibility of evacuation. In
this case, twenty scenarios of different starting time of
evacuation and percentage of use of vehicles in evacu-
ation were compared. Results suggest that, due to the
long distance of shelters, small number of population
and sufficient road capacity, vehicle evacuation was
possible and required to ensure safety. Notice that in
a larger population, traffic congestion might be possi-
ble, as we will describe on the following case study.
3.3 Sendai, Japan
(Mas et al., 2012) modeled the evacuation of Arahama
town for the 2011 GEJT. Arahama was a populated
village in Sendai plain area. Approximately 300 fa-
talities were reported in this area, where the tsunami
arrived at approximately 67 min after the earthquake
with a maximum tsunami height over 8 m. The ex-
tent of the inundation area reached as far as 5 km in-
land. In Arahama, the only official Tsunami Evacu-
ation Building (TEB) was the Arahama Elementary
School. The school is a four-story building with ac-
cessible roof. It provided tsunami shelter to approxi-
mately 520 evacuees. The tsunami evacuation simu-
lation was conducted to 2,271 people. The majority
of them, based on pre-tsunami questionnaire surveys
(Suzuki and Imamura, 2005), preferred to evacuate on
vehicles (72%). With 4 passengers per vehicle, 410
cars and 631 pedestrians were modeled. A stochastic
simulation was performed to obtain average outputs
for parameters of interest. A total of 1,000 simula-
tion repetitions were conducted with random initial
spatial distributions of pedestrians and vehicles. The
evacuation start time decision was based on a ran-
domly selected value within boundary distributions
constructed with the mean of distribution fitting stated
preference questionnaires and recorded arrival time of
the tsunami on 11 March, 2011 (67 min) (Figure 3).
Each simulation provides information of the num-
ber of evacuees in shelters, the number of evacuees
who have passed one of the exits and the number of
evacuees trapped by the tsunami with more than a
50% probability of falling by the flow. This informa-
tion, at such level of granularity, is one of the greatest
advantages of agent-based modeling. It is not only
the emergent behavior that is discovered, but also the
details of common agent behavior and possible local
issues that can be identified. It is difficult to obtain
the exact values observed with the stochastic simula-
tion developed in this study; however, the average es-
timations of survivors and evacuees at the TEB shows
that the model has good capability for representation
of decisions and casualties in the area. The standard
TsunamiEvacuationSimulation-CaseStudiesforTsunamiMitigationatIndonesia,ThailandandJapan
251
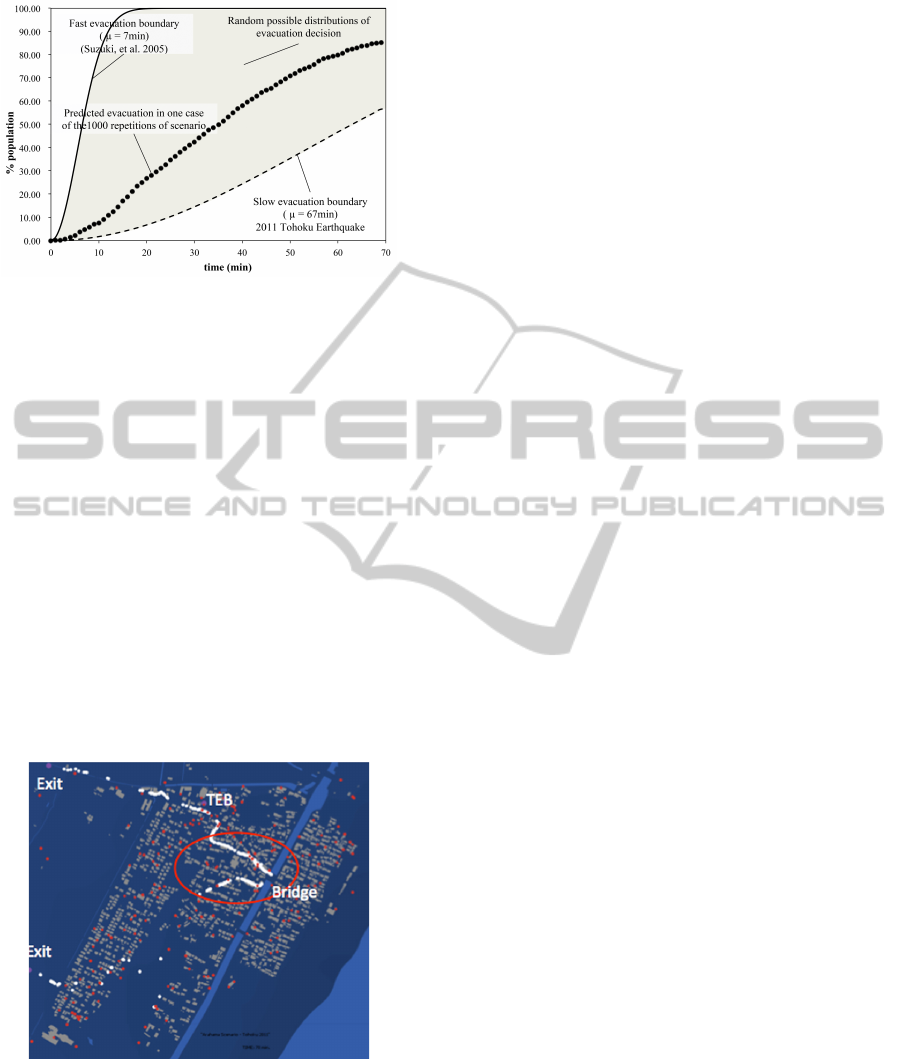
Figure 3: The area within the boundary distributions con-
tains the possible values and distributions of evacuation be-
havior used in the simulation. The dotted line is the result-
ing evacuee behavior taken from one scenario of the 1,000
repetitions of random selection.
error of predicted values versus the official informa-
tion is 43% for the case of casualty estimation (model:
406, data: 283). Due to the uncertainty in the initial
population distribution, the actual number of passen-
gers in vehicles and the possible use of non-official
buildings as shelters, the casualty estimation could
not be accurately predicted. However, good results
were met for the number of evacuees sheltered at the
TEB with 4% error (model: 498, data: 520) and 7%
for the rest of the population evacuating inland. In ad-
dition, time-history plots of shelter demands and traf-
fic flow through exits were developed in the model to
support on the allocation of future new shelters and
distribution of relief resources.
Figure 4: The last snapshot of simulation showing in white
the areas of traffic congestion during evacuation. Traffic
congestion was confirmed with survivors for the segment in
front of the Tsunami Evacuation Building (TEB).
Traffic was generally observed on the main roads
leading to the exit points, at the entrance of the
tsunami evacuation building and near the bridge at the
channel (Figure 4). Although these bottlenecks did
not occurred at the same time, they were observed at
some point during at least one of the repetitions. All
of these bottlenecks should be identified as possible
critical points. The application of tsunami evacuation
simulation in this case showed the capability of the
model to identify bottlenecks and verify the process
of evacuation with several behavioral conditions. The
stochastic simulation and the individual level of rep-
resentation in the model gives the modeler a reason-
able amount of data to analysis and identify issues not
only at the large scale, but also on local agent behav-
iors that might not contribute to a safe evacuation.
3.4 Natori, Japan
In (Takagi et al., 2014), the evacuation behavior re-
ported in Natori, Yuriage was simulated to verify the
evacuation process and the reasons for the large num-
ber of fatalities in the area. Yuriage is a small town
near the Natori River in the plain area of Miyagi Pre-
fecture. Before the earthquake, approximately 5,612
residents were living in the area. Due to the earth-
quake, 752 people were killed by the tsunami and 41
are still missing. It was reported in this area that resi-
dents evacuated to nearby shelter areas, however after
tsunami warnings were increased (Japan Meteorolog-
ical Agency (JMA), 2013), some evacuees decided to
conduct a second step evacuation to a far inland shel-
ter. Tsunami arrived when evacuees where moving to
a second shelter and killed some of them. We found
that the number of fatalities could have been reduced
provided people would have evacuated directly to the
second shelter from the start. The model was applied
in two scenarios of simulation: Case A: a scenario as
close as possible to the real evacuation, based on re-
ported data by local authorities and survivors; Case B:
a scenario where the second evacuation was not per-
formed. The actual reported number of fatalities in
the event and the results from simulation are shown
in Table 1. Figure 5 shows the sequence of evacua-
tion at each shelter in Case A, where the Community
Center was already full after approximately 25 min
from the earthquake ( 15:10 JST).
At 15:14 JST, tsunami warning was upgraded for
Miyagi coast from 6 m to above 10 m (Japan Meteoro-
logical Agency (JMA), 2013). Based on information
provided by survivors, approximately 15:30 JST was
the time for evacuees to start moving from the Com-
munity Center to the Junior High School, this agrees
with the time of the tsunami warning upgrade. Thus,
in the model we set 15:30 JST as the time for the sec-
ond evacuation. Similar to simulation results, it was
reported that in the Community Center 43 people sur-
vived (Murakami et al., 2012). In addition, results
SIMULTECH2014-4thInternationalConferenceonSimulationandModelingMethodologies,Technologiesand
Applications
252
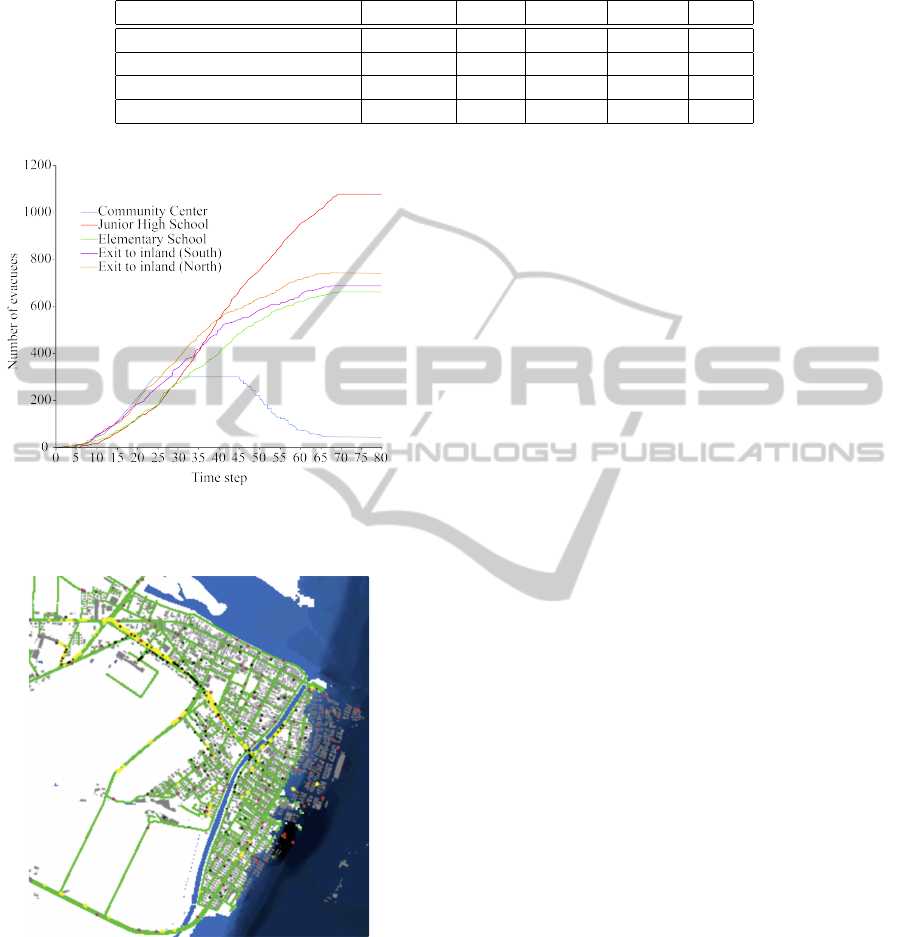
Table 1: Shelter capacity near Yuriage, the outcome of the 3.11 tsunami and results from Case A and Case B. The last column
shows the reduction on fatalities when no re-evacuation behavior was performed.
Shelter Capacity 3.11 Case A Case B A-B
Community Center 300 43 43 300 +257
Yuriage Junior High School 2000 1000 1050 1067 +17
Yuriage Elementary School 2300 870 699 759 +60
Fatalities ** 762 774 436 -338
Figure 5: The time-history of evacuees in shelters from
the simulation. Notice the arrival and second evacuation
to/from the Community Center (blue line).
Figure 6: Yuriage, Natori inundated by tsunami numerical
simulation results. Black dots are evacuees in progress as
pedestrians; purple dots are evacuees on vehicle, red dots
are fatalities caught by tsunami and yellow dots show the
points of bottleneck during the simulation.
show that a total of 257 evacuees were able to leave
the Community Center before the arrival of tsunami,
but only 82 were able to reach the Junior High School
on time (Figure 6).
Some reasons for the number of fatalities may be:
(i) The short time for re-evacuation: each evacuee
conducted a second evacuation in between 15:30 JST
to approximately 15:50 JST—the time when tsunami
arrived to the Community Center; (ii) The traffic jam:
based on survivor’s accounts, the road in front of the
Community Center was congested with vehicles and
people who tried to re-evacuate on car. Conversely,
as in Case B, where evacuees do not perform a sec-
ond evacuation from the Community Center, the total
amount of fatalities could have been reduced approxi-
mately 44%. Tsunami evacuation modeling is a pow-
erful tool that can be applied to understand the effects
of evacuees decisions on the outcomes of their evacu-
ation process. In addition, future evacuation plans and
activities for reconstruction process and urban plan-
ning can be supported by the results provided from
these kind of models.
4 FINAL COMMENTS
Each time when a tsunami occurs, lessons are gath-
ered and shared, then, tsunami research shows a
progress (Shuto, 2009). Similarly, tsunami evacua-
tion research has substantially improved since 2004
IOT. The future of tsunami evacuation research, as
seen by the authors, is the comprehensive approach
of the geophysics of tsunami and the psychology of
the evacuee behavior built into an integrated model-
ing technique. There are several ongoing efforts (Mas
et al., 2012; Mas et al., 2013a; Wijerathne et al.,
2013), however, still data to verify and validate the
human behavior in emergency and models to ade-
quately represent the complexity of the mind are few.
A clear representation of the human complexity into
a computing agent needs to be built from theories in
psychology of disasters and techniques in artificial in-
telligence simulation. In addition, it is important to
complement the information available with data from
real events to verify and validate models of behavioral
and urban simulation. In the case of tsunami evacua-
tion models, using data from one of the most recorded
events, 2004 IOT or 2011 GEJT, can be conducted
to benefit the validation and improvements of cur-
rent models. In this paper, we highlighted the impor-
tance of tsunami evacuation simulation through case
TsunamiEvacuationSimulation-CaseStudiesforTsunamiMitigationatIndonesia,ThailandandJapan
253

studies of practical application in Indonesia, Thailand
and Japan. Tsunami evacuation feasibility, casualty
estimation, bottleneck identification, shelter alloca-
tion and other applications were modeled to support
tsunami mitigation activities.
ACKNOWLEDGEMENTS
We express our deep appreciation to JST-JICA
SATREPS projects, the Ministry of Education, Cul-
ture, Sports, Science and Technology (MEXT) in
Japan, and the International Research Institute of Dis-
aster Science (IRIDeS) at Tohoku University, Japan
for their support.
REFERENCES
Bernard, E., Mofjeld, H. O., Titov, V. V., Synolakis, C. E.,
and Gonz
´
alez, F. I. (2006). Tsunami: scientific fron-
tiers, mitigation, forecasting and policy implications.
Philosophical transactions of The royal Society. Se-
ries A, Mathematical, physical, and engineering sci-
ences, 364(1845):1989–2007.
Fujioka, M., Ishibashi, K., Kaji, H., and Tsukagoshi, I.
(2002). Multi agent Simulation Model for Evaluat-
ing Evacuation Management System Against Tsunami
Disaster. Journal of Architecture, Planning and Envi-
ronmental Engineering, 562:231–236.
Imamura, F. (1996). Review of tsunami simulation with a
finite difference method. In Yeh, H., Liu, P., and Syno-
lakis, C. E., editors, Long-Wave Runup Models, pages
25–42. World Scientific Publishing Co., Singapore.
Imamura, F., Muhari, A., Mas, E., Pradono, M. H., Sugi-
moto, M., and Post, J. (2012). Tsunami Disaster Mit-
igation by Integrating Comprehensive Countermea-
sures in Padang City, Indonesia. Journal of Disaster
Research, 7(1).
Japan Meteorological Agency (JMA) (2013). Lessons
learned from the tsunami disaster caused by the 2011
Great East Japan Earthquake and improvements in
JMA ’ s tsunami warning system October 2013 Japan
Meteorological Agency. Technical Report October,
Japan Meteorological Agency (JMA).
Kato, S., Shimozono, T., and Okayasu, A. (2009). Hy-
brid Simulation for Tsunami Evacuation in Consider-
ation of Individual Behaviors. Journal of Japan Soci-
ety of Civil Engineers, Ser. B2 (Coastal Engineering),
65(1):1316–1320.
L
¨
ammel, G., Rieser, M., Nagel, K., Taubenb
¨
ock, H., Strunz,
G., Goseberg, N., Schlurmann, T., Kl
¨
upfel, H., Se-
tiadi, N., and Birkmann, J. (2010). Emergency Pre-
paredness in the case of a Tsunami - Evacuation Anal-
ysis and Traffic Optimization for the Indonesian city
of Padang. In Klingsch, W., Rogsch, C., Schad-
schneider, A., and Schreckenberg, M., editors, Pedes-
trian and Evacuation Dynamics 2008, pages 171–182.
Springer, Berling Heidelberg.
Mas, E., Adriano, B., and Koshimura, S. (2013a). An In-
tegrated Simulation of Tsunami Hazard and Human
Evacuation in La Punta , Peru. Journal of Disaster
Research, 8(2):285–295.
Mas, E., Suppasri, A., Imamura, F., and Koshimura, S.
(2012). Agent-based Simulation of the 2011 Great
East Japan Earthquake / Tsunami Evacuation : An In-
tegrated Model of Tsunami Inundation and Evacua-
tion. Journal of Natural Disaster Science, 34(1):41–
57.
Mas, E., Suppasri, A., Srivihok, P., and Koshimura, S.
(2013b). Feasibility of Evacuation at the Pakarang
Cape in Thailand based on Tsunami Inundation Model
and Human Evacuation Simulation. In 10th Interna-
tional Conference on Urban Earthquake Engineering,
pages 1–6, Tokyo, Japan.
Meguro, K. and Oda, K. (2005). Development of Evacua-
tion Simulator for Tsunami Disaster Mitigation. Pro-
duction Research, 57(4):343–347.
Murakami, H., Takimoto, K., and Pomonis, A. (2012).
Tsunami Evacuation Process and Human Loss Distri-
bution in the 2011 Great East Japan Earthquake - A
Case Study of Natori City , Miyagi Prefecture -. In
15th World Conference on Earthquake Engineering,
pages 1–10.
Shuto, N. (2009). Tsunami Research - Its Past, Present
and near Future -. In Proceedings of the Sixth In-
ternational Workshop on Coastal Disaster Prevention,
pages 1–24, Bangkok, Thailand.
Suppasri, A., Shuto, N., Imamura, F., Koshimura, S., Mas,
E., and Yalciner, A. C. (2012). Lessons Learned from
the 2011 Great East Japan Tsunami: Performance
of Tsunami Countermeasures, Coastal Buildings, and
Tsunami Evacuation in Japan. Pure and Applied Geo-
physics, 170(6-8):993–1018.
Suzuki, T. and Imamura, F. (2005). Simulation model of
the evacuation from a tsunami in consideration of the
resident consciousness and behavior. Journal of Japan
Society for Natural Disaster Science, 23(4):521–538.
Synolakis, C. E. and Bernard, E. N. (2006). Tsunami sci-
ence before and beyond Boxing Day 2004. Philosoph-
ical transactions. Series A, Mathematical, physical,
and engineering sciences, 364(1845):2231–65.
Takagi, H., Mas, E., and Koshimura, S. (2014). Analysis
of the evacuation behavior in Natori, Yuriage during
the Great East Japan Earthquake Tsunami. In An-
nual Meeting of the Tohoku Branch Technology Re-
search Conference, Japan Society of Civil Engineers,
volume 3, pages 2011–2012.
Wijerathne, M., Melgar, L., Hori, M., Ichimura, T., and
Tanaka, S. (2013). HPC Enhanced Large Urban
Area Evacuation Simulations with Vision based Au-
tonomously Navigating Multi Agents. Procedia Com-
puter Science, 18:1515–1524.
Wilensky, U. (2001). Modeling Nature’s Emergent Patterns
with Multi-agent Languages. In EuroLogo, pages 1–9,
Linz, Austria.
SIMULTECH2014-4thInternationalConferenceonSimulationandModelingMethodologies,Technologiesand
Applications
254
