
A Simulation Framework for Analyzing Complex Infinitely
Repeated Games
Matthias Feldotto and Alexander Skopalik
Heinz Nixdorf Institute & Department of Computer Science, University of Paderborn
F
¨
urstenallee 11, 33102 Paderborn, Germany
Keywords:
Simulations, Algorithmic Game Theory, Infinitely Repeated Games, Stochastic Games, Evolutionary Game
Theory, Electronic Market, Composed Services, Reputation System.
Abstract:
We discuss a technique to analyze complex infinitely repeated games using techniques from the fields of game
theory and simulations. Our research is motivated by the analysis of electronic markets with thousands of
participants and possibly complex strategic behavior. We consider an example of a global market of composed
IT services to demonstrate the use of our simulation technique. We present our current work in this area and
we want to discuss further approaches for the future.
1 INTRODUCTION
The field of game theory has developed concepts and
methods that describe and predict the outcome of
strategic situations in which rationally acting individ-
uals interact. However, when analyzing large-scale
complex systems these methods quickly reach their
limits. Even for games without repetition and even in
games with few players the problem of determining
the outcome is computationally difficult (Daskalakis
et al., 2009; Chen et al., 2009). In games that are be-
ing played repeatedly the situation is even more unsat-
isfactory as the behavior of players is a lot more com-
plex than the mere choice of an action. This makes
the analysis of such games a daunting task even if
one imposes severe restrictions on allowed strategies
for the players. Therefore, we choose a simulation-
based approach to analyze settings of repeated strate-
gic interaction in complex scenarios. To that end, we
model the strategic behavior of players as algorithms
or automata which allow us to simulate the interaction
of many players with possibly many different strate-
gies. The results of the simulations provide us with
information about the performances of strategies and
which of them are plausibly chosen in real-world sce-
narios. Our approach nicely complements experimen-
tal as well as theoretical methods.
Our research is motivated by the analysis of elec-
tronic markets with thousands of participants and
complex strategic behavior. We consider an example
of a global market of composed IT services (Happe
et al., 2013) to demonstrate the use of our simula-
tion technique. In this setting service providers of-
fer simple software services on an electronic market
platform. These services can dynamically and flexi-
bly be combined to more complex and individual ser-
vice compositions by service composers. An impor-
tant characteristic of this market model is a certain de-
gree of anonymity and information asymmetry. Ser-
vice providers may have an incentive to exert low ef-
fort in providing their service, resulting in lower pro-
duction cost and lower quality. The service composer
would have to predict a service provider’s choice of
effort although he might not even be able to observe it
in hindsight. We seek to understand the impact of this
asymmetric information on the quality of the services
and how it can be improved by market mechanisms
like reputation systems (Brangewitz et al., 2014).
We explore the capabilities and limitations of such
simulations by performing an exhaustive search over
the strategy space of repeated games with finite au-
tomata, also known as machine games (Rubinstein,
1998; Rubinstein, 1986). Similar evaluations have
already been investigated (Axelrod, 1984; Izquierdo
and Izquierdo, 2006; Pence and Buchak, 2012), but
they all concentrated on simple game scenarios like
the Repeated Prisoner’s Dilemma. In the following
we present our underlying model and the simulation
framework before we discuss the results of several
simulated scenarios.
625
Feldotto M. and Skopalik A..
A Simulation Framework for Analyzing Complex Infinitely Repeated Games.
DOI: 10.5220/0005110406250630
In Proceedings of the 4th International Conference on Simulation and Modeling Methodologies, Technologies and Applications (SIMULTECH-2014),
pages 625-630
ISBN: 978-989-758-038-3
Copyright
c
2014 SCITEPRESS (Science and Technology Publications, Lda.)

2 MODEL
We consider the model of an infinitely repeated game
G = (N, Q, (A
i
)
i∈N
, δ, (u
i
)
i∈N
) consisting of a set of
n players N = {1, . . . , n}, a set of states Q, for each
player i ∈ N a set of actions A
i
, a transition probabil-
ity function δ : Q × A
1
× . . . × A
n
× Q → [0, 1] and for
each player i a utility function u
i
: Q×A
1
×. . . ×A
n
→
R (Luce and Raiffa, 1957; Aumann, 1959; Shapley,
1953). The strategic behavior or strategy of a player
is a function or algorithm that maps the history of the
game to the player’s next action. Which information
about the history each player observes, how much
memory he possesses and which computations he is
able to perform is left open here. Thus, this defini-
tion captures simpler models like positional games or
stochastic games as well as more complex models like
machine games (Rubinstein, 1998; Rubinstein, 1986).
We model the introduced market scenario as such
a repeated game that proceeds in rounds. In each
round a service composer is asked to compose a cer-
tain service product. That is, he has to choose a set
of services (out of a collection of possible choices)
and composes the final product. The service providers
which have been chosen by the composer can decide
how much effort they exert in delivering their ser-
vices. For simplicity we assume only two possible
levels, high and low. The utility of a service provider
is 20 if he only exerts low effort, 10 for high effort and
0 if he is not chosen by the composer. Each service
composition consists of multiple services and, thus,
its quality depends on the aggregated service quali-
ties. Here we assume that the quality of a service
composition is good if and only if each service was
delivered with high quality. The realized quality of
the composition can be correctly observed with a cer-
tain probability, which we chose to be 95% in our sim-
ulations. We implicitly assume that a player’s reputa-
tion depends on the observed quality of the services
he participated in during the past rounds. We assign
to each player a reputation vector of fixed length (in
our example it will be two or three) storing the past
(two or three) observed qualities. Note that the repu-
tation depends on the choices of all participating ser-
vice providers and the outcome of the random event of
the observation. The payoff of the composer depends
on his reputation and is 40 plus (minus) 10 for each
positive (negative) entry in his reputation vector. The
overall payoff of the repeated game is the discounted
reward with discount factor of 10% for each player.
In general, the strategy of a player is modeled by
a deterministic transition function s
i
: Q → A
i
which
determines the player’s next action, depending on
the current observed state. Here, we assume that a
player’s observable state is only his last reputation
values. Thus, the class of transition functions is re-
stricted to functions that do not differentiate between
states with the same reputation values.
3 SIMULATOR
3.1 Simulation Architecture
The simulator is a packaged Java application. This
allows an execution on nearly every available execu-
tion environment nowadays without concerning any
system-specific properties. In essence, the application
consists of two modules (cf. Fig. 1).
Simulation Round
Scenario Player
Configurator
ListenerStrategy
Runner
Figure 1: The simulation architecture.
The first one is responsible for the execution of the
simulation. It consumes the input and starts the simu-
lations with the correct settings in the Runner and the
Configurator components. As input an XML descrip-
tion of the scenario together with further individual
properties yields. Furthermore, a Simulation and a
Round component handle all simulation- and round-
relevant aspects. A Listener component is responsi-
ble for collecting results and produces csv output files
with relevant data like the players’ utilities.
As the second module we have the concrete appli-
cation scenario, in our case the market for composed
services. The most important components here are the
Scenario, the Player and the Strategy. This last mod-
ule can be replaced by any other scenario implemen-
tation, for example the well-known and extensively
investigated Repeated Prisoner’s Dilemma (Axelrod,
1984) or a completely new designed scenario.
3.2 Simulation Workflow
The simulation is entirely integrated in an automated
workflow. Beginning with an input all required pro-
cessing steps are executed until the output is gener-
ated (cf. Fig. 2). The input consists of four parts:
• a general configuration which defines the scenario
and all fixed parameters given as XML file,
• a list of parameters from which all combinations
are evaluated in comparison,
• a list of possible strategies for each player in the
scenario from which all strategy combinations are
evaluated, and
SIMULTECH2014-4thInternationalConferenceonSimulationandModelingMethodologies,Technologiesand
Applications
626
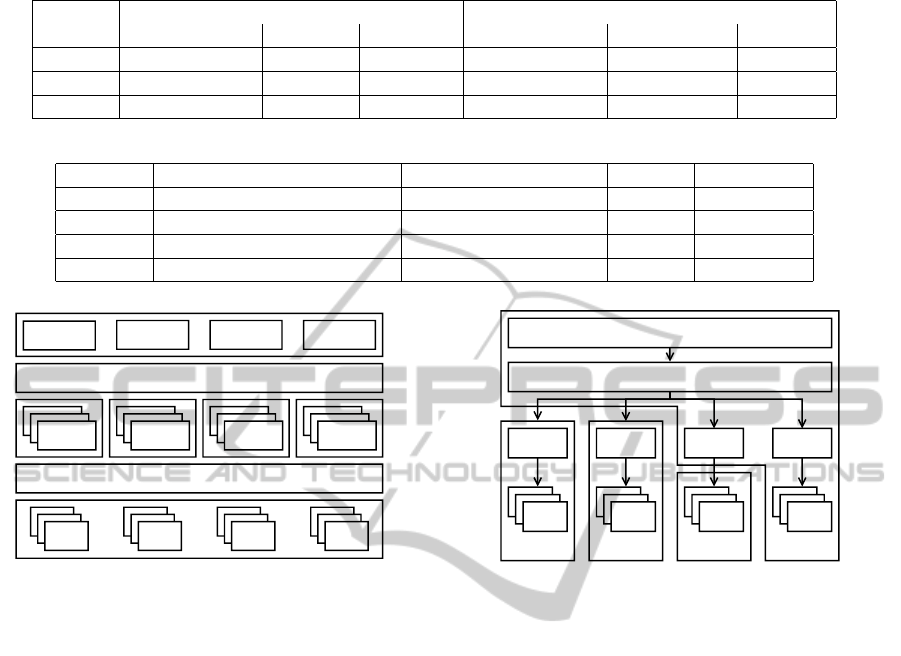
Table 1: Runtime and memory complexity of evaluations (The numbers written in italics are predicted).
Players
2 reputation values 3 reputation values
Combinations Memory Runtime Combinations Memory Runtime
2 256 2MB 30.17sec 65,536 0.32GB 0,09h
3 4,096 21MB 232.18sec 16,777,216 96.07GB 8,54h
4 65,536 375MB 344.19sec 4,294,967,296 24,594.88GB 2186,37h
Table 2: Four evaluated scenarios with 2, 3 and 4 deterministic strategic players.
Scenario Composition Service Provider Players Reputation
1 composition of all 2 deterministic players 2 3 values
2 choose best one 2 deterministic players 2 3 values
3 choose best pair 3 deterministic players 3 3 values
4 choose with one monopolist 3 deterministic players 4 2 values
*.csv *.plt *.png *.pdf
*.csv
*.csv
*.plt
*.plt
*.png
*.png
*.pdf
*.pdf
Configuration
Parameters Strategies Settings
Preprocessing
Postprocessing
Simulation
Simulation
Simulation
Simulation
Simulation
Simulation
Simulation
Simulation
Simulation
Simulation
Simulation
Simulation
Figure 2: The simulation workflow.
• a list of additional settings for the simulation, i. e.,
the number of random seeds, the connection pa-
rameters for external clusters, etc.
The preprocessing step reads the inputs and gener-
ates all simulation configurations necessary for inde-
pendent simulations (cf. Sec. 3.1). The execution step
produces execution packages, distributes them on dif-
ferent available environments (see Sec. 3.3) and col-
lects the results as soon as they are finished. After-
wards, the postprocessing step consumes the output
of the different simulations and aggregates them ac-
cording to different aspects. In the end, it produces
tables with the measured values (*.csv), ready-to-use
graphics for presentation (*.png), and papers (*.pdf )
and generation scripts (*.plt) to manually adapt the
graphics with gnuplot (Williams and Kelley, 2012).
3.3 Simulation Environment
The simulation environment consists of two parts: On
the one hand, the application running on a dedicated
virtual server and, on the other hand, different exter-
nal machines for running the simulations (cf. Fig. 3).
The application itself has two parts: a front-end
managing the user input and output as well as a back-
end responsible for the simulation workflow. The
VM
HPC
Back-end - Batch job
Front-end - Web application
Node
Node
Node
HTC
VM
VM
VM
Pool
PC
PC
PC
Front-end Front-end Scheduler
Task
Task
Scheduler
Task
Figure 3: The available simulation environment.
front-end is running as web application based on the
Java Spring Framework. Therefore, the user can han-
dle the simulations through a responsive HTML5 web
interface from any device and has not to touch more
technical parts. The back-end based on the Spring
Batch manages the simulation workflow and is espe-
cially responsible for the pre- and postprocessing of
the simulations as well as the distribution of the ac-
tual simulations. For this purpose four different ap-
proaches are implemented:
VM: The simulations run on the same virtual ma-
chine as the application itself in different threads,
therefore a scheduler is integrated.
Pool: The simulations run on other desktop machines
available in a pool. Also for this purpose, a sched-
uler exists in the application and the transfer of
data is managed via the SSH protocol.
HTC: The simulations run on different virtual ma-
chines in a High Throughput Cluster. An existing
front-end can be accessed via SSH and is respon-
sible for the scheduling.
HPC: The simulations run on nodes in a High Perfor-
mance Computing cluster. Also for this purpose a
front-end exists to allocate the computation time.
While the first two approaches are completely
self-developed and independent of any environment,
ASimulationFrameworkforAnalyzingComplexInfinitelyRepeatedGames
627
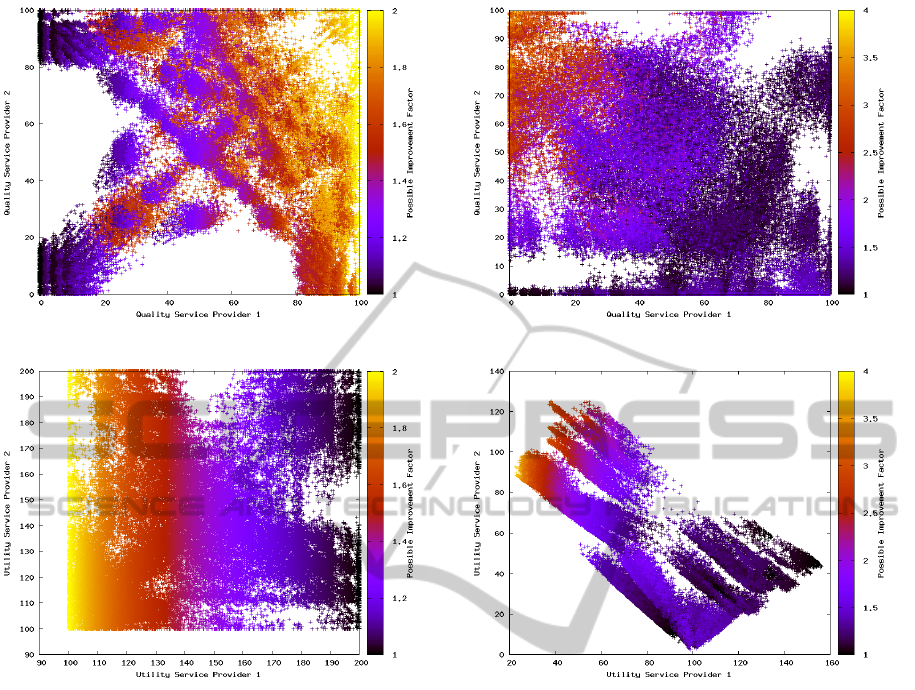
Figure 4: Scenario 1: The quality of two service providers.
Figure 5: Scenario 1: The payoff of two service providers.
the latter two use existing managing approaches avail-
able in computing centers. They offer the advan-
tage that the available computing time and memory
is much higher and allow clearly more simulations in
the same time.
4 EVALUATIONS
In this section we investigate the capabilities and lim-
itations of our tool by evaluating the market scenario.
We start by investigating the possible scenarios for
evaluation. Concentrating only on one strategy pro-
file, i.e., one combination of strategies, the simulation
framework allows very complex scenarios.
However, for the analysis of strategic games and
their outcomes we have to take into account all pos-
sible strategy profiles that may be chosen by the
players. Traditionally, game theory is interested in
equilibria which are strategy profiles in which ev-
ery player has chosen his optimal strategy given the
choices of all other players. As the number of possible
Figure 6: Scenario 2: The quality of two service providers.
Figure 7: Scenario 2: The payoff of two service providers.
strategies grows exponentially with the size of the au-
tomata and, moreover, the number of strategy profiles
grows exponentially with the number of players, eval-
uating all strategy profiles by simulations quickly be-
comes intractable (cf. Table 1). Already by using only
4 strategic players and a state space with 3 history val-
ues, running on a cluster with 100 available parallel
computing nodes can not be simulated with reason-
able time and space input. Thus, we first demonstrate
our tool with a few small examples before we discuss
further research beyond a mere exhaustive search.
Therefore, we consider 4 different scenarios with
2, 3 and 4 strategic players (see Table 2). Scenario
1 and 2 contain two service providers acting accord-
ing to a deterministic transition function. In the first
scenario, the composed service contains both separate
service components, whereas in the second scenario
only the best service (regarding the past reputation
values) is included in the product. In the third sce-
nario, three deterministic service providers are avail-
able and the composition consists of the two best ser-
vices. The last scenario is an extension of scenario
3. There are 3 deterministic service providers, but the
SIMULTECH2014-4thInternationalConferenceonSimulationandModelingMethodologies,Technologiesand
Applications
628
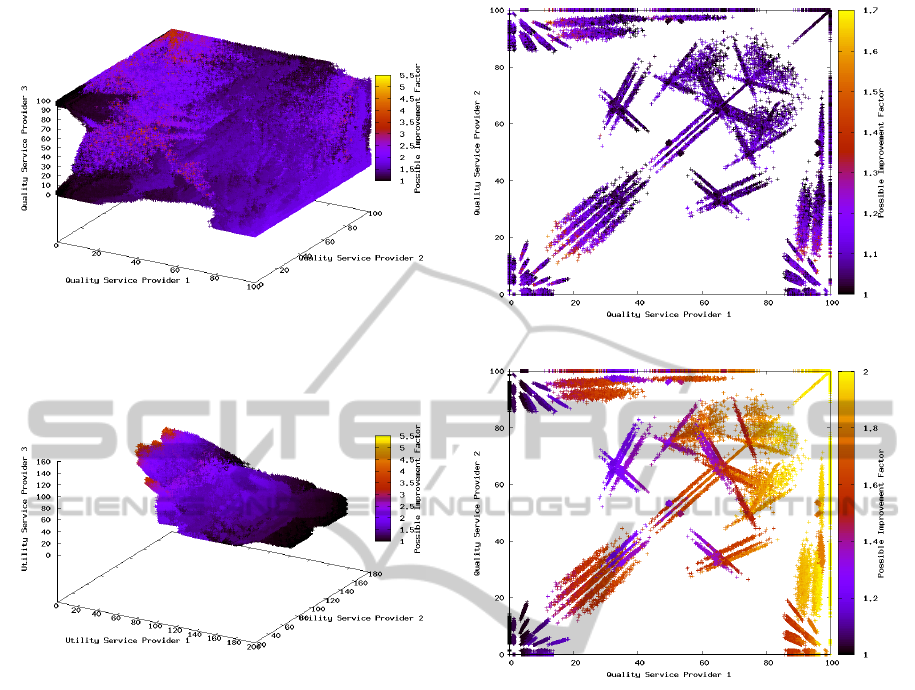
Figure 8: Scenario 3: The quality of three service providers.
Figure 9: Scenario 3: The payoff of three service providers.
composition is also chosen by a player. Furthermore,
one of the providers is fixed (it has a monopoly) and
the choice is only between the other two.
All simulations are run for 100 rounds with 20 dif-
ferent initial seeds to get usable statistic results. In the
following plots we compare the quality and the dis-
counted utility of different providers together with the
possible improvement factor of the first player visual-
ized by the color. The incentive to change the strategy
is higher in the brighter areas. In the first scenario
in which both services are used for the combination
we see two dark areas in the lower left and upper left
corner of the plot (cf. Fig. 4). The service provider
cannot improve its utility by serving higher quality.
Furthermore, we can see in Fig. 5 that the player has
all equlibria with high utility values.
In contrast, scenario 2 has another result. Here, al-
ways playing with a bad quality is not the best choice
for the player (see Fig. 6). He has to cooperate and
serve a better quality to be chosen. Furthermore, the
equilibria are not with high utility values, states where
no improvement can be reached are also found in the
lower utility area (see Fig. 7). In the third scenario
Figure 10: Scenario 4: The quality of two service providers.
Figure 11: Scenario 4: The quality of two service providers.
with three players we see similar results (cf. Fig. 8
and Fig. 9). Multiple areas with equilibria exist where
no improvement for a single player is possible. A bet-
ter analysis is possible by using 3D visualization tools
with user interaction.
In the last scenario a monopolist and two other ser-
vice providers are put together into compositions. We
see a difference between the stable strategies of the
monopolist (cf. Fig. 10) and the other providers (cf.
Fig. 11). The monopolist is always in a nearly stable
situation, not depending on its served quality. How-
ever, the other provider has only small stable areas.
The simulation framework helps us to study re-
peated games where the theoretic analysis is too com-
plex and experimental data is not available. We can
identify equilibria and stable strategies which are a
plausible explanation of players’ behavior. For the
design of the electronic market and supporting market
infrastructure (e.g., reputation systems), we can eval-
uate possible solutions in various different scenarios.
ASimulationFrameworkforAnalyzingComplexInfinitelyRepeatedGames
629

5 CONCLUSIONS AND FUTURE
WORK
Not surprisingly, an exhaustive search over all strat-
egy profiles quickly becomes intractable – even if one
considers only strategies implemented by automata
with very few states. Nevertheless, simulations give
us interesting insights about the outcomes of strategic
behavior in complex scenarios like the presented elec-
tronic market. By identifying equilibria and strategies
with high utilities and low incentive to change, use-
ful statements about the development of markets can
be done and the impact of mechanisms like reputa-
tion systems can be studied before their implementa-
tion. However, we are interested in even more real-
istic scenarios which allow players with more mem-
ory and more complex functions including random-
ization. A promising direction is the use of techniques
from evolutionary game theory which uses a popu-
lation of strategies, each additionally equipped with
a fitness value. Utilizing replication and imitation
dynamics (Weibull, 1997; Taylor and Jonker, 1978;
Hofbauer and Sigmund, 1998), the population and
the fitness values evolve over time. The concept of
evolutionary equilibria (Hirshleifer and Rubin, 1982)
and evolutionary stable strategies (ESS) (Smith and
Price, 1973) describe states and strategies which are
(approximately) stable with respect to the aforemen-
tioned dynamics. The simulation architecture pre-
sented here is easily adaptable towards such concepts
and the computational results show that hundreds or
even thousands of such experiments can be conducted
in a very short time.
ACKNOWLEDGEMENTS
This work was partially supported by the German
Research Foundation (DFG) within the Collabora-
tive Research Center “On-The-Fly Computing” (SFB
901), by the EU within FET project MULTIPLEX un-
der contract no. 317532 and by the Paderborn Center
for Parallel Computing (PC
2
).
REFERENCES
Aumann, R. J. (1959). Acceptable Points in General Coop-
erative n-Person Games. Contributions to the Theory
of Games, 4:287–324.
Axelrod, R. (1984). The Evolution of Cooperation. Basic
Books.
Brangewitz, S., Jungmann, A., Platenius, M. C., and Petrlic,
R. (2014). Towards a Flexible and Privacy-Preserving
Reputation System for Markets of Composed Ser-
vices. In Proceedings of the 6th International Con-
ferences on Advanced Service Computing (SERVICE
COMPUTATION).
Chen, X., Deng, X., and Teng, S.-H. (2009). Settling the
Complexity of Computing Two-player Nash Equilib-
ria. J. ACM, 56(3):14:1–14:57.
Daskalakis, C., Goldberg, P. W., and Papadimitriou, C. H.
(2009). The Complexity of Computing a Nash Equi-
librium. SIAM J. Comput., 39(1):195–259.
Happe, M., Kling, P., Plessl, C., Platzner, M., and Meyer
auf der Heide, F. (2013). On-The-Fly Computing: A
Novel Paradigm for Individualized IT Services. In
Proceedings of the 9th IEEE Workshop on Software
Technology for Future embedded and Ubiquitous Sys-
tems (SEUS). IEEE Computer Society.
Hirshleifer, J. and Rubin, P. H. (1982). Evolutionary Models
in Economics and Law. Jai Press.
Hofbauer, J. and Sigmund, K. (1998). Evolutionary Games
and Population Dynamics. Cambridge University
Press.
Izquierdo, S. S. and Izquierdo, L. R. (2006). On the Struc-
tural Robustness of Evolutionary Models of Coopera-
tion. In Intelligent Data Engineering and Automated
Learning–IDEAL 2006, pages 172–182. Springer.
Luce, R. D. and Raiffa, H. (1957). Games and Decisions:
Introduction and Critical Surveys. Wiley New York.
Pence, C. H. and Buchak, L. (2012). Oyun: A New,
Free Program for Iterated Prisoner’s Dilemma Tour-
naments in the Classroom. Evolution: Education and
Outreach, 5(3):467–476.
Rubinstein, A. (1986). Finite Automata Play the Repeated
Prisoner’s Dilemma. Journal of Economic Theory,
39(1):83–96.
Rubinstein, A. (1998). Modeling bounded rationality, vol-
ume 1. MIT press.
Shapley, L. S. (1953). Stochastic Games. Proceedings of
the National Academy of Sciences of the United States
of America, 39(10):1095.
Smith, J. M. and Price, G. (1973). The Logic of Animal
Conflict. Nature, 246:15.
Taylor, P. D. and Jonker, L. B. (1978). Evolutionary Stable
Strategies and Game Dynamics. Mathematical Bio-
sciences, 40(1):145–156.
Weibull, J. W. (1997). Evolutionary Game Theory. MIT
press.
Williams, T. and Kelley, C. (2012). gnuplot 4.6: An Inter-
active Plotting Program. http://www.gnuplot.info.
SIMULTECH2014-4thInternationalConferenceonSimulationandModelingMethodologies,Technologiesand
Applications
630
