
Improving Lidar Data Evaluation for Object Detection and Tracking
Using a Priori Knowledge and Sensorfusion
David Wittmann, Frederic Chucholowski and Markus Lienkamp
Lehrstuhl f
¨
ur Fahrzeugtechnik, Technische Universit
¨
at M
¨
unchen, Munich, Germany
Keywords:
Object Detection, Tracking, Lidar, Sensor Evaluation, Sensor Fusion, A Priori Knowledge.
Abstract:
This paper presents a new approach to improve lidar data evaluation on the basis of using a priori knowledge.
In addition to the common I- and L-shapes, the directional IS-shape, the C-shape for pedestrians and the
E-shape for bicycles are introduced. Considering the expected object shape and predicted position enables
effective interpretation even of poor measurement values. Therefore a classification routine is utilized to
distinguish between three classes (cars, bicycles, pedestrians). The tracking operation with Kalman filters is
based on class specific dynamic models. The fusion of radar objects with the used a priori knowledge improves
the quality of the lidar evaluation. Experiments with real measurement data showed good results even with a
single layer lidar scanner.
1 INTRODUCTION
The computational detection and interpretation of the
environment in traffic scenes have become more and
more important in recent years. An increasing amount
of advanced driver assistance systems (ADAS) utilize
environmental data, e.g. collision warning or lane de-
tection systems. Among radar sensors, ultrasonic sen-
sors, cameras and others, lidar-sensors are typically
used for perceiving the automobile’s environment.
Lidar scanners produce distance measurement val-
ues without providing any further information. To
process these, there are generally two different ap-
proaches for lidar data evaluation. The first is based
on an occupancy grid map created using simultane-
ous localization and mapping (SLAM) techniques (Vu
et al., 2007). Dynamic objects can then be identified
by comparing the lidar measurement with the calcu-
lated occupancy grid map.
The second approach usually consists of two sep-
arate steps: 1) the extraction of geometric features
in the lidar measurements and 2) a tracking based
on these features. The identification of relevant ob-
jects in the cloud of measurement values is a chal-
lenging task and has been covered in numerous pub-
lications (Fortin et al., 2012),(Kaempchen et al.,
2005),(Lindl, 2008),(Sparbert et al., 2001),(Mendes
et al., 2004),(Fayad and Cherfaoui, 2007),(Fuersten-
berg et al., 2003). The detection of vehicles is
mainly based on the assumption of an almost rect-
angular shape. Therefore, the measurement values
are searched for characteristic line segments. Fortin
(Fortin et al., 2012) presents a feature extraction
method based on geometric invariants. Kaempchen
(Kaempchen et al., 2005) has improved this procedure
by differentiating between different object representa-
tions. Cars appear in the lidar data in the form of the
characteristic object I-, U- and L-shapes, which can
be fitted into the measurement values to find possible
objects. These characteristic shapes are then tracked
over several time steps.
Sometimes, object points cannot be detected for
several reasons, e.g., reflections of the laser beam,
dark surfaces in combination with great distances, oc-
clusion of the object or angular resolution. Within
these corrupted measurements, a meaningful feature
extraction is often not possible because there are no
characteristic shapes or the shapes have changed.
We have now developed a novel approach to use
the knowledge about tracked objects from previous
measurement steps and other sensors to evaluate the
raw data.
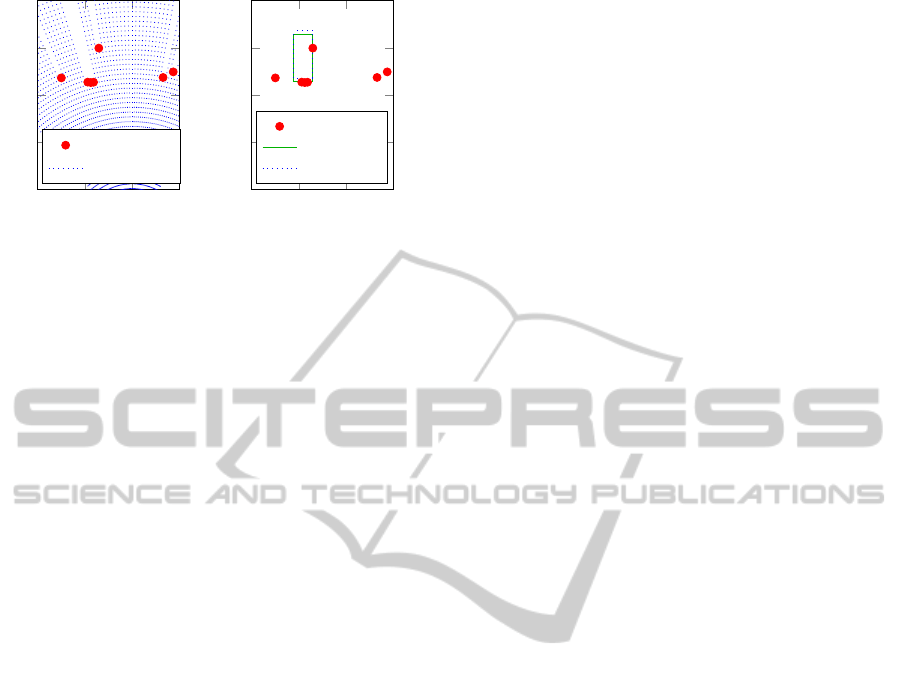
This is illustrated in figure 1(a), which shows an
extract of lidar measurements from a real traffic scene.
Without any further information, the scene is difficult
to interpret. But considering the object position and
dimensions from previous steps, the actual position
of the object, an oncoming car, can be evaluated, as
shown in figure 1(b). The novelty of our approach
consists of the usage of the a priori knowledge di-
794
Wittmann D., Chucholowski F. and Lienkamp M..
Improving Lidar Data Evaluation for Object Detection and Tracking Using a Priori Knowledge and Sensorfusion.
DOI: 10.5220/0005117707940801
In Proceedings of the 11th International Conference on Informatics in Control, Automation and Robotics (ICINCO-2014), pages 794-801
ISBN: 978-989-758-039-0
Copyright
c
2014 SCITEPRESS (Science and Technology Publications, Lda.)
−5
0
5
10
5
10
15
20
25
y-axis [m]
x-axis [m]
raw data
lidar beams
(a) only raw data
−5
0
5
10
5
10
15
20
25
y-axis [m]
x-axis [m]
raw data
meas. pos.
old pos.
(b) with a priori knowledge
Figure 1: a) A lidar measurement insufficient for effective
feature extraction and b) interpretation by using a priori
knowledge.
rectly on the raw measurement values. Thus the corre-
sponding measurement values can be interpreted cor-
rectly and used for the object update, even if there
were only very few points detected on the object and
therefore no features are extractable with common li-
dar interpretation approaches. If a priori knowledge
about an object is not available, a common approach
is used as explained in section 3.3.
Before the single steps and models of the devel-
oped approach are explained in detail, the modeling
of traffic participants is described in 2. The novel li-
dar evaluation routine is presented in section 3, the
classification of traffic participants in 4 and the track-
ing management in section 5. In section 6 the sensor-
fusion with the radar sensor is described. The paper
finishes with an explanation of some experimental re-
sults and a conclusion.
2 OBJECT MODELS
Mathematical models for the geometry and the dy-
namics of the objects are necessary for detection and
tracking. For a more precise description, we differen-
tiate between three classes of traffic participants: cars,
bicycles and pedestrians, and a class “unknown” for
not yet classified objects.
2.1 Dynamic Models
To describe the dynamics of car objects, it is assumed
that only movement heading in forward direction is
possible. Therefore the approximated middle of the
rear axis is chosen as a reference point. The object
state is described by the position x, y, velocity v, ac-
celeration a, orientation ψ and yaw rate
˙
ψ. Lindl
(Lindl, 2008) describes the derivation of the equation
of motion with respect to the mentioned constraints.
The resulting difference equation is simplified for an
efficient modeling of the dynamics, leading to
x
k
=
x
y
ψ
v
˙
ψ
a
k
= x
k−1
+
cos(ψ)v∆T
sin(ψ)v∆T
˙
ψ∆T
a∆T
0
0
. (1)
∆T describes the length of a time step and corre-
sponds to the time difference between two consecu-
tive lidar measurements.
The dynamics of bicycles are modeled on the
same assumption that motion is only possible in for-
ward direction and therefore lead to the same move-
ment model (1).
Pedestrians can move independently from their
heading direction. Therefore the dynamics are mod-
eled with a simple point mass model, allowing inde-
pendent movement in both coordinate directions:
x
y
v
x
v
y
k
=
1 0 ∆T 0
0 1 0 ∆T
0 0 1 0
0 0 0 1
x
y
v
x
v
y
k−1
(2)
As pedestrians rarely show longer maneuvers with a
specific acceleration, the movement model only in-
cludes the velocities. Abrupt velocity changes typi-
cal for pedestrian movement can be adequately repre-
sented with the process noise and so no further states
are required for the modeling.
The dynamics of objects, which are not (yet) clas-
sified, are modeled as in (2) but extended by the ori-
entation, which is necessary for the car and bicycle
representations.
2.2 Geometric Models
The car class covers most vehicles as cars and buses.
As geometric representation a rectangular contour is
assumed, which is common practice ((Kaempchen
et al., 2005), (Lindl, 2008)) and eligible for most cars
and buses. The complete contour of these objects thus
can be described by five variables
x
shape,c
= [x, y, ψ, l, w]
T
. (3)
Here, x, y represent the position, ψ the orientation and
l, w the length and width of the object. Due to the op-
erational principle of the lidar scanner, a maximum of
two sides of the rectangular contour can be detected
in one scan. Thus, characteristic I- and L-shapes are
found in the measurement data. By describing the
expected positions of the measurement values, these
shapes play an important role in the evaluation.
ImprovingLidarDataEvaluationforObjectDetectionandTrackingUsingaPrioriKnowledgeandSensorfusion
795

LIDAR raw data
Segmentation
Update known objects
objects
Detection of new
objects
Track management
Classification
Figure 2: Overview over the essential steps of the presented
approach including the feedback of the object information.
Bicycles have no such characteristic shape which
can easily be found in the lidar measurements.
Through the permeable structure of a bicycle and the
changing foot positions the resulting detected values
cannot be foreseen. Consequently, the common ap-
proach to feature detection has its limits.
However, the presented approach is not absolutely
reliant on such characteristics and therefore also al-
lows the tracking of bicycles. Based on real lidar
measurements of bicyclists, we found that these can
be represented best by an ellipse with arbitrary mea-
surement points inside. This can be represented with
the same variables as in equation (3), where l and w
now describe the length of the ellipse axes.
Similar to bicycles, pedestrians do not result in a
characteristic shape in the lidar data. However due
to their small dimension they can be identified and
differentiated from background objects more easily.
That’s why they can be tracked using the common ap-
proach as can be seen in (Kaempchen et al., 2005)
or (Lindl, 2008). Accordingly, pedestrians are repre-
sented by circular shapes which can be described with
just three variables:
x
shape, p
= [x, y, r]
T
. (4)
Here x, y represent the position and r the radius. Be-
cause of their independent moving no orientation is
needed.
3 Lidar EVALUATION
As can be seen in figure 2 the presented approach con-
sists of several separate steps. This section describes
how the lidar data is processed, corresponding to the
three steps segmentation, evaluation of known objects
and the detection of new objects.
3.1 Segmentation
Motivated by the high number of measurement values
created by lidar scanners, a preprocessing of the data
is used. Since consecutive processing steps are based
directly on the raw measurement values, only a rough
grouping is needed. The aim of this step is to group all
measurements belonging to the same real objects to-
gether. As in (Sparbert et al., 2001) or (Mendes et al.,
2004) the values are clustered using a simple distance
criterion. To keep processing as effective as possible,
the segmentation uses the raw polar coordinates pro-
vided by the lidar scanner. A geometrically motivated
threshold is used, considering the increasing proba-
bility of non-detection with smaller angles between
the laser beams and the detected surface. We assume
that surfaces with an angle beneath 10 degrees are un-
likely to be detected. I.e. two consecutive measure-
ment points are grouped together if the angle between
them and the laser beam is greater than this threshold.
3.2 Evaluation of Known Objects
As announced in the introduction, the usage of a priori
knowledge to improve the lidar evaluation is the idea
of the presented approach. As can be seen in figure 2,
the a priori knowledge, consisting of known objects
from the last time step (dotted arrow), is combined
with the clustered raw data. To avoid information
loss, no further preprocessing is used than the seg-
mentation.
3.2.1 Projection of a Priori Knowledge
The information about old objects can include the ge-
ometric and dynamic information mentioned in sec-
tion 2. Apparently the quality of these variables de-
pend on the history and maybe not all of them could
be detected yet, e.g. the length of a car driving in
front. Based on the existing information about old
objects, the expected shape of these can be projected
to the actual coordinate system of the sensor. In addi-
tion to the motion of the own vehicle, it is necessary to
consider the motion of the objects. Information about
the dynamics instance to compensate the ego-motion
can be gained from the vehicle ESC controller. The
expected motion of the objects is calculated during
the filtering process.
3.2.2 Association
Next, the segments of lidar measurements are asso-
ciated to the expected shape of the known objects.
Therefore, it is tested whether the points of the seg-
ments lie within a reasonable area around the shape,
ICINCO2014-11thInternationalConferenceonInformaticsinControl,AutomationandRobotics
796
1234
10
11
12
13
y-axis [m]
x-axis [m]
raw data
predicted object
difference vectors
Figure 3: Evaluation of lidar raw data considering the pre-
dicted object shape leading to the deviations of the measure-
ment values used for the position update.
i.e. near the expected object border and on the view-
able side. To avoid unnecessary computations, only
segments are tested which lie within the same viewing
angle as the expected object. Ideally, every object is
associated with one segment, but through occlusions
or interrupted detection caused by partly insufficient
remission some objects could be represented by more
than one segment.
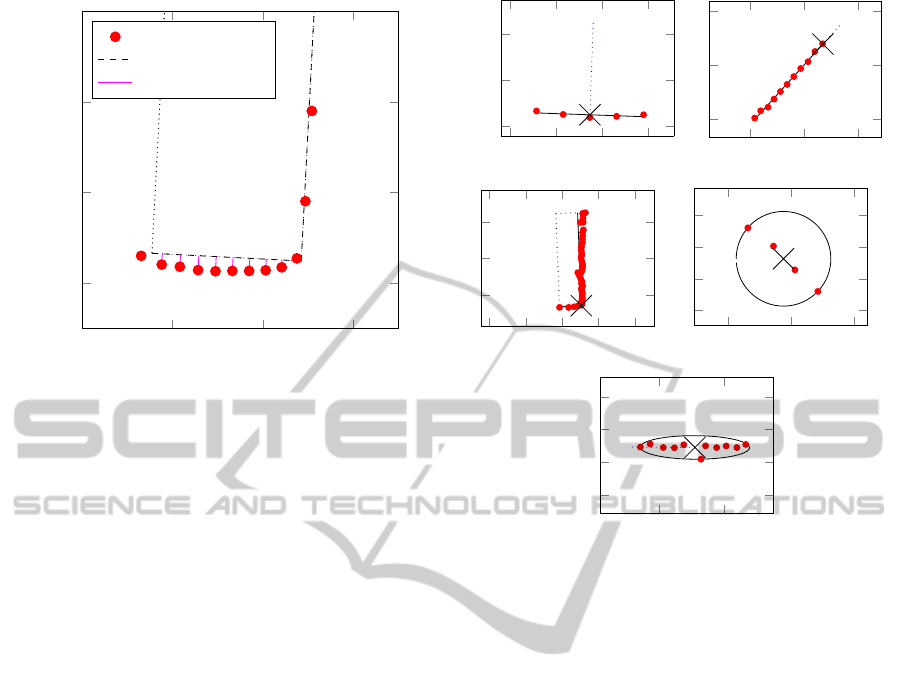
3.2.3 Detectable Shapes
The measurement values of the matching segments
are now interpreted considering the expected object
shape. Therefore it is more like a correction of the ex-
pected shape by means of the measured values. In fig-
ure 3 the situation of an oncoming car is shown with
the expected shape and the measured values. The li-
dar scanner position is in the origin of the coordinate
system and therefore only the two dashed black sides
of the shape are expected to be measured, whereas
no measurement values should appear on the dotted
back side. To take into account the limited visibility
of the car object contours, three shapes are differenti-
ated for the description of the expected measurement
values, the I-, the IS- and the L-shape as illustrated in
figure 4(a)-(c) with real measured lidar values. The
names of the I- and L-shapes correspond to the rep-
resented form. Consequently, the I-shape represents a
straight line in the measurement values and the ”L”
two perpendicular ones. These two are commonly
used ((Lindl, 2008), (Fayad and Cherfaoui, 2007)) to
represent the situation with one or two visible sides,
sometimes supplemented by a U-shape for a rounded
vehicle front or back (Kaempchen et al., 2005). Be-
−1.5
−1
−0.5
0
16.5
17
17.5
(a) I-shape
24
6
16
18
20
(b) IS-shape
24
6
810
2
4
6
(c) L-shape
−3.6
−3.4−3.2
4.4
4.5
4.6
4.7
(d) C-shape
34
7
7.5
8
8.5
(e) E-shape
Figure 4: Characteristic segment shapes of real measured
objects: a) back side of a car, b) side of a car, c) front and
side of a car, d) pedestrian, e) bicycle. All axes are in me-
ters and the lidar scanner is positioned in the origin of the
coordinate system.
cause of the rarity of such U-shapes in the examined
data, this shape was neglected. The developed ap-
proach, however, enables the usage of the novel IS-
shape, which is used for representing the side of a
car and therefore a distinction between side and rear
or front (I-shape) is possible. In figure 4 the dotted
line marks the expected movement direction of the
objects, which depicts the difference between (a) the
back side and (b) the side of a car. With the evaluation
of the lidar data being slightly different depending on
the considered shape, it is reasonable to make this
distinction due to the expected movement parallel or
perpendicular to the shape. As bicycles and pedestri-
ans are assumed to be detected as arbitrary distributed
points, these are only represented by the so called C-
shapes (cylinder), and E-shapes (ellipse) as in figure
4(d),(e).
3.2.4 Evaluation of Measurement
The aim of the lidar evaluation is to find the actual ge-
ometric object states defined in one of the equations
(3) and (4). Therefore the predicted shape, presented
in the last paragraphs, is compared with the corre-
sponding raw measurement values. By calculating the
ImprovingLidarDataEvaluationforObjectDetectionandTrackingUsingaPrioriKnowledgeandSensorfusion
797

deviations of the measurement values from the shape,
the object state can be corrected.
First the position difference is calculated by the
mean perpendicular distance of all corresponding
measurement values to one side, as shown in figure
3. In this example, the expected shape is too far away
because the velocity of the object was underestimated.
Moving the shape by the mean of the pink, solid dif-
ference vectors leads to an average match of the mea-
surement points. Note that most measurement values
correspond to only one side and therefore only those
difference vectors to the corresponding side are ac-
counted for. By using the perpendicular distance con-
sequently, only motion perpendicular to the car’s side
is considered. Therefore the same procedure is used
on the other visible side to get the measured object po-
sition. Obviously this is problematic for the one-sided
I- and IS-shapes. Especially for IS-shapes, movement
parallel to the shape is expected and is therefore mea-
sured through the motion of the shape ends. However,
this is not as precise as the difference measurement
because the beam directions of the lidar scanner lead
to a discrete measurement accuracy perpendicular to
the beams. Compared to the I-, IS- and L-shapes, the
position update for C- and E-shapes is relatively easy.
If the measured values match the dimension thresh-
olds defined for pedestrians or bicycles, the calculated
center of gravity is used as the position.
Second, the orientation of the measured shape is
determined. In case of an I-, IS-, L- or E-shape the
orientation is calculated using regression lines fitted
into the measurement points (cf. (Lindl, 2008)). To
avoid corruption through short sides and round object
shapes, some additional characteristics, such as side
lengths and matching quality of the corner point, are
considered. Especially the determination of the orien-
tation of bicycles is often problematic. In such cases,
the orientation is not measured using the lidar points
but determined during the filtering process.
Finally, the dimensions of the objects are adapted.
Therefore the dropped perpendicular bases of the end
points are taken into consideration. These are deter-
mined anyway at the same time as the heading cal-
culation. As the lidar scanner cannot detect the com-
plete dimensions of an object in every measurement
step because of occlusion or deficient remission, the
measured dimensions vary over time. To overcome
these deviations, the dimensions could be filtered as
in (Fayad and Cherfaoui, 2007). However, to pro-
hibit the shrinking of an object over time when it is
only partly detected, we simply keep the maximum of
measured and previous dimensions like in (Fuersten-
berg et al., 2003).
3.2.5 Changes in Representing Shapes
An important phenomenon when tracking dynamic
objects with lidar measurements is that the detected
shape varies depending on the orientation and dis-
tance to the lidar scanner. Since objects are repre-
sented here using five characteristic I-, IS-, L-, C- and
E-shapes, it is important to detect when another shape
fits better. This enables optimal interpretation of the
measurement values. A good example for chang-
ing representations is an overtaking car, whose shape
changes from “IS” to “L” and finally to “I”. To detect
such transitions, special areas around these shapes are
defined, e.g. for the IS-shape the area where the sec-
ond side is expected. If measurement points exist in-
side these regions, the shape is switched. This also
holds for the C- and E-shape, which normally change
when the dimensions of the tracked object exceeds the
thresholds for pedestrians or bicycles.
3.3 Detection of New Objects
At the beginning of the tracking process or if an ob-
ject enters the surveillance zone of the sensor, there is
no previous information available. Therefore the pre-
sented approach has to distinguish between the track-
ing of known objects, as presented in the previous sec-
tion, and the detection of new objects.
The sequence of the object processing is known
from figure 2. First, all known objects are processed
and only the unassociated segments are passed onto
the detection step. Here, possible traffic participants
have to be identified. This is done using the common
approach (Kaempchen et al., 2005), (Lindl, 2008),
where the measurement data is searched to identify
characteristic shapes. We try to find segments which
match the introduced C-, I-, IS- and L-shapes. The
first is characterized by a small expansion of 0.9m at
most and possibly represents a pedestrian. The lat-
ter have to be approximated with one or two regres-
sion lines respectively and the regression error has to
be below a threshold. Finally the dimensions of the
shapes have to match the tolerated dimensions of traf-
fic participants shown in table 1. Note that the bi-
cycle shape “E” is missing for the creation of new
objects. Since this shape is very unspecific, moti-
vated by the varying measurements of bicyclists, there
are not enough special characteristics to search for.
To avoid numerous false detections, this shape has
been excluded and bicycle objects are created through
shape changes of dynamic objects.
ICINCO2014-11thInternationalConferenceonInformaticsinControl,AutomationandRobotics
798
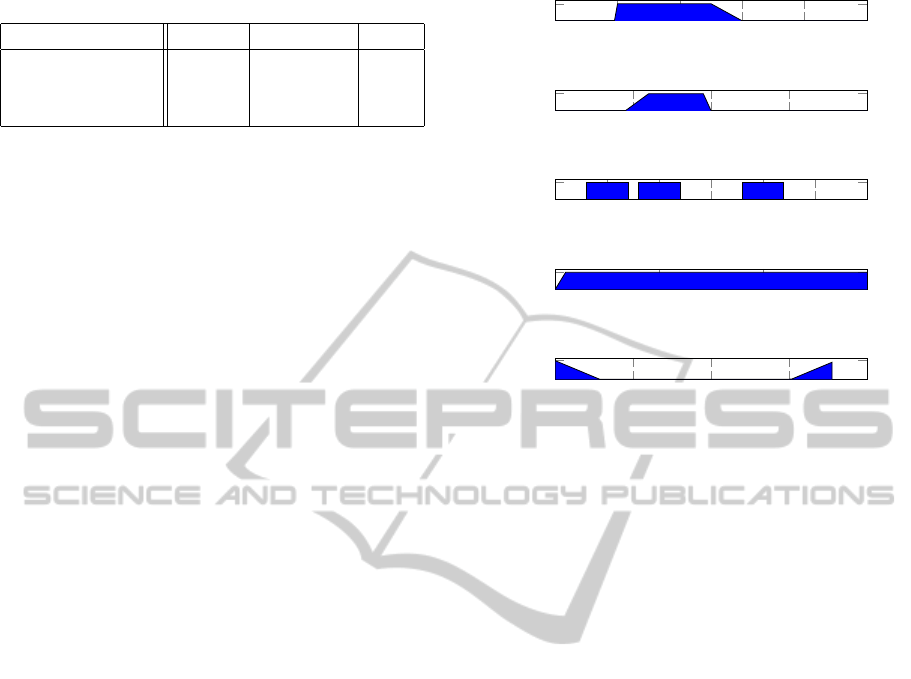
Table 1: Tolerated dimensions of traffic participants.
traffic participants length width shape
car, van 2 − 6m 0.9 − 2m I,IS,L
truck, bus 6 − 19m 0.9 − 3m I,IS,L
pedestrian - 0.25 − 0.9m C
4 CLASSIFICATION
With this approach, the four classes car, bicycle,
pedestrian and unknown are distinguished as men-
tioned in section 2. This enables both, an improved
tracking performance by improved matching dynamic
models and a differentiated visualization in the devel-
oped predictive display.
The classification is based on the evaluated prop-
erties of the objects. From the evaluation of the lidar
measurements, the size, orientation and shape of the
object are available. The speed and direction of mo-
tion are derived by the filtering process described in
the next section. For the classification there is one
weighting function for each known property similar
to (Mendes et al., 2004). An example of the cho-
sen weighting functions for the class car is shown
in figure 5. The length, width, shape, velocity and
the angle between motion direction and orientation
are taken into consideration. Note, that some func-
tions have higher weights corresponding to their im-
portance. Depending on the values of each object in
these categories, a current class agreement is calcu-
lated as a mean value of all weights w
i,c
with i = 1...5.
Class probabilities γ
class
are deducted from these val-
ues considering the normalization
∑
classes
γ
i
= 1 and
smoothing the class changes. All new objects are ini-
tialized as unknowns and change their class if γ
class
exceeds a specific threshold.
5 TRACKING MANAGEMENT
The tracking management mentioned in figure 2 con-
sists of two important steps. First, the deletion of ob-
jects and second, the tracking of the objects by means
of a filter.
5.1 Deletion of Objects
In addition to detecting and tracking new objects, it
is important to delete objects. There are two main
reasons for deletion. The first deals with vanishing
objects, which leave the surveillance zone or are oc-
cluded by other objects. Therefore targets are deleted
after they haven’t been detected for a specific period
0 1 2 3 4
0
1
width [m]
w
2,c
0 2 4
6
8 10
0
1
length [m]
w
1,c
I L
C IS
E
0
1
shape
w
3,c
0 20 40
60
0
1
velocity [m/s]
w
4,c
0
50
100
150
200
0
2
angle between velocity and orientation [
◦
]
w
5,c
Figure 5: Classification weighting functions for class car to
determine the class agreement.
of time. The second covers the cleanup of erroneous
objects. Such can result from misleading shapes due
to the vegetation beside the road. False objects can be
detected by measurement points inside the assumed
solid area, unrealistic motion or exceeding dimen-
sions.
5.2 Tracking
For the tracking of the detected traffic participants,
different kalman filters are used for the different mo-
tion models (cf. (Grewal and Andrews, 2008)). Based
on the motion models presented in section 2, the fil-
ter calculates the optimal solution for the object states
considering the measured values and the assumed
noise terms. The nonlinear dynamic model for cars
and bicycles is processed by an extended kalman fil-
ter. Deviating from the presented process in figure
2, the prediction step of the kalman filter is already
used to calculate the expected object shape for the li-
dar evaluation.
6 ENRICHMENT OF A PRIORI
KNOWLEDGE THROUGH
SENSORFUSION
The presented approach uses a priori knowledge to
effectively interpret the raw data of the lidar scan-
ner. Therefore the detection quality depends on the
amount of a priori knowledge. Consequently the en-
ImprovingLidarDataEvaluationforObjectDetectionandTrackingUsingaPrioriKnowledgeandSensorfusion
799

richment of the knowledge through additional infor-
mation from other sensors increase the quality of the
lidar evaluation.
Here we used the radar sensor installed with the
series ACC to insert additional knowledge of the de-
tected scene. The extended functional overview is il-
lustrated in figure 6. The object list provided by the
radar sensor with its integrated processing and track-
ing is filtered for relevant dynamical objects to add
them to the knowledge base. Within the knowledge
fusion step the radar objects are integrated into the li-
dar representation of the environment also regarding
synchronization purposes. As our developed sensor
data fusion combines different fusion levels, namely
the radar data from the object level and the lidar val-
ues from the raw level, we labeled it ’mixed fusion’.
LIDAR
Processing
Object output
RADAR
Signal level
Feature level
Object level
Lidar
evaluation
Tracking
Tracking
Knowledge
filter
Knowledge
fusion
Figure 6: Combination of the signal and the object level in
the ”mixed fusion”.
A big advantage of the presented fusion approach
is the early possible combination of both sensors.
With the a priori knowledge of the radar, the precise
distance measurement of the lidar can be used to cor-
rect the object position as soon as the first measure-
ment point is available. Since the lidar evaluation is
based on the raw data and therefore not dependent on
extensive object shapes.
Regarding an oncoming car as example, the radar
detects the approximate position and a precise relative
velocity in distances up to 150m and enables an early
car classification indicated by the objects velocity and
its conductibility since it is detected by the radar. As
soon as the car enters the smaller range of the lidar,
the position can be corrected, even if there are only
single measurement points detected, which would not
lead to a detected object in a feature based lidar eval-
uation.
7 EXPERIMENTAL RESULTS
The presented approach was implemented and tested
with recorded lidar and radar data. The test vehicle
was an AUDI Q7 with a one-layer SICK lidar scan-
ner with 75Hz frequency, 1
◦
angular resolution, 180
◦
opening angle and a maximum range of 80m, which
was mounted on the front at about 0.5m height. The
used Radar sensor is the series ACC long range radar
with an approximate range of 150 m and an horizontal
opening angle of about ±8
◦
.
Precise reference data is necessary for an objec-
tive and extensive system evaluation of an environ-
ment surveillance system. However, no such data sets
were available and therefore the system performance
was evaluated optically by means of video sequences
of existing traffic scenes. The information of the en-
vironment surveillance system is therefore projected
into video images and thus a quick evaluation is pos-
sible. In figure 7, two different recorded traffic scenes
with the detected object shape and the expected fu-
ture position 500 milliseconds ahead are visualized.
Therefore, it is possible to evaluate simultaneously
the object detection and the motion tracking by op-
tical survey. To enable the calculation of objective
quality criteria for detection, the measurement data
has been manually attributed by marking the time se-
quences where the actual traffic participants are lo-
cated in the surveillance zone. To that end, the detec-
tion rate, false detection rate, false classification rate
and temporal coverage ((Lindl, 2008, p.150)) of five
different traffic sequences (city, rural, highway) were
evaluated. The images in figure 7 are snapshots of the
both city scenarios. Each value was calculated sepa-
rately for the detection with the lidar sensor only and
the fusion of lidar and radar. The calculated criteria
and the length of the datasets are listed in table 2. The
detection rates (DR) indicate, that most objects are de-
tected and classified correctly. Comparing the DR and
the TC values of the two different sensor configura-
tions, the major improvement through the integration
of the radar can be seen. Especially in the rural sce-
narios with fast, oncoming traffic the small detection
rate of the lidar leads to a short temporal coverage of
these objects. In combination with the radar, the cars
are tracked early and a smooth transition to the lidar
monitored area is enabled, leading to high detection
rates (94 − 100%).
8 CONCLUSION AND OUTLOOK
We presented a novel approach for evaluating lidar
scanner raw data regarding the detection and track-
ICINCO2014-11thInternationalConferenceonInformaticsinControl,AutomationandRobotics
800
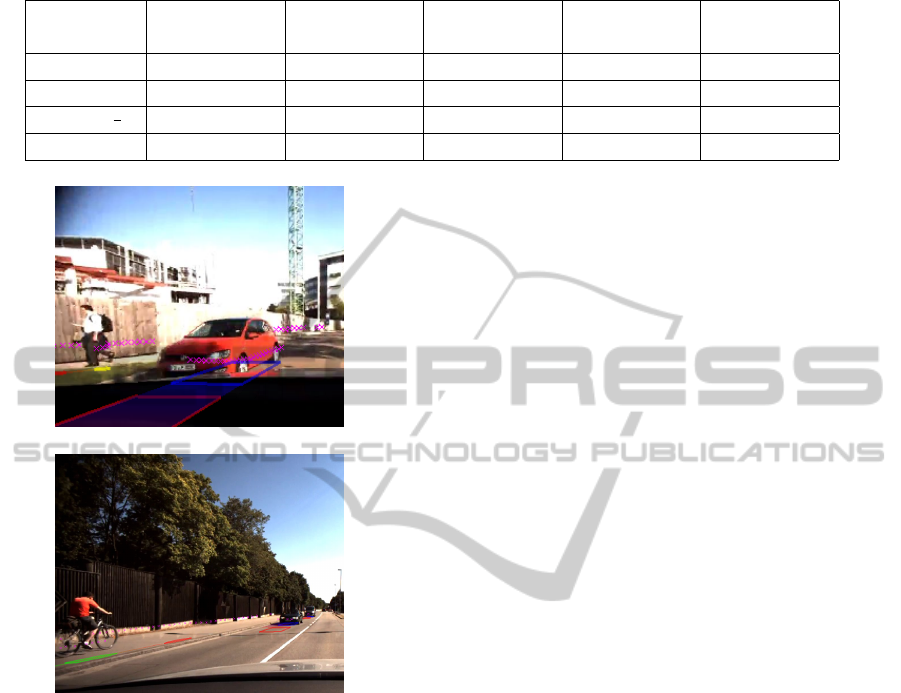
Table 2: Calculated quality criteria for lidar only and lidar radar fusion: detection rate (DR), false classification rate (FCR),
false detection rate (FDR) and temporal coverage (TC).
criteria city 1 (65s) city 2 (46s) rural 1 (79s) rural 2 (60s) highway (59s)
K
Lid
K
Fus
K
Lid
K
Fus
K
Lid
K
Fus
K
Lid
K
Fus
K
Lid
K
Fus
DR [%] 0.81 0.81 0.93 1.00 0.65 1.00 0.63 0.94 0.83 0.92
FCR [%] 0.13 0.13 0.00 0.00 0.05 0.00 0.06 0.06 0.00 0.00
FDR [
1
s
] 0.69 0.72 0.77 0.77 0.18 0.19 0.73 0.78 0.12 0.14
TC [%] 0.36 0.37 0.42 0.65 0.26 0.87 0.19 0.67 0.36 0.87
(a) scene 1
(b) scene 2
Figure 7: City traffic scenes with projected detecting and
tracking results through grounded shapes illustrating the de-
tected positions and predicted future positions 500 millisec-
onds ahead.
ing of traffic participants. It is based on the usage of
knowledge over objects to improve the lidar raw data
evaluation. The integration of the radar sensor for
additional object information shows an considerable
improvement to the detection performance. This ap-
proach also enables the tracking of undefined shapes
like bicycles. For precise tracking, cars, bicycles and
pedestrians are differentiated by a classification rou-
tine and therefore different dynamic models are ap-
plied.
The approach is based on the a priori knowl-
edge about objects and therefore the performance de-
pends on the amount of information available. Con-
sequently, the integration of additional information
sources will lead to a further improvement. Further-
more, the extension of the classification schema with
other classes like trucks would widen the area of ap-
plication.
REFERENCES
Fayad, F. and Cherfaoui, V. (2007). Tracking objects using
a laser scanner in driving situation based on modeling
target shape. In 2007 IEEE Intelligent Vehicles Sym-
posium, pages 44–49.
Fortin, B., Lherbier, R., and Noyer, J.-C. (2012). Feature
extraction in scanning laser range data using invariant
parameters: Application to vehicle detection. IEEE
Transactions on Vehicular Technology, 61(9):3838–
3850.
Fuerstenberg, K. C., Linzmeier, D. T., and Dietmayer, K. C.
(2003). Pedestrian recognition and tracking of vehi-
cles using a vehicle based multilayer laserscanner. In
Proceedings of ITS 2003, 10th World Congress on In-
telligent Transport Systems.
Grewal, M. S. and Andrews, A. P. (2008). Kalman filter-
ing: Theory and practice using MATLAB. John Wiley,
Hoboken, 3 edition.
Kaempchen, N., Buehler, M., and Dietmayer, K. (2005).
Feature-level fusion for free-form object tracking us-
ing laserscanner and video. In IEEE Proceedings. In-
telligent Vehicles Symposium, 2005, pages 453–458.
Lindl, R. (2008). Tracking von Verkehrsteilnehmern im
Kontext von Multisensorsystemen. PhD thesis, Tech-
nische Universit
¨
at M
¨
unchen, M
¨
unchen.
Mendes, A., Bento, L., and Nunes, U. (June 14-17, 2004).
Multi-target detection and tracking with a laserscan-
ner. In IEEE Intelligent Vehicles Symposium, 2004,
pages 796–801.
Sparbert, J., Dietmayer, K., and Streller, D. (25-29 Aug.
2001). Lane detection and street type classification
using laser range images. In 2001 IEEE Intelligent
Transportation Systems. Proceedings, pages 454–459.
Vu, T.-D., Aycard, O., and Appenrodt, N. (2007). Online
localization and mapping with moving object tracking
in dynamic outdoor environments. In 2007 IEEE In-
telligent Vehicles Symposium, pages 190–195.
ImprovingLidarDataEvaluationforObjectDetectionandTrackingUsingaPrioriKnowledgeandSensorfusion
801
