
Global Temperature Fuzzy Model as a Function of Carbon Emissions
A Fuzzy ‘Regression’ from Historical Data
Carlos G. Gay and Bernardo O. Bastien
Climate Change Research Program, UNAM, Av. Universidad 3000, Mexico City, Mexico
Keywords: Fuzzy Logic, Climate Modelling, Climate Change, Fuzzy Inference System.
Abstract: There are several models that correlate global mean temperature with Carbon emissions using statistical
analysis; in this study we approach the problem using fuzzy logic analysis and inference systems, which is a
pioneer method in climate modelling. The process in which anthropogenic activity affects the atmospheric
Carbon and therefore the global mean temperature, has been well studied but there are still a lot of unknown
factors that play an important role in the process, e.g. punctual Carbon sequestration processes, economy-
led emissions’ fluctuations, etcetera. That way the process take no clear path and is when fuzzy logic is
ideal to approach the system understanding. In this study a Fuzzy Inference System is developed, which
model the problem using historical data from 1959 to present. Our model has good results quite comparable
with statistical models and it can be used to project the future global mean temperature. The model was
developed using SIMULINK extension from matlab.
1 INTRODUCTION
GHG emissions had been accelerating the actual
climate change reflected in the increasing global
mean temperature. So far, it has been a challenge to
model the temperature change as a function of GHG
emissions.
It had been developed diverse statistical
techniques applied to historical data, which are used
to find equations that relate temperature and CO
2
emissions, the different techniques involve
intermediate variables between emissions and
temperature, the most direct of those intermediate
variables is the atmospheric Carbon concentration
(Shefter et al., 2006), likewise, there are equations
that have a big number of intermediate variables like
Solar radiation, oceanic oscillations, other GHG and
their respective radiative forcings (Kauffman et al.,
2006). Equations (1) and (2) show the classical
(statistical) way to address the problem.
∆
(1)
∆
(2)
The first equation relates Carbon emissions at
time i with the increment of atmospheric CO
2
a time
i+1, using as a secondary variable the Atmospheric
CO
2
at time i. The second equation relates
atmospheric CO
2
at time i+1 with the increment of
temperature at time i+2, having as a secondary
variable the temperature at time i+1. As we can see,
the discretization nature of the equations and the fact
that both equations are coupled, give us a
predictability of two time steps ahead.
This work addresses the same problem with a
fuzzy logic perspective, which creates the link
between the variables using fuzzy sets and causality
rules. So we can obtain dynamic coefficients in
function of how much the input variables belongs to
each fuzzy set. This structure that calculates the
dynamic coefficients is better known as Fuzzy
Inference System (FIS). Such system is created using
historical data from 1959 until now (Tans, 2014; Le
Quéré et al., 2013).
Since the majority of the international emissions
reports are released annually, the time step is one
year. Finally we obtained a fuzzy model of mean
global temperature as a function of Carbon
emissions, which compared with 50 years of
historical data we can observe a very similar
behavior.
2 METHODOLOGY
We created two fuzzy inference systems based on
818
Gay C. and Bastien B..
Global Temperature Fuzzy Model as a Function of Carbon Emissions - A Fuzzy ‘Regression’ from Historical Data.
DOI: 10.5220/0005123208180821
In Proceedings of the 4th International Conference on Simulation and Modeling Methodologies, Technologies and Applications (MSCCEC-2014), pages
818-821
ISBN: 978-989-758-038-3
Copyright
c
2014 SCITEPRESS (Science and Technology Publications, Lda.)
the equations (1) and (2). The environment in which
was developed was matlab, using the fuzzy logic
toolbox.
Based on the historical data we generated the
systems, which components are: input domains
divided in fuzzy sets, output domain divided in
fuzzy sets and causality rules that govern the system.
Details about the systems can be found in the
appendix.
3 RESULTS
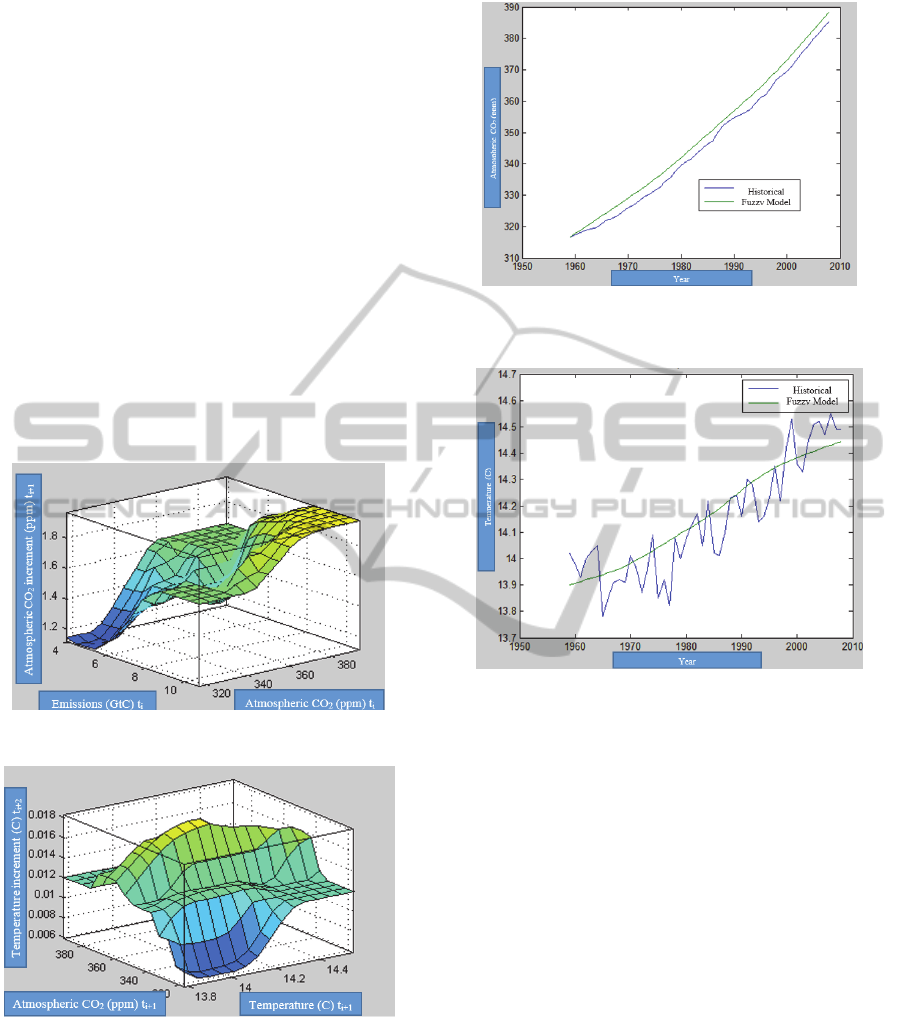
Figure 1 shows CO
2
increment at time i+1 as a
function of Carbon emissions and atmospheric CO
2
at time i, analogously Figure 2 shows the
temperature increment at time i+2. The relation
between inputs and outputs of the FIS is given by
the dynamic coefficients.
Figure 1: Increment of Atmospheric CO
2
.
Figure 2: Temperature increment.
The fuzzy model was ran during 50 years starting in
1959 and the results were compared with the
historical data. Such comparison is shown in Figure
3 and Figure 4.
Figure 3: Comparison between historical Atmospheric
CO
2
and the generated from the fuzzy inference system.
Figure 4: Comparison between historical Temperature
and
the generated from the fuzzy inference system.
4 DISCUSSION
As we can see in Figure 1 the model creates a
positive causality between the increment of
temperature and Carbon emissions, also the causality
is positive between Atmospheric CO
2
and
Atmospheric CO
2
increment. Broadly it can be said
that most of statistical methods give the same
results, but if we go further, it can be seen that the
fuzzy model has non-linear behavior and its dynamic
over time, i.e. the slope may vary depending of the
combinations of Atmospheric CO
2
and Carbon
emissions, this is an attribute that a fuzzy inference
system has over a classic statistical method. These
small slope changes represent unknown or not very
well studied Carbon sinks or sources. Finally, is
important to remark that the final desired result,
shown in Figure 4, is the temperature which follows
a path very proximate to the mean historical
temperature.
GlobalTemperatureFuzzyModelasaFunctionofCarbonEmissions-AFuzzy'Regression'fromHistoricalData
819
5 CONCLUSSIONS
The fuzzy model crated can relate the change in
mean global temperature with the carbon emissions.
Thanks to it fuzziness allow us to involve variables
with high uncertainty, such as measurements of
annually emitted Carbon or Atmospheric CO
2
concentration.
This fuzzy model will be very useful to project
future temperatures based on possible values of
emissions, due to the uncertainty nature of the
problem.
REFERENCES
Shefter, M., Brovkin, V., Cox, P., 2006. Positive Feedback
between global warming and atmospheric CO
2
concentration inferred from past climate change.
Geophysical Journey. V33.
Kauffman R., Kauppi, H., Stock, J., 2006. Emissions,
concentrations & temperature: a time series analysis.
Climate Change 77:249-278. Springer.
Le Quéré, Peters G., Andres R., Andrew R., Boden T,
Ciais P., Friedlingstein P., Houghton R., Marland G.,
Moriarty R., Sitch S., Tans P., Arneth A., Arvanitis A.,
Bakker D., Bopp L., Canadell J., Chini J., Doney S.
C., Harper A., Harris I., House J. I., Jain A. K., Jones
S. D., Kato E., Keeling R. F., Klein Goldewijk K.,
Körtzinger A., Koven C., Lefèvre N., Maignan F.,
Omar A., Ono T., Park G.-H., Pfeil B., Poulter B.,
Raupach M. R., Regnier P., Rödenbeck C., Saito S.,
Schwinger J., Segschneider J., Stocker B. D., Tilbrook
B., van Heuven S., Viovy N., Wanninkhof R.,
Wiltshire A., Zaehle S., 2013. Global Carbon Budget
2013. Earth Syst. Sci. Data Discuss.
Tans, P., 2014. Atmospheric CO2, Mauna Loa
Observatory, NOAA, www.esrl.noaa.gov/gmd/ccgg/
trends.
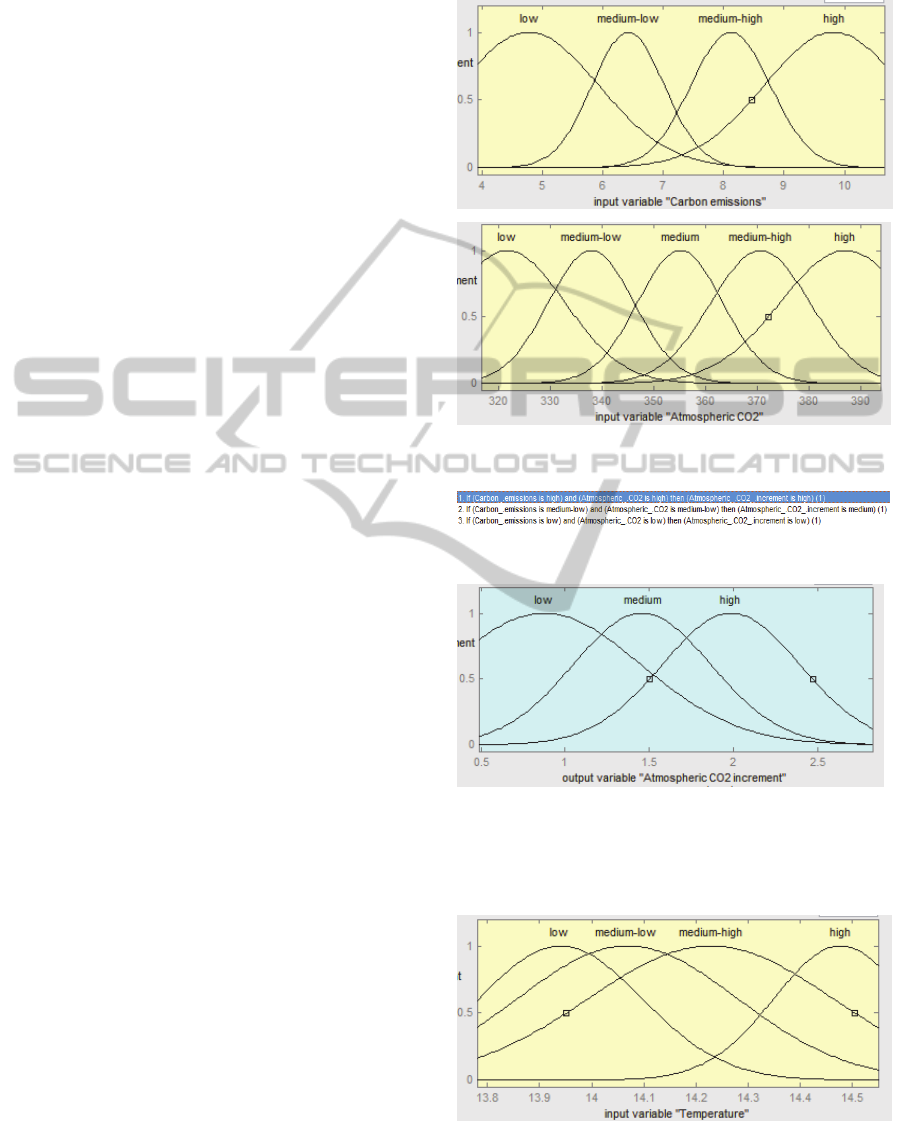
APPENDIX
It is shown here the fuzzy inference systems
developed with matlab fuzzy logic toolbox.
The components of the first fuzzy inference system
are:
INPUTS
RULES
OUTPUT
The components of the second fuzzy inference
system are:
INPUTS
SIMULTECH2014-4thInternationalConferenceonSimulationandModelingMethodologies,Technologiesand
Applications
820
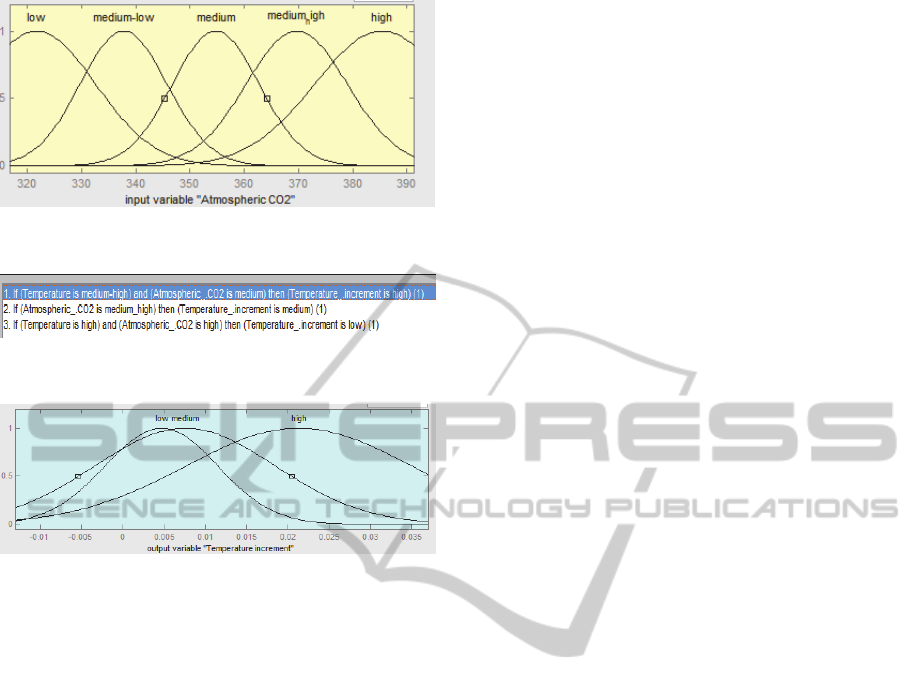
RULES
OUTPUT
GlobalTemperatureFuzzyModelasaFunctionofCarbonEmissions-AFuzzy'Regression'fromHistoricalData
821
