
A Comparison of the Movement Patterns of Specific Rugby Union
Movements on Both Natural Turf and Artificial Turf
S. O’Keeffe
1
, K. Fullam
2
, M. O. Feeley
1
, B. Caulfield
2,3
, E. Delahunt
2
,
G. Coughlan
4
and M. D. Gilchrist
1
1
School of Mechanical & Materials Engineering, University College Dublin, Dublin, Ireland
2
School of Public Health, Physiotherapy and Population Science, University College Dublin, Dublin, Ireland
3
Insight Centre for Data Analytics, University College Dublin, Dublin, Ireland
4
Irish Rugby Football Union, Dublin, Ireland
1 INTRODUCTION
A limitation of sports kinematic studies is that they
cannot fully represent in-situ play conditions for fast
dynamic sports. This paper describes the use of new
inertial sensor measurement technology (O’Donovan
et al., 2009) to analyse player motions in the field
under game-like conditions in order to quantify the
impact of different playing surfaces on movement
patterns. The wireless sensor system used in this
study (Shimmer 3, Shimmer Research, Ireland) is a
lightweight (50x25x12.5mm
3
), wearable, low-power
consumption inertial measurement unit that contains
a tri-axial accelerometer, gyroscope, and
magnetometer. Sensor data can be used to derive a
range of spatiotemporal and kinematic variables to
quantify performance during gait and other
functional activities. In our research we are using
these sensors as a means to characterise movement
during a running activity. The motivation for this
study has been to compare movement profiles and
strategies of rugby players performing game related
tasks on natural turf surfaces and on synthetic
surfaces, to enable a better understanding of the
impact of different playing surfaces on movement
and associated forces and stresses exerted on the
body. This is important as there is a growing trend
towards use of synthetic surfaces in rugby union and
there have been anecdotal reports of injuries that are
perceived to be related to the playing surface. In this
paper we present preliminary movement data
acquired from players performing a 10m sprint test
on natural and synthetic surfaces and describe our
methods of data extraction and subsequent data
processing.
2 METHODS
Twenty elite rugby union players participated
voluntarily. Data were captured from the participants
while they performed running trials on both natural
and synthetic turf playing surfaces. The specific test
carried out was a 10m sprint, which is a standard test
used for quantifying linear acceleration in rugby
union (Duthie et al, 2006). Sensors placed on the
thigh, shank and foot provided data from foot-strike
events for subsequent analysis. All post processing
and analysis was carried out using MATLAB.
Accelerometer and gyroscopic data were calibrated
using 9-DOF calibration Shimmer software and
were low-pass filtered with a zero-phase 5
th
order
Butterworth filter with 50 Hz and 20 Hz corner
frequencies. Acceleration and angular velocity
vectors were derived with respect to each segment’s
coordinate axes. In this paper, we limit our scope to
consideration of the process of data extraction and
analysis for the data relating to the 10m sprint.
Using the gyroscopic data, the parameters of
sprinting (foot-strike points) from each motion were
successfully identified using the method described
by McGrath et al. (2012), where the stride time is
given as the time between two successive foot -
strikes. These characteristic points successfully
allowed stride time, ST, to be calculated by:
ST(k) = FS(k+1) – FS(k) (1)
where k is the number of cycles, and FS is foot-
strike.
3 RESULTS
A typical sample of the angular velocity data about
the sagittal plane that was measured at the left foot
O’Keeffe S., Fullam K., O. Feeley M., Caulfield B., Delahunt E., Coughlan G. and D. Gilchrist M..
A Comparison of the Movement Patterns of Specific Rugby Union Movements on Both Natural Turf and Artificial Turf.
Copyright
c
2014 SCITEPRESS (Science and Technology Publications, Lda.)
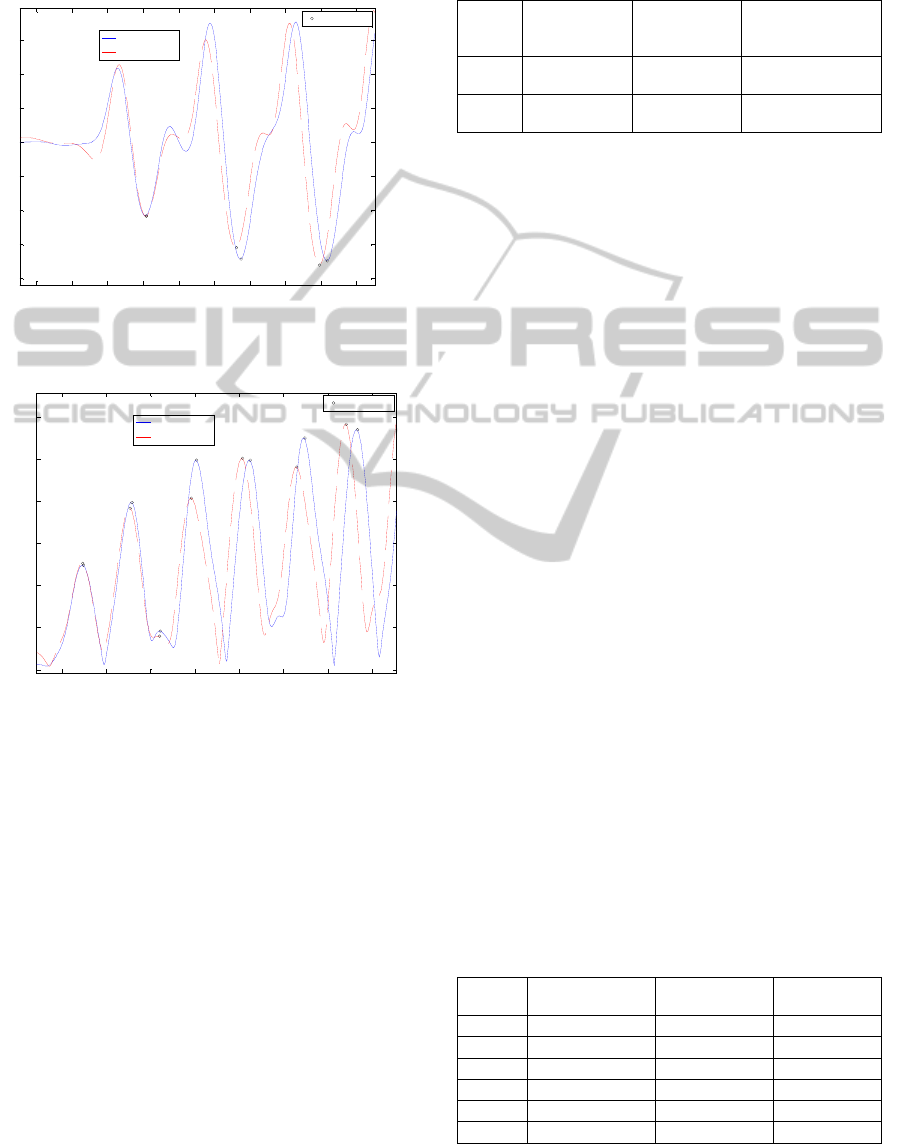
during the 10m sprint in trials on both artificial turf
and natural turf is shown below in Figure 1. Figure 2
shows the corresponding resultant of linear
accelerations.
Figure 1: Angular velocity at the left foot about the sagittal
plane during the 10m sprint.
Figure 2: Resultant linear acceleration at the left foot
during the 10m sprint.
From the resultant acceleration data demonstrated in
Figure 2, it can be noted that accelerations
experienced in the first full stride are quite different
to the accelerations experienced in the second full
stride. The first three maxima of resultant linear
accelerations increase significantly with each
progressive maximum. The magnitude of the second
three maxima seems to plateau at around 110 m/s
2
.
This shows that during the first stride the participant
is accelerating while during the second stride the
participant is starting to come to steady state and run
at maximum velocity. Taking this into account the
results from the first ‘acceleration stride’ can
usefully be presented in tabular format separately
from the second stride in which the participants
approach steady state.
Table 1: Means, standard deviations and percentage
differences of stride times measured at the left foot and
collected on both artificial and natural turf while doing the
10m sprint. Values are expressed as mean±SD.
Stride Artificial
Turf
(s)
Natural
Turf
(s)
Percentage
Difference
(%)
1 0.485 ±
0.046
0.478 ±
0.034
1.355 ± 5.36
2 0.458 ±
0.035
0.458 ±
0.035
0.15 ± 3.16
In Table 1, Stride 1 refers to the acceleration stride
while Stride 2 refers to the stride that approaches
steady state. The stride times are given in seconds.
The percentage difference is the difference between
corresponding stride times measured on both
surfaces, expressed as a percentage of the stride time
measured on natural turf. The difference between the
corresponding stride times on both surfaces is shown
to be insignificant as the application of a paired T
test for means generated P values that were greater
than 0.05 (for Stride 1, P = 0.33; for Stride 2, P =
0.9)
In Table 2 Maximum 1 refers to the first maximum
of the resultant linear acceleration recorded during
the course of the 10m sprint. In total, 6 maxima of
resultant linear accelerations were recorded during
the course of the test. The percentage difference is
the difference between corresponding maxima of
resultant accelerations measured on both surfaces,
expressed as a percentage of the maximum measured
on natural turf. The difference between the
corresponding maxima of resultant linear
acceleration measured on both surfaces is deemed
insignificant since application of a paired T test for
means generated P values for all six maxima that
were also greater than 0.05 (Maximum 1: P = 0.577,
Maximum 2: P = 0.054, Maximum 3: P = 0.35,
Maximum 4: P = 0.062, Maximum 5: P = 0.44,
Maximum 6: P = 0.2).
Table 2: Means, standard deviations and percentage
differences of maxima of resultant linear accelerations
times measured at the left foot and collected on both
artificial and natural turf while doing the 10m sprint.
Values are expressed as mean±SD.
Maximum Artificial Turf
(m/s
2
)
Natural Turf
(m/s
2
)
Percentage
Difference (%)
1 55.62 ± 6.48 54.68 ± 9.89 5.25 ± 24.03
2 89.61 ± 8.48 85.8 ± 10.68 5.15 ± 8.9
3 83.85 ± 11 80.65 ± 18.69 14.68 ± 53 .66
4 115.4 ± 10.2 108.36 ± 13.71 8.09 ± 16.25
5 99.31 ± 9.65 101.47 ± 12.02 -1.34 ± 10.26
6 126.6 ± 10.3 122 ± 14.499 4.94 ± 12.7
0.8 1 1.2 1.4 1.6 1.8 2 2.2 2. 4 2. 6
-20
-15
-10
-5
0
5
10
15
Time (s)
Angular Velocity (rad/s)
artificial turf
natural turf
Footstrike
1.2 1.4 1.6 1.8 2 2.2 2.4 2.6
0
20
40
60
80
100
120
Time (s)
Acceleration (m/s
2
)
artificial turf
natural turf
Maximum

4 DISCUSSION
On observation of the data, different participants
appeared to display slightly different strategies to
each other when carrying out the test, but the same
participants displayed the same strategy on different
surfaces. This enables a comparison of one surface
to another. The local minima identified in the
angular velocity about the sagittal plane (Figure 1)
indicate points of initial contact or foot strike (FS).
Analysis of this data for all the test participants
showed that each participant completed three clearly
identifiable foot strikes during the 10m sprint.
Equation (1) shows that each participant completed
two full strides in the test. Overall the difference
between stride times on both surfaces was very
small, which was as expected. The largest average
difference between stride times that was measured
was 0.0076 s at the left thigh.
The resultant acceleration data for the 10m sprint
was analysed by comparing the magnitudes of the
corresponding maxima measured on both surfaces.
In general, the difference between the maximum
points of resultant acceleration measured on
artificial turf and natural was not large: the largest
average difference was 4.5m/s
2
for the third
maximum point recorded at the left foot.
5 CONCLUSIONS
From the results presented, it has been shown that
there is an insignificant difference between the
angular velocity data and the resultant linear
acceleration data collected on both surfaces. This
would indicate that there is no significant difference
in the movement pattern when carrying out a 10m
sprint on artificial turf and on natural turf.
6 FUTURE WORK
It is intended to carry out tests that incorporate
braking and change of direction in order to identify
events of interest associated with these movements.
ACKNOWLEDGEMENTS
Funding from the International Rugby Board, the
Irish Rugby Football Union and Science in Sport is
gratefully acknowledged.
REFERENCES
O’Donovan, KJ; Greene, BR; McGrath, D; O’Neill, R;
Burns, A; Caulfield, B; Shimmer: A new tool for
temporal gait analysis, Annual International
Conference of the IEEE, September 2-6, 2009,
Minneapolis, Minnesota, USA.
Duthie, GM; Pyne, DB; Ross, AA; Livingstone, SG;
Hooper, SL; The reliability of ten-meter sprint time
using different starting techniques, Journal of Strength
and Conditioning Research, 2006, 20(2), 246–251
McGrath, D; Greene, BR; O’Donovan, KJ; Caulfield, B;
Gyroscope based assessment of temporal gait
parameters during treadmill walking and running,
Journal of Sports Engineering, 2012, 15(4), pp. 207-
213.

