
Data Analytics for Power Utility Storm Planning
Lan Lin
1
, Aldo Dagnino
1
, Derek Doran
2
and Swapna Gokhale
3
1
ABB Corporate Research, Raleigh, NC, 27606, U.S.A.
2
Department of Computer Science & Engineering, Kno.e.sis Research Center,
Wright State University, Dayton, OH, 45431, U.S.A.
3
Department of Computer Science and Engineering, University of Connecticut, Storrs, CT, 06269, U.S.A.
Keywords: Machine Learning, Storm Damage Projection, Smart Grid, Data Analytics, On-line Social Media.
Abstract: As the world population grows, recent climatic changes seem to bring powerful storms to populated areas.
The impact of these storms on utility services is devastating. Hurricane Sandy is a recent example of the
enormous damages that storms can inflict on infrastructure, society, and the economy. Quick response to
these emergencies represents a big challenge to electric power utilities. Traditionally utilities develop
preparedness plans for storm emergency situations based on the experience of utility experts and with
limited use of historical data. With the advent of the Smart Grid, utilities are incorporating automation and
sensing technologies in their grids and operation systems. This greatly increases the amount of data
collected during normal and storm conditions. These data, when complemented with data from weather
stations, storm forecasting systems, and online social media, can be used in analyses for enhancing storm
preparedness for utilities. This paper presents a data analytics approach that uses real-world historical data
to help utilities in storm damage projection. Preliminary results from the analysis are also included.
1 INTRODUCTION
A 2012 Edison Electric Institute reliability report
(Wang, 2012) shows that bad weather contributed to
67% of power outages time and that most damage
after a big storm is in the power distribution lines
and equipment. Hurricanes, tropical storms, and
summer storms cause the majority of power outages.
The report identifies that winter storms tend to have
durations equal or greater than many of the summer
storm events. Overhead power lines are typically the
most vulnerable to storms. Although it seems that
underground facilities may be less prone to major
outage events, many underground facilities are also
affected by major storms, since most existing
underground facilities are supplied from overhead
sections of the grid. Therefore, any event causing an
overhead outage will also cause outages on sections
of underground facilities. In the case of flooding,
underground facilities are prone to severe damages.
Power utilities in the US face enormous
challenges when responding to storms. Utilities have
storm planning procedures that address different
stages of storm preparedness. These stages include
cyclic storm planning, storm damage projection, in-
storm analysis, post-storm assessment, post-storm
restoration, and grid hardening. Utilities have outage
management personnel who often have worked for
years in these areas. Decisions on storms are
typically made based on experts’ heuristic
knowledge. Although utilities are using technologies
such as outage management systems (OMS),
geographic information systems (GIS), supervisory
control data acquisition (SCADA) systems, and
automated metering reading systems, there is still a
wealth of data generated by these systems and other
sources that utilities can use to be more proactive in
addressing each of the stages of storm damage
preparedness. This paper presents two examples of
how data analytics can be used by utilities to become
more proactive in the storm damage projection and
in-storm analysis stages. The examples presented
here represent just a “foretaste” of what is possible
to achieve in this field. Section 2 discusses some of
the data sources available today that can be used to
develop models for storm planning. Section 3 and 4
present data sources and a machine learning
approach and initial results that address the storm
damage projection. Section 5 presents initial results
and a machine learning approach that utilizes on-line
social media to follow the evolution of a storm.
308
Lin L., Dagnino A., Doran D. and Gokhale S..
Data Analytics for Power Utility Storm Planning.
DOI: 10.5220/0005128203080314
In Proceedings of the International Conference on Knowledge Discovery and Information Retrieval (KDIR-2014), pages 308-314
ISBN: 978-989-758-048-2
Copyright
c
2014 SCITEPRESS (Science and Technology Publications, Lda.)

Section 6 presents conclusions and future work that
authors are pursuing in this field.
2 DATA ANALYSIS APPROACH
Utilities face difficult challenges regarding how to
use available data for storm planning. First, the
current available data are used primarily for tracking
purposes and not for proactive storm planning.
Second, the sources of data and data are
heterogeneous in nature. Third, relying on data
collected on past storms is challenging as no two
storms are the same. These present a challenge when
comparing storm-restoration performance of the past
and present (Johnson, 2004). Another major data
challenge is that utilities do not have a standardized
method for collecting data on storm-restoration.
In spite of these challenges the authors believe it
is possible to demonstrate the potential predictive
capabilities that machine learning models can
provide with current data sources, imperfect as they
may be. These data originates from heterogeneous
sources and geographically dispersed environments.
Primary data types available can be classified as
static structured and unstructured historical data and
dynamic real-time structured and unstructured data.
Static data can be used to develop machine learning
models while dynamic data can be used by trained
models to analyse storm situations in near real-time.
Static structured historical data includes GIS and
grid topology, storm data, grid damage, OMS data,
work management systems, work flow management
with power restoration actions, grid intelligent
electronic device (IED) data, vegetation and terrain,
and transmission and generation data. Static
unstructured historical data includes on-line social
networks historical data, historical multi-media
storm damage data, and unstructured damage
reports. Dynamic real-time structured data includes
weather feeds, grid sensor feeds, real-time OMS
data, emergency response data, SCADA data, phasor
measurement unit data, 61850 GOOSE data,
network management and fault data, meter data, and
IED data. Dynamic real-time unstructured data
includes real-time OMS data, drones or robotic
systems data, multi-media data, and repair crew
report.
3 THE DATA
Storm damage projection refers to the use of
prediction methods to project the severity and
locations of damages, resource needs and time for
power restoration after a storm has hit the power
grid. Storm damage measurements include peak
number of customers without power, outage
duration, peak number of line restoration personnel,
and equipment damage. Based on the projection,
plans are made for positioning restoration resources,
prioritizing repairs, and minimizing disruptions.
3.1 Data Sources
To develop machine learning models for storm
damage projection we looked into several data
sources public, proprietary, structured, unstructured,
and acquired historical data related from an
electrical Utility in the US, referred as Public Utility
due to proprietary constraints. The sections below
provide some details on the data used.
3.1.1 Weather Data
As a big source of public data, National Weather
Service (NWS) has a large collection of historical
weather data that can be downloaded through its
website. The following two weather data sets are
used in this study.
Severe weather event database for the United
States from 1950 to 2011. A severe weather event is
identified by timestamps of event type, begin date
and time and end date time, begin and end locations
of latitude and longitude, and a magnitude of
severity. Typical events for the selected region
include hail, thunderstorm wind, flash flood, and
tornado. The database contains over 900,000 records
with a total of 1.1 GB. This data is used to identify
severe storms in this study.
Hourly weather data from over 10,000 weather
stations all over the world from 2000 to 2012. The
hourly weather include location of observing
weather station in latitude and longitude, observation
time, wind direction, wind speed, air temperature,
sea level pressure, precipitation time and
accumulation, etc. The total amount of data is over
220 GB. In this study we used some of the weather
conditions as inputs to the predictive models. The
weather stations are selected within half a degree
from the boundaries of a Public Utility. Although the
number of stations is increased over the years, it is
still very small if we want to have one station every
few square miles. In this project we relied on data
interpolation to derive weather condition for
locations at fine granularity.
DataAnalyticsforPowerUtilityStormPlanning
309
3.1.2 Power Outage Data
The Public Utility has a total of 24,000 miles of
distribution lines, 18,000 miles of which are
overhead. It serves 830,000 customers, 600,000 of
which are urban. OMS data related to historical
storms in the geographic region of the Public Utility
is over 2 GB and contains: (1) outage events
identified by start time and end time, location in
latitude and longitude, and the particular asset
caused the event; (2) asset information including
asset location; (3) customer information and priority
level; and (4) crew information containing the crew
type and contact information.
3.1.3 Social Media Data
Social media plays an increasingly important role in
many aspects of our society. Data generated by
utility’s customers using social media provides more
insights into outages and their locations faster. We
explored social media data as unstructured public
data from Twitter. Sample data of 10,000 tweets was
downloaded using the Twitter API. An important
consideration is that over 90% of messages do not
contain geo-location information. Hence, our
research is focused on determining the geo-location
based on the contents of the message.
3.2 Data Preparation
We use several software tools in this project for data
processing, modelling, and visualization. These tools
include: (a) R is chosen as the main data analytics
tool for data pre-processing and data mining
algorithms. Visualization is also conducted using R’s
map and plot functions; (b) Google Earth is used for
visualizing weather information as shown in Figure
1; (c) Visual Studio is used to write C++ program for
processing the weather data; (d) Oracle SQL
Developer is used to write queries for extracting data
from the OMS system into files.
Figure 1: Weather station locations in Google Earth.
3.3 Data Selection
We use the tools described above to select the
datasets for building machine learning models. Our
selection criteria are largely based on the availability
and quality of the data.
The OMS dataset contains outage data from
March 2003 to September 2010. The plot in R of all
outages between 2003 and 2010 overlaying on the
total equipment in the Public Utility service territory
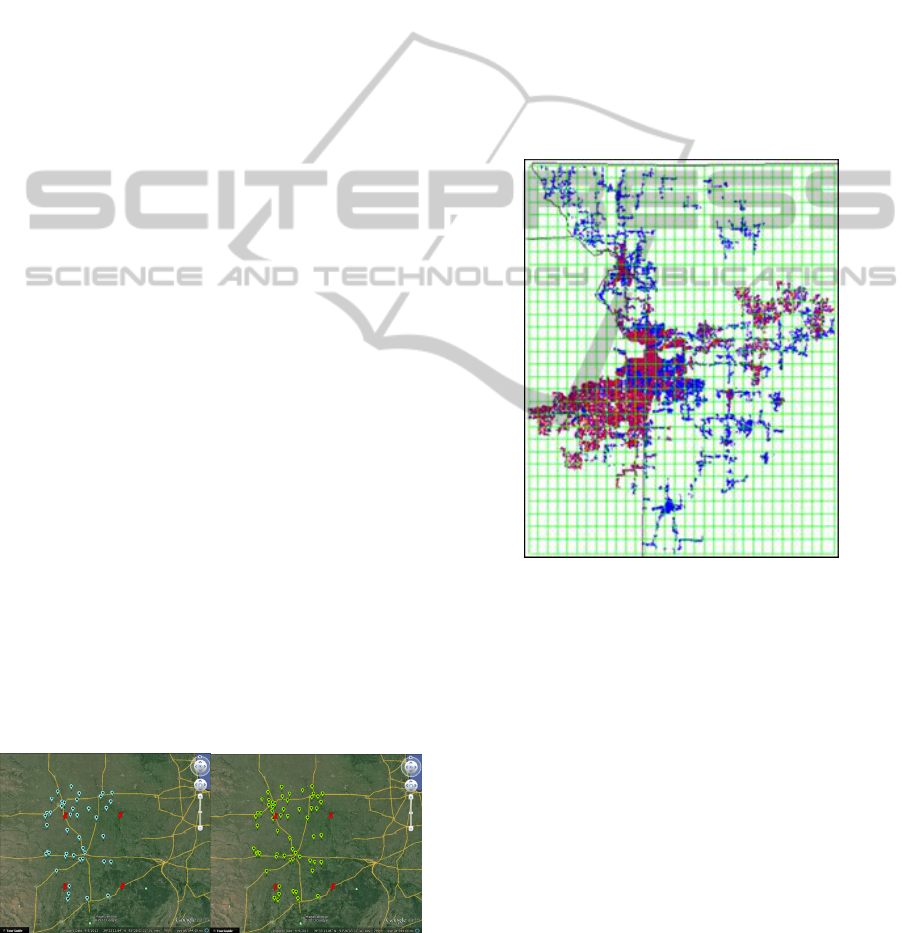
is shown in Figure 2. The blue points denote
equipment and the red points denote outages.
According to a Public Utility expert, the three
months of June, July, and August each year are the
summer storm season, when utilities need to be
ready for storm restoration activities.
Figure 2: Locations of outages from 2003 to 2010 in the
Public Utility service territory.
In the storm database, the number of weather
events per month confirms that summer months are
usually the time where severe weather events occur
in the Public Utility territory. Storms include hail,
thunderstorm wind, flash flood, flood, and tornado,
where thunderstorms are the top event although hail
occurs more frequently.
3.4 Data Pre-Processing
OMS data is processed in Oracle database using
SQL queries and working with domain experts.
The pre-processing of the hourly weather data
from NWS is built from scratch. The original hourly
weather data is formatted as flat files of records in
ASCII characters. We parse the files to extract
weather measurements into columns and save as
KDIR2014-InternationalConferenceonKnowledgeDiscoveryandInformationRetrieval
310

comma-separated values. We also collect the
associated weather station locations in latitude and
longitude. Then we select weather stations within at
most 0.5 degree in latitude and longitude away from
the boundaries of the Public Utility’s service
territory. Only the weather measurements from those
stations are selected for further use. There were 20-
40 weather stations from 2003 to 2012 that meet this
criterion, varied by year.
The bounding box of the Public Utility’s territory
is roughly 220 by 160 square miles. We divide it
into a grid of 1.5 by 1 mile cells which give us 160
by 160 cells. The cell size is small enough to be
useful for location identification of outages. We also
need weather measurements for each cell but since
there are more cells than weather stations, we need
to extrapolate weather information for the cells.
Kriging is the most widely used technique in
geo-statistics to interpolate data and it is a very good
interpolation method that can capture the true spatial
variability of temperature variation (Holdaway,
1996). Kriging can handle the situations inherent in
a precipitation field and produce the best results for
interpolating precipitation (Earls and Dixon, 2007).
Kriging is a form of linear interpolation where the
value of a field f
a
in a position r
0
is interpolated from
N neighboring values f
0
(r
i
), i = 1 … N in its region
of influence is given by
N
i
iia
rfrf
1
0
)()(
where
i
are a set of weights.
To determine the weights, we use a variogram to
write the cost function in terms of the mean square
error. The weights used in Kriging are the ones that
minimize the cost function under certain constraints.
We use a library provided in R that contains Kriging
method. In this study we are only interested in
severe storms that cause big damages to the utility.
To identify severe storms, we manually go through
all the outages in the three months of summer for
years 2005 to 2010 and identify severe storms date
and time based on the following criteria: (1) number
of outages in the hour; (2) number of customers lost
electricity in the hour; (3) average number of
customers per outage in the hour; and (4)
accumulated number of customers in the next 24
hours. The top 42 storms are selected. For each
storm, we select the hour that is the peak for most of
the criteria.
4 DATA ANALYTICS MODEL
Figure 3 shows the storm damage projection data
analytic model developed in this research. We use
historical weather, outage data, and asset data as
primary inputs to the machine learning engine. The
outage projection model created by the machine
learning engine takes in weather forecast and
generates outage projections as output. In the future,
other environmental data may be incorporated as
inputs to the model.
4.1 Models and Model Variables
The target of the outage projection model is to
predict outage locations in terms of the grid cells and
outage scale in terms of the number of outages
occurred in the next 24 hours for each cell.
Figure 3: Outage forecasting framework.
The selection of variables for the model is to find
the subset of all the input variables to build the
model that will perform with the best accuracy
against the test data. The four variables used as
inputs to the model are: (1) wind speed; (2) wind
direction; (3) precipitation amount; and (4) air
temperature. To model the nonlinearities in the data,
we add the 20th, 40th, 60th, and 80th quintiles of
measurements of wind speed, precipitation amount,
and air temperature. For this, we use a B-spline
function called ns in R.
For each of the 42 severe storms selected, we
build analytical models to predict number of outages
for each grid cell. We use data from 2005 to 2010 to
build the models. First, we partition the data into two
sets, one for training, the other one for test. Data
used for training are records from 2005 to 2009; data
for test is the 2010 data. Test data is dedicated to test
alone and not used in any way for fine-tuning the
trained models. We build models using generalized
linear models (GLM) and neural networks (NN).
Neural network models outperform generalized
linear models in accuracy of predicting the location
and scale.
DataAnalyticsforPowerUtilityStormPlanning
311
4.2 Results
The performance and accuracy/precision of the
GLM and NN models are presented and compared in
this section. NN models outperform the GLM
models in all the error metrics, but the computing
time of the NN is greater than GLM. We use the
following metrics to evaluate the performance. For
the outage locations, we use the Absolute Error (AE)
of all the cells, defined as the following.
|Pr|
1
ii
n
i
ageedictedOutOutageTrueAE
where TrueOutage
i
is the number of outages
occurred in cell i, PredictedOutage
i
is the number of
predicted outages in cell i, and n is the number of
cells.
For the outage scale, we use the Root Mean
Square Error (RMSE) for all the cells, defined as the
following.
n
ageedictedOutTrueOutage
RMSE
ii
n
i
2
1
)Pr(
where TrueOutage
i
, PredictedOutage
i
, and n are the
same as defined above.
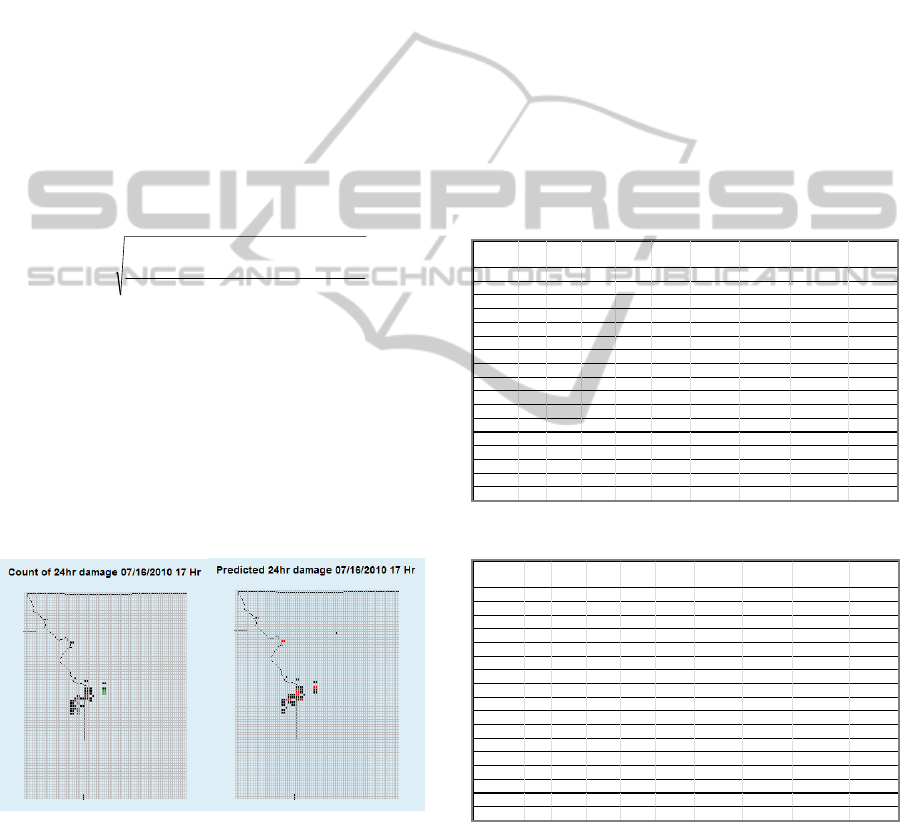
The outputs of the models are predicted number
of outages for all the cells. We plot them in R on a
map of the Public Utility territory. An example is
shown in Figure 4. The color associated with each
cell denotes the number of outages in the following
way: Black=1, Red=2, Green=3, Blue=4, Cyan=5,
Magenta=6, Yellow=7, and Gray=8. The showed
results are from an NN model.
Figure 4: Plots of true and predicted outages.
The results of GLM and NN are shown in Tables
1 and 2 respectively. For the NN models, the
predicted numbers better resembled the true outages.
The models captured the characteristics of individual
storms better.
The columns in the tables include: Storm Date;
Num outages (occurred in time period); Num Pred
Outages; Num Outage Locs (the total number of
predicted outages); Num Pred Locs (the total
number of cells predicted to have outage > 0); Num
Pred Locs>0.5 (the total number of cells predicted to
have outage > 0.5); Num True|Pred Locs: (total
number of cells that outages occurred or were
predicted); Num True&Pred Locs (total number of
cells that outages both occurred and were predicted);
RMSE of True Locations (measures how the
prediction deviates from the true); RMSE of
True&Pred Locs (measures how the models perform
for the cells that are predicted and happened).
Comparison of the performance of GLM and NN
shows that NN outperform GLM in all metrics. This
agrees with what we have discussed previously, that
NN tends to have better accuracy than other
regression models.
Table 1: Prediction results of GLM.
StormDate
Num
Outages
NumPred
Outages
Num
Outage
Locs
NumPred
Locs
NumPred
Locs>0.5
NumTrue|Pred
Locs
NumTrue&Pred
Locs
RMSEofTrue
Locations
RMSE of
True&PredLocs
06‐02‐2010_5hr 121 157.659 107 652 98 668 91 1.19482 0.4781964
06‐08‐2010_7hr 90 148.3046 77 649 94 660 66 1.341822 0.4583193
06‐12‐2010_9hr 127 162.8983 112 732 102 736 108 0.9677328 0.3775075
0
6‐13‐2010_23h
r
262 185.5746 193 715 122 731 177 1.226589 0.6302588
0
6‐16‐2010_18h
r
133 176.9472 114 754 113 759 109 1.092211 0.4232899
0
6‐18‐2010_20h
r
271 168.5292 193 672 99 719 146 1.449487 0.7509803
0
6‐19‐2010_11h
r
308 153.1811 213 680 87 721 172 1.559368 0.8475605
0
6‐20‐2010_23h
r
145 166.6354 111 692 95 709 94 1.51938 0.6011804
0
6‐23‐2010_16h
r
63 161.1181 59 663 94 671 51 1.34572 0.3990428
07‐11‐2010_9hr 325 166.4136 161 701 101 715 147 3.169998 1.504246
0
7‐14‐2010_22h
r
134 164.476 104 676 101 702 78 1.469797 0.5657253
0
7‐16‐2010_17h
r
151 160.0669 112 697 96 709 100 1.489612 0.592051
07‐20‐2010_4hr 164 183.739 129 762 108 774 117 1.181355 0.4822863
0
7‐24‐2010_17h
r
120 149.4541 97 617 101 636 78 1.404506 0.5485054
0
8‐13‐2010_19h
r
196 173.0979 151 707 109 729 129 1.282013 0.583468
0
8‐20‐2010_13h
r
451 175.9459 305 776 111 817 264 1.490663 0.91079
0
8‐31‐2010_19h
r
164 167.0613 135 661 105 689 107 1.292527 0.5721327
Table 2: Prediction results of NN.
StormDate
Num
Outages
NumPred
Outages
Num
Outage
Locs
NumPred
Locs
NumPred
Locs>0.5
NumTrue|Pred
Locs
NumTrue&Pred
Locs
RMSEofTrue
Locations
RMSEof
True&Pred Locs
06‐02‐2010_5hr 121 136.5601 107 609 96 614 102 0.6609009 0.2758951
06‐08‐2010_7hr 90 113.75 77 633 70 636 74 0.7681333 0.267272
06‐12‐2010_9hr 127 148.5843 112 628 107 630 110 0.5620699 0.2369895
06‐13‐2010_23hr 262 285.1845 193 742 188 747 188 0.8584513 0.436349
06‐16‐2010_18hr 133 185.6865 114 640 111 642 112 1.074938 0.4529689
06‐18‐2010_20hr 271 255.0522 193 645 178 647 191 0.9646558 0.5268644
06‐19‐2010_11hr 308 206.2307 213 553 184 554 212 1.018775 0.6317031
06‐20‐2010_23hr 145 146.7086 111 621 90 630 102 1.107528 0.4648856
06‐23‐2010_16hr 63 81.94394 59 505 57 506 58 0.6240312 0.213087
07‐11‐2010_9hr 325 195.1761 161 676 152 680 157 2.853286 1.388365
07‐14‐2010_22hr 134 141.7851 104 606 86 613 97 1.055211 0.434636
07‐16‐2010_17hr 151 166.6915 112 649 109 651 110 1.160479 0.4813444
07‐20‐2010_4hr 164 155.2223 129 592 115 598 123 0.8200834 0.3808924
07‐24‐2010_17hr 120 93.92097 97 443 86 447 93 0.8842315 0.411906
08‐13‐2010_19hr 196 182.8227 151 629 137 636 144 0.873698 0.4257172
08‐20‐2010_13hr 451 279.8458 305 620 242 646 279 1.166685 0.8016547
08‐31‐2010_19hr 164 173.6378 135 657 117 668 124 0.916504 0.412015
5 ANALYSING SOCIAL MEDIA
This section presents preliminary results on the
development of machine learning algorithms that
can be used to analyse social media postings as a
storm hits a geographic region of interest. People’s
KDIR2014-InternationalConferenceonKnowledgeDiscoveryandInformationRetrieval
312

perceptions about events they encounter are often
embodied in words, terms, and phrases that form
their spoken language as the ones found in social
media posts. These perceptions may be influenced
by inherent regional characteristics and they are
further modulated by specific local features or a
situation surrounding a person. Doran et al. (2013)
developed a methodology, based on a probabilistic
language model that extracts perceptions from
online social media postings that may be relevant to
assist utilities in near real-time identifying specific
locations where power outages have occurred.
Authors suggest that the analyses of these
perceptions will be a useful add-on to physical
sensors deployed in the smart grid and current
analytic methods that utilities have at their
disposition. On-the-ground perceptions from humans
as they experience a storm can provide insights
which may allow utilities to quickly evolve their
response plan. New York City faced two major
storms during our data collection period: hurricane
force winds during a January rain storm, and a snow
storm that piled on over a foot of heavy, wet snow.
Both these storms caused scattered citywide power
outages due to heavy winds (Johnson, 2004) and the
weight of melting snow on trees and power lines
over subsequent days. Since outage maps during
these events are unavailable, regions with the
perception “power outage” are identified utilizing
the data analytics method presented in Doran et al.
(2013) in Figure 5a. The locations of these
perceptions reflect the scattered nature of the
reported outages. Physical sensors in the smart grid
can identify locations of outages, but they cannot
explain their cause. A possible hypothesis is that
heavy winds and wet snow led to downed trees and
branches causing power outages. To confirm this
hypothesis, the language models developed in Doran
et al. (2013) were queried with the phrase “damaged
tree”. The heat map in Figure 5b shows that people
discuss damaged trees in sub-regions that either
Figures 5a and 5b: Storm response perceptions.
overlap or are adjacent to those where power has
been lost. For example, the perceptions of power
outage and damaged trees are strongly exhibited
near SoHo and close to Sara Roosevelt Park. With
this supplementary information at hand, a city can
adjust its storm response to position workers and
machines to clear branches and other debris caused
by damaged trees.
6 CONCLUSIONS
As power transmission and distribution grids
expand, a larger number of equipment and power
lines are exposed to strong storm conditions and
potentially to catastrophic damages. Utilities have
limited tools to proactively address the damages that
storms such as hurricanes and ice storms can cause
to the grid. With the advent of the smart grid,
predictive storm damage models can be developed
using a rich variety and quantity of data generated
by cheap and accurate sensing technologies, geo-
spatial databases, and on-line social media. This
paper presents a data analytics framework and two
experiments on how utilities can use these data to
become more proactive in storm planning.
REFERENCES
Bahl, L. R., Jelinek, F., and Mercer, R. L. 1983. A
maximum likelihood approach to continuous speech
recognition. In IEEE Transactions on Pattern Analysis
and Machine Intelligence. pp. 179–190.
Batty, M., K. Axhausen, F. Giannotti, A. Pozdnoukhov,
Bazzani, A., Wachowicz, M., Ouzounis, G., and
Portugali, Y. 2012. Smart cities of the future. The
European Physical Journal, vol. 214, pp. 481–518.
Caragliu, A., Bo, C. D., and Nijkamp, P. 2009. Smart
cities in Europe. Vrije Universiteit, Faculty of
Economics and Business Administration.
Cerruti B. and Decker S. 2012. A Statistical Forecast
Model of Weather-Related Damage to a Major
Electric Utility. Journal of Applied Meteorology and
Climatology, Vol. 51. (February 2012).
Doran, D., Gokhale, S., and Dagnino, A. 2013. Human
Sensors for Smart Cities. Workshop on Social Network
Analysis in Applications (SNAA 2013), co–located
with the 2013 International Conference on Advances
in Social Networks Analysis and Mining, August 25-
28, Niagara Falls, Canada.
Johnson, B. 2004. Utility storm restoration response.
Edison Electric Institute (January 2004).
Klein, K. Springer, P., and W. Black, W. 2010. Real-Time
Ampacity and Ground Clearance Software for
Integration Into Smart Grid Technology. In IEEE
DataAnalyticsforPowerUtilityStormPlanning
313

Transactions on Power Delivery.
Holdaway, M.R. 1996. Spatial modelling and interpolation
of monthly temperature using kriging. Climate
Research, 6, 215–225.
Earls, J. and Dixon B. 2007. Spatial Interpolation of
Rainfall Data Using ArcGIS: A Comparitive Study.
http://gis.esri.com/library/userconf/proc07/papers/pap
ers/pap_1451.pdf.
IBM whitepaper. 2010. Electric Utility gets ahead of the
weather with new forecasting models. IBM.
Porter, C., Baranowsky, B. C., Clarke, B., and Shaw B.
2012. The Polarimetric Radar Identification System
(POLARIS): Leveraging Dual Polarized Radar data
for real Time Operational Applications. Extended
Abstracts, 28th Conference on Interactive Information
Processing Systems (IIPS), American Meteorological
Society.
McManus, G. et al. 2008. Development and Testing of an
Ice Accumulation Algorithm. Extended Abstracts,
17th Conference on Applied Meteorology, American
Meteorological Society.
Wang, U.2012. A New Weapon for Storm Responders:
Send in the Drones. EPRI Journal. Summer issue.
KDIR2014-InternationalConferenceonKnowledgeDiscoveryandInformationRetrieval
314
