
Competency Mining in Large Data Sets
Preparing Large Scale Investigations in Computer Science Education
Peter Hubwieser and Andreas Mühling
TUM School of Education, Technische Universität München, Arcisstr. 21, 80333 München, Germany
Keywords: Large Scale Studies, Competencies, Item Response Theory, Rasch Model, Computational Thinking.
Abstract: In preparation of large scale surveys on computer science competencies, we are developing proper compe-
tency models and evaluation methodologies, aiming to define competencies by sets of exiting questions that
are testing congruent abilities. For this purpose, we have to look for sets of test questions that are measuring
joint psychometric constructs (competencies) according to the responses of the test persons. We have devel-
oped a methodology for this goal by applying latent trait analysis on all combinations of questions of a cer-
tain test. After identifying suitable sets of questions, we test the fit of the mono-parametric Rasch Model and
evaluate the distribution of person parameters. As a test bed for first feasibility studies, we have utilized the
large scale Bebras Contest in Germany 2009. The results show that this methodology works and might re-
sult one day in a set of empirically founded competencies in the field of Computational Thinking.
1 INTRODUCTION
Since 2000 the Organisation for Economic Co-
operation and Development (OECD) is conducting
the well-known international PISA (Programme for
International Student Assessment) studies. Most
member states of the OECD and a growing number
of partner countries are conducting these studies in
3-year cycles. While some of the political implica-
tions are under discussion, the scientific community
had to acknowledge that the PISA studies follow a
sophisticated, well-founded methodology that had a
ground-breaking impact on the whole field of empir-
ical educational research.
So far, the focus of PISA has been on mathemat-
ics, natural science and language understanding. Yet,
in our opinion, a PISA survey of computer science
(CS) competencies would advance the research
methodologies of Computer Science Education
(CSE) in a pioneering way, lifting this field on the
level of educational research in traditional subjects.
However, this would require considerable prerequi-
site work. First, we have to agree on a normative
grounding of computer science abilities that is com-
monly accepted. Second, we need a properly defined
competency model, derived from this grounding,
which would provide a framework for measure-
ments. Some of this work is already done (see e.g.
(Magenheim et al. 2010), but substantial research
efforts are still required. Finally, we need a test field
of sufficiently large scale to develop and explore
competency definitions and test methodologies in
our subject domain. All in all, this would take sever-
al more years before we can even start with the de-
sign of large scale investigations according to such a
purely sequential strategy.
Consequently, we considered a possible parallel-
ization of these steps. As the definition of competen-
cy models according to the usually applied method-
ology (see e.g. Klieme et al. 2004) is requiring a
careful study of literature and many expert inter-
views, it represents the most time-consuming step.
Yet, it is generally accepted in educational research
to alternatively define a competency by a set of test
items that require exactly this competency to be
solved (Schott & Azizi Ghanbari 2009). However, a
necessary precondition for such a definition is that
such a set of test items is homogenous in the sense
that all items are measuring a common psychometric
construct, which could be identified with the re-
specting competency. Therefore, we were looking
for tests or examination results in CS that might
comprise such homogenous sets of items. Once we
have found such sets, we could assume that each of
those would represent a certain competency. To
measure these competencies, we could simply use
sets of questions that are very similar to those who
had defined the respective competency. Compared to
315
Hubwieser P. and Mühling A..
Competency Mining in Large Data Sets - Preparing Large Scale Investigations in Computer Science Education.
DOI: 10.5220/0005129203150322
In Proceedings of the International Conference on Knowledge Discovery and Information Retrieval (KDIR-2014), pages 315-322
ISBN: 978-989-758-048-2
Copyright
c
2014 SCITEPRESS (Science and Technology Publications, Lda.)
the usual methodology, this would be much easier to
validate. These sets of test questions could be re-
garded as a first draft of a large scale survey on
computer science competencies that could be uti-
lized to develop and apply proper test and evaluation
methodologies.
Unfortunately, quite large data sets are required
to assess the homogeneity of item sets, e.g. about
5.000 data sets for a set of 10 questions (Bartholo-
mew et al. 2008). Taking into account the typical
rates of non-responses or partial responses in such
tests, we assume that we need tests with at least
10.000 participants in order to get workable results.
Given the large amount of data and the explorative
approach, this is a typical data-mining scenario.
As far as we know, the only event of sufficient
large scale in computer science is the annual Bebras
online contest (www.bebras.org), see section 3.2.
We investigated by explorative statistical methods, if
there are subsets of questions among the question
sets of a certain Bebras contest that “measure” a
common psychometric construct (or competence).
For this purpose, we have programmed several R
scripts that perform an exhaustive search of the
smallest suitable sets of 4 questions and use the
results to investigate larger sets.
In this paper, we will describe this methodology,
using the German Bebras contest of 2009 as an ex-
ample. This contest was attended by about 120.000
students. Additionally, we will present some inter-
esting results regarding the difference in the out-
comes for certain groups of participants, discrimi-
nated by gender, number of team members, and
states.
2 BACKGROUND
2.1 Competencies
Stimulated by the detection of the phenomenon of
“tacit knowledge” and the upsetting results of the
first large scale studies of learning outcomes TIMSS
(Trends in International Mathematics and Science
Study) and PISA, during the first years of this centu-
ry the focus of education has shifted from
knowledge and learning outcomes towards compe-
tencies.
In this paper, we will refer to the well-known
definition of competence by Weinert (Weinert
2001), who defined competencies as “the cognitive
abilities and skills possessed by or able to be learned
by individuals that enable them to solve particular
problems, as well as the motivational, volitional and
social readiness and capacity to use the solutions
successfully and responsibly in variable situations.”
Furthermore, he stressed that competencies may be
composed of several facets: ability, knowledge,
understanding, skills, action, experience, and moti-
vation.
Due to their complex structure, it is apparent that
the definition and the measurement of competencies
are not an easy matter. According to Klieme et al.
(Klieme et al. 2004), “competence
can only be assessed and measured in terms of
performance.
forms the link between knowledge and skills
and can be seen as the ability to deal with sit-
uations or tasks. Any illustration or operation-
alization of a competence must therefore re-
late directly to a concrete situation.”
Additionally, Klieme et al. stress that “Compe-
tencies cannot be reflected by or assessed in terms of
a single, isolated performance. Rather, the range of
situations in which a specific competence takes
effect always spans a certain spectrum of perfor-
mance. Narrow assessments cannot meet the re-
quirements of competency models. The seven facets
of competence listed above make it quite clear that
competence must be assessed by an array of tasks
and tests that do more than simply tap factual
knowledge”. Even more, some authors identify the
competency with a set of tasks, e.g. (Schott & Azizi
Ghanbari 2009) p. 15 (translated by the authors): “A
competency consists of certain sets of tasks that can
be performed by those who have this competency”.
In the light of these statements, it seems possible
to define a competency by a set of tasks.
2.2 Item Response Theory
Most surveys of competencies are currently evaluat-
ed according to the Item Response Theory (IRT),
which treats the constructs of interest (e.g. compe-
tencies) as latent psychometric constructs that can’t
be measured directly. Yet, the probability of correct
answers depends on those constructs in a certain
way:
(1)
θ
i
is the parameter of person i, representing the
manifestation of the psychometric construct, β
k
the
parameter of Item k, representing its difficulty, and
f(θ
i
,β
k
) a function that is determined by the psycho-
metric model (e.g. the Rasch Model (RM), see be-
low) that is assumed to fit the observations. In most
KDIR2014-InternationalConferenceonKnowledgeDiscoveryandInformationRetrieval
316

cases these parameters have to be estimated by ef-
fortful numerical calculations.
Depending on the structure of the psychometric
constructs that are to be measured, several different
models may be considered, e.g. unidimensional
models that cover only one single latent variable or
alternatively multidimensional models. One of the
simplest and most widely used ones is the basic
unidimensional (monofactorial) RM with one pa-
rameter (1F1P):
(2)
The graph of this function looks like the ones
displayed in figure 1 for a set of Bebras questions.
These graphs are called Item Characteristic Curves
(ICCs).
Provided that this model is applicable, some very
convenient simplifications can be made. For exam-
ple, the sum over the scores of all individual items is
a sufficient statistics, which means that the (estimat-
ed) person parameter depends only on the total
number of correct answers of this person. It does not
matter, which questions the person had responded to
correctly. Yet, this model is applicable only if the
ICCs have (at least nearly) the same slope. This
slope is represented by an additional Discrimination
Parameter δ
k
in the 2-parametric RM (1F2P):
(3)
In both cases, three general preconditions have
to be met for the application of the RMs:
1) Homogeneity of items: All items are measuring
the same psychometric construct.
2) local stochastic independence: the underlying
psychometric construct is the only coupling fac-
tor between items.
3) specific objectivity: for all samples from the
population, the item parameters are independent
from the specific sample; the same holds for all
samples of questions and person parameters.
3 THE CONTEXT
3.1 The PISA Surveys
The PISA studies are of very large scale and investi-
gate how well an educational system prepares chil-
dren for their adult life regarding certain abilities, for
example in mathematics. According to (OECD
2013), the 5th survey in 2012 “assessed the compe-
tencies of 15-year-olds in reading, mathematics and
science (with a focus on mathematics) in 65 coun-
tries and economies. [..] Around 510 000 students
between the ages of 15 years 3 months and 16 years
2 months participated in PISA 2012 representing
about 28 million 15-year-olds globally. The students
took a paper-based test that lasted 2 hours. The tests
were a mixture of open-ended and multiple-choice
questions that were organized in groups based on a
passage setting out a real-life situation.”
The PISA surveys follow a carefully worked out
process model (Seidel & Prenzel 2008). The first
step is to define the research objectives. In the sec-
ond step, the framework for the assessment of com-
petencies has to be developed (see above). The next
step is test development. For this, proposals for the
questions are collected from experts. The questions
should test complex abilities that are required to
solve real-world problems. Each question may com-
prise one or more items, which will represent the
units of measurement at the end. Exemplary ques-
tions can be found at http://pisa-sq.acer.edu.au.
The proposals are evaluated and validated re-
garding the competencies that are intended to be
measured. The tasks that are selected according to
certain criteria are translated to all languages of the
participating countries. Following this, a field trial is
conducted by all participating countries of PISA one
year before the main study. The items to be included
in the main study are selected according to the re-
sults of the field trial. Finally, the main study is
carried out identically to the field trial, except for a
much larger sample. The complicated research de-
sign of PISA is well-founded in theory. It encom-
passes cross- and -longitudinal-sections, which are
supported and combined by diagonal sections
(Seidel & Prenzel 2008). Following this, open for-
mat test items are coded according to the manuals
and data are cleaned. The item and person parameter
are estimated according to IRT, applying multidi-
mensional, mixed models. To be able to interpret the
results more easily, the item difficulties and person
estimates are normalized in such a way that the es-
timates have a mean of 500 and standard deviation
of 100.
3.2 The Bebras Contest
The Bebras contest was founded by V. Dagiene, see
(Dagiene 2008), who named it according to the
Lithuanian word for (Busy) “Beaver”. According to
CompetencyMininginLargeDataSets-PreparingLargeScaleInvestigationsinComputerScienceEducation
317

the founders (Dagiene & Futschek 2008), the Bebras
Contest aims to interest children and adolescents in
typical problems of computer science and does not
require prerequisite knowledge (at least officially).
In consequence, the Bebras Contest does not intend
to be a test originally. Nevertheless, in absence of
other test fields, we decided to investigate this con-
test and find out what it would measure if it were a
test.
Similarly to PISA, the tasks are proposed by the
members of an international board of experts. Fol-
lowing this, the tasks are discussed, assessed and
selected by this board according to their fitting to the
goals of the contest. In contrary to PISA, the tasks
are not pre-tested. Exemplary questions are para-
phrased in table 3.
The contest started in 2004 in Lithuania with
3470 participants and has grown to 523.319 partici-
pants in 21 countries in 2013, which represents a
scale very similar to PISA (see section 3).
The German issue of Bebras (called Informatik-
Biber, see www.informatik-biber.de) is performed in
all German federal states and in all types of second-
ary schools. It is the largest of all national Bebras
contests (206.430 participants in 2013), followed by
France (171.932).
In Germany, the contest comprises 18 multiple
choice questions for each of the 4 age groups (see
table 1). The difficulty of the questions is assessed a
priori by the board of experts that selects the ques-
tions for the national contests. The students have the
choice to take the test alone or together with a part-
ner. The test is performed online. In each age group
a different set of questions - in total 18 - has to be
answered, out of a pool of 39. Yet, some of the 39
different questions of the contest were presented to
several age groups. If the same question is posed to
more than one group, a different degree of difficulty
can be applied for each group.
Table 1: German Bebras age groups since 2009.
Group Grades Age approx.
AG1 5-6 10-12
AG2 7-8 12-14
AG3 9-10 14-16
AG4 11-13 16-19
4 THE DATA
To date, we have acquired the German Bebras data
of the years 2007-2010, 2011 and 2013. Due to
technical reasons, we chose the data of competition
No 33 (October 2009) for this feasibility study.
The relational data base of Bebras 2009 was com-
posed of 18 tables. At first the raw data was read,
verified and put into suitable format by several SQL
statements. Basically two types of tables were pro-
duced: result-tables (one for each age group) for the
responses of the participants to the questions and
one participant-table for the personal attributes of
the participants, e.g. gender, grade or school type.
All analysis steps were performed in GNU R.
In a second step, we produced the pattern-tables
from the result-tables, having 18 columns, each
representing one question, and one row for each
participant. The original score values of the ques-
tions cover a range from -3 to +12, depending on the
difficulty by the experts. For our purpose, we had to
transform these values to a dichotomous scale. For
this, we represented the correct answers by 1 and the
incorrect ones by 0. As the original 0-values (mean-
ing “no answer”) could have been caused by many
reasons, e.g. running out of time or laziness, we
decided to delete all data sets with any “no answer”
values. Due to the large scale of the contest, a quite
satisfying numbers of 38.873 participants remained.
The distribution over the four age groups was as
follows: 8221 in AG1, 15547 in AG2, 11672 in
AG3, and 3433 in AG4.
Additionally, we had to distinguish in the partic-
ipant-tables between persons who worked alone and
those who worked in pairs.
5 METHODOLOGY
As already explained, we assumed that certain sets
of Bebras questions represent some kind of psycho-
metric test that measures certain joint psychometric
constructs (or competencies). Hence, our research
question was whether there are subsets of questions
that are measuring such joint (combinations of)
psychometric constructs (competencies) and if so,
which construct(s) this might be. We will call such
sets of questions homogenous from now on. For this
purpose, we explored all possible subsets of ques-
tions. This process was automatically performed by
a set of R-scripts.
Traditionally, classical explorative factor analy-
sis is applied for the purpose of detecting subsets of
questions that measure joint personal abilities. Yet,
as our score format is dichotomous, this is not appli-
cable, as explained in (Bartholomew et al. 2008).
Additionally, we were looking for a method that is
more suitable to the IRT principles. Hence, we chose
the methodology of latent trait analysis (LTA) as
presented in Chapter 8 of (Bartholomew et al. 2008).
KDIR2014-InternationalConferenceonKnowledgeDiscoveryandInformationRetrieval
318
5.1 Latent Trait Analysis
According to this methodology, it is assumed that
the responses of the students to a certain set of ques-
tions can be described by a certain psychometric
model, for example by the monofactorial Rasch
Model (Rost & Carstensen 2002) with one parameter
(1F1P), which is explained in section 2.2.
The outcome of our contest is a set of dichoto-
mous response patterns (one pattern per participant)
that was recorded by the Bebras online system. For p
questions, we have 2
p
possible response patterns.
From this outcome, one can estimate both the person
and item parameters from the results of the contest
using an expectation-maximization algorithm. Based
on this estimation, by calculating the probability P in
equation 1 of section 2.2, the expected number of
occurrences E(r) of all possible response patterns r
can be calculated.
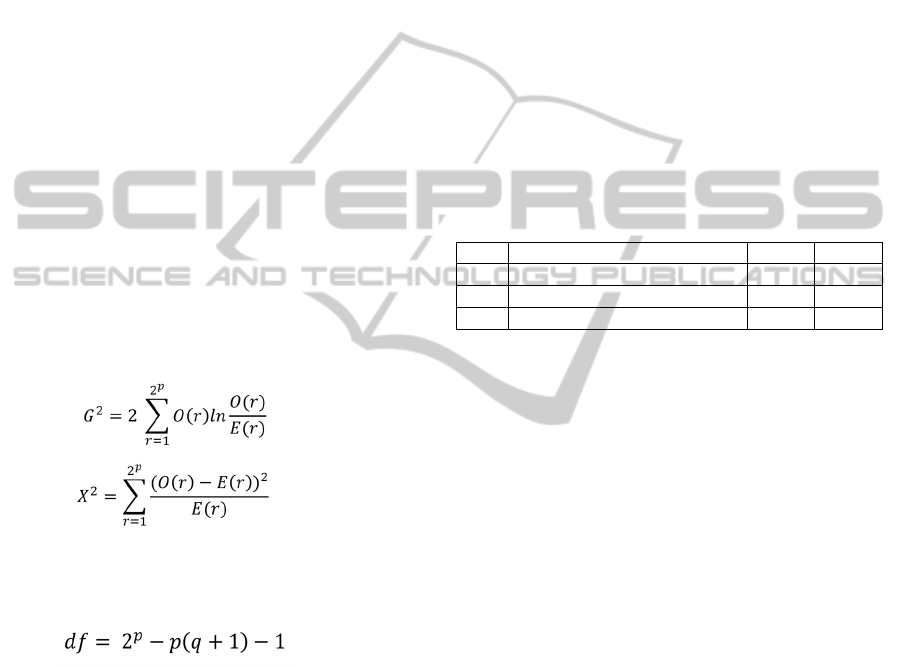
In the next step these expected frequencies E(r)
are compared to the actually measured pattern fre-
quencies O(r). Based on the differences, two differ-
ent test statistics are calculated that describe the
deviation of the expected from the measured values:
the log-likelihood statistic G
2
(see Equation 4) and a
X
2
statistic (See Equation 5).
(4)
(5)
As both statistics are approximately
2
distribut-
ed, we can estimate the quality of the model-fit with
df degrees of freedom, where
(6)
As a precondition for this calculation, there has
to be a sufficient number of datasets. According to
(Bartholomew et al. 2008), it has to be large enough
to ensure that the frequency of each pattern has an
expectation value of more than 5. In the case of 6
questions for example, this results in a minimum of
320 data sets. For testing all 18 questions of an age
group, we would need more than 1.3 Mio partici-
pants.
Unfortunately, this method is confirmatory in na-
ture and therefore requires an a priori defined set of
questions that is to be tested. We applied a brute
force approach, calculating both statistics G
2
and X
2
for all possible combinations of p = 3, 4, 5, 6 out of
the total set of 18 questions per age group.
Finally, we selected those combinations where the
RM has shown a sufficiently good prediction of the
observed results. More precisely, we have selected
all combinations of the p questions where both G
2
and X
2
did not exceed the
2
limits for the respecting
values of df (see equation 6), which are:
2
= 3.8 (p=3), 14.1 (p=4), 32.7 (p=5), 68.7 (p=6).
The computing was executed applying the ltm
package of R (Rizopoulos 2006).
It turned out that a lot of 3-question combina-
tions (more than 30), many 4-question combinations
(10-20), only a few (0-4) 5-question combinations
and no 6-question combinations meet the require-
ments of this Likelihood analysis. Driven by the goal
to find preferably large combinations, we decided to
focus on the 5-question combinations from this point
on. In AG1, we found 3 combinations (see table 2),
in AG2 four, in AG3 none and in AG4 three.
Table 2: Results of latent trait analysis in AG1.
No Combination (questions X…) G
2
X
2
1 X156 X162 X164 X184 X187 16.33 16.47
2 X156 X164 X184 X187 X189 30.72 30.68
3 X156 X164 X184 X187 X194 28.60 29.09
5.2 Rasch Model Tests
Although LTA already suggests that the mono-
parametric and mono-factorial RM will fit quite well
on our data, there remain some uncertainties. Most
important, LTA is focused solely on the item diffi-
culties and parameters, neglecting the distribution of
person parameters, as demanded by the precondition
of specific objectivity (see section 2.2). Although we
have apparently found a good model, there may be
an even better fitting one (e.g. the RM with two
parameters). Therefore, we have performed a set of
standard tests for the fit of the RM, which are pre-
sented in the following for one exemplary combina-
tion of questions selected from AG1.
First, we applied different latent trait models on
the pattern matrix, using the packages ltm and eRm
in R: We applied the RMs with 1 factor and 1 pa-
rameter (1F1P), 1 factor and 2 parameters (1F2P), 2
factors (2F), and two factors with interaction param-
eter (2FI).
Next, we performed an ANOVA comparison of
all applied models, comparing the values for AIC,
BIC and Log-Likelihood. The result was quite ac-
ceptable in all cases, indicating the 1F1P model was
not fitting significally worse than 1F2P or the two-
factor models.
The following tests of specific objectivity (see
section 2.2) follow the joint assumption that the
CompetencyMininginLargeDataSets-PreparingLargeScaleInvestigationsinComputerScienceEducation
319
Likelihood of a well-fitting model should be nearly
the same for any subgroup of participants. In other
words, the predictive power of the model should be
independent of the particular set of participants that
was chosen to estimate it. For this purpose the per-
sons are split in subgroups according different crite-
ria. We applied the splitting criteria median (respec-
tively mean), values of combination score and gen-
der. For these subgroups a test-specific statistic,
basically representing the Likelihood of this model
given the estimated parameters, is calculated. Final-
ly, the p-value for the hypothesis that the statistic
would be equal for all subgroups is calculated. The
hypothesis (and thus the model) is rejected if p < α =
0.05. We have applied three different tests, again
using the eRm package in R: the Likelihood-Ratio-
Test according to Andersen (Andersen 1973) the
Martin-Löf-Test (see Martin-Löf 1974) and the
Wald-Test (see Wald 1943). While the Martin-Löf-
Test and the LR tests regarding median/mean and
score were passed by all question combinations,
only the two combinations AG1-1 and AG1-3
passed the LR-Test regarding gender.
On the question level, the Wald test demonstrat-
ed the same problematic nature of the gender split-
ting, because all but two combinations (again AG1-1
and AG1-3) included questions that produced p-
values below 0.05. According to the Wald test on
median/mean, there were questions in the combina-
tions AG2-1, AG2-3, and AG2-4 that would have to
be excluded.
In summary, over all age groups only the two
combinations AG1-1 and AG1-3 (of the originally
10) passed all tests without any problems. Thus,
when looking for a suitable set of homogenous test
questions, those would be the ones to consider.
Interestingly, both combinations are very strong-
ly correlated with the total score over all 18 ques-
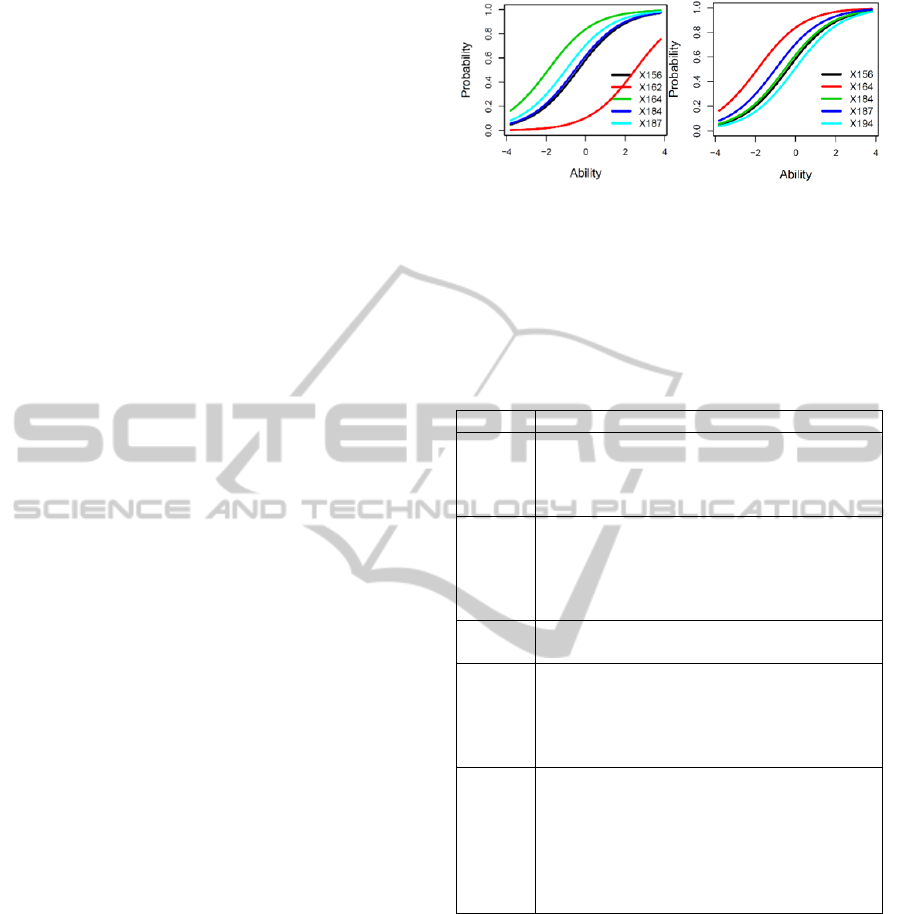
tions (0.74 vs. 0.77). In figure 1, the ICCs of AG1-1
of the 1F1P model are displayed.
Aiming to assess the suitability for test applica-
tion, we calculated the standard deviation of the
difficulty parameters by applying 1F1P and the dis-
crimination parameter according to 1F2P. In order to
represent a good set of Rasch test items, the former
would have to be large, allowing to measure the
person parameters over a large scale, while the latter
would have to be low, avoiding cross-overs of the
Item Characteristic Curves (ICC), see figure 1. It
turned out that AG1-1 was clearly better than AG1-
3, due to its higher variation in difficulty (1.43 vs.
0.62) and its lower variation in discrimination (0.04
vs. 0.07).
Figure 1: Item Characteristic Curves of AG1-1 and 3.
Due to its quite good homogeneity, we will con-
duct the exemplary student evaluation with AG1-1.
In table 3 the five questions of AG1-1 are para-
phrased, ordered by increasing item difficulties ac-
cording figure 1.
Table 3: The Bebras questions of AG1-1.
No Given information and question
X164
Picture of 3 stones in a river and several tree
trunks, building ways over the river. Which
stone has to be passed by every way over the
river
X187
Graph, representing a finite state machine.
The input are the letters of a name, the final
states (numbers) are the levels in a building
where the person with this name lives. On
which level does Jan live?
X184
Different patterns of squares. Which pattern
does not allow to build a square from?
X156
Grid of crossroads; position of school build-
ing; Formalization rule for the choices at each
crossing: L (left), R (right), S (straight);
Where was the starting point of path L-R-L-S,
which ends at the school building?
X162
Different combinations pi of clotheslines, tied
to poles: three pre-situations p1, p2, p3 that
were transformed to given post-situations p1’,
p2’, p3’ by an unknown rule; pre-situation p4
without post-situation; How many lines have
to be added to p4 according to the same rule
that had transformed p1, p2, p3?
5.3 Evaluation of Person Parameters
To illustrate our methodology, we have conducted
an exemplary evaluation of the most homogenous
and suitable question combination AG1-1.
First we compared the mean scores of different
groups of participants: singles and pairs, girls and
boys (see table 4.). Considering the scale properties,
the proper significance test for the differences is the
2-side approximate Gauss Test (Bamberg, Baur &
Krapp 2011). The theta-values of person parameters
were normalized according to the PISA scale, which
KDIR2014-InternationalConferenceonKnowledgeDiscoveryandInformationRetrieval
320
results per definition in a mean of 500 and a stand-
ard deviation of 100 points (over all participants).
Table 4: Differences in score means.
Total scores
18 questions
AG1-1
PISA
score
All boys –
all girls
0.58* 21*
Singles –
pairs
-0.90* -28*
Single boys –
single girls
0.62* 22*
Male pairs –
fem. pairs
0.47* 17
*Significant difference for α = 0.05.
Apparently, the boys show a significant better
performance compared to the girls. Also, the pairs
performed better than the singles. As the difference
in the mathematical competence between boys and
girls in PISA 2012 was only 11 points in the OECD
average (OECD 2013), these results seem quite
considerable.
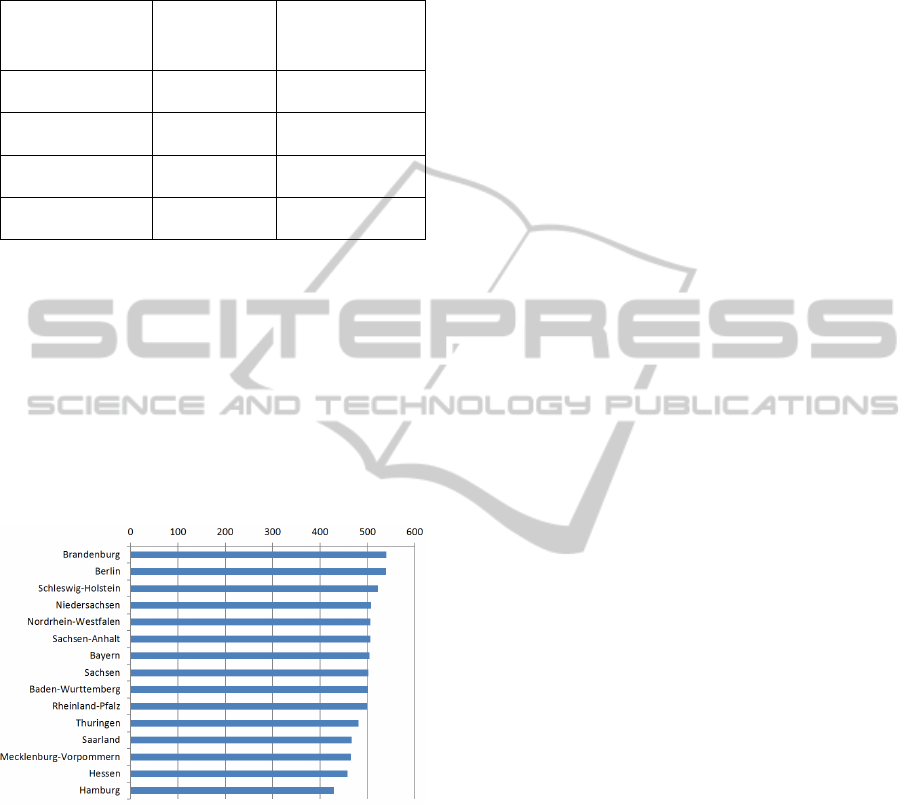
Second, we have ranked the German federal
states (“Länder”) according to the performance of
their students in grade 5 and 6 (see figure 2).
Figure 2: Performance of the German Länder in grade 5-6.
Again, these differences seem quite notable
compared to the range of PISA results in Mathemat-
ics. While Brandenburg (540) would be in second
place, Hamburg (430) would be ranked last but two
among all OECD countries.
6 DISCUSSION
First, we have to stress once again that the Bebras
Contest is not a PISA like study. This might be the
most probable reason for the low number of question
combinations that are measuring some homogenous
psychometric constructs in a suitable way. Addition-
ally, as pointed out in the introduction, the Bebras
contest does (at least officially) not require any pre-
requisite knowledge. In view of the postulated cog-
nitive component of competencies, this puts into
question whether or not the questions are measuring
competencies at all. Further, compared to PISA, the
participation is nearly totally uncontrolled. Thus, the
sampling might provide serious biases, because at
least in some regions only classes of very interested
and motivated teachers might participate. Regarding
the work on the questions, it is not clear which assis-
tance the students had, e.g. by the teacher or other
peers.
On the other hand, despite all these deficits com-
pared to a proper large scale study, our methodology
has produced some remarkable results. First, it is
amazing that there is a coherence between 17 ques-
tions that are contained in any of the combinations
selected by the LTA over all age groups, while none
of the remaining 12 shows up in any of these combi-
nation. This suggests that those 17 questions are
measuring some joint construct, while the remaining
12 don’t show any commonality. Yet, the quality of
the 17 questions seems not high enough to represent
good test items which is easy to explain considering
the goals of the Bebras contest.
Additionally, the results we have found when us-
ing the most homogenous set of questions AG1-1
and analysing student performance, seem very rea-
sonable compared to the PISA results in Mathemat-
ics. Although basic skills of computer science are
not part of mathematical competencies, they seem
quite close and related to those. Therefore the results
can be expected to be similar in nature.
7 CONCLUSIONS
In conclusion, we have presented an exploratory
analysis of the questions of the German Bebras con-
test of 2009, regarding the homogeneity of the
measured competencies. While the results are prom-
ising, our main goal was to propose a methodology
in form of a specific process of evaluation and a
proof of concept for this. We will apply this meth-
odology to the remaining sets of German Bebra data
up to 2013. Hopefully, this will yield more homoge-
nous sets of questions.
Furthermore, one of our next steps has to be a
qualitative analysis of the cognitive demands of the
selected questions, e.g. which CSTA standards
(Tucker et al. 2011) are tested by them. Eventually,
CompetencyMininginLargeDataSets-PreparingLargeScaleInvestigationsinComputerScienceEducation
321

this will allow us to describe the psychometric con-
structs that we have in terms of Computational
Thinking (Wing 2006). In the long run, we hope to
identify several competency components of Compu-
tational Thinking in this way. At the end, these
might be combined to construct a structural compe-
tency model, suitable to serve as a framework for a
multidimensional test in large scale, e.g. in the con-
text of PISA.
REFERENCES
Andersen, EB 1973, 'A goodness of fit test for the rasch
model', Psychometrika, vol. 38, no. 1, pp. 123–140.
Bamberg, G, Baur, F & Krapp, M 2011, Statistik,
Oldenbourg, München.
Bartholomew, DJ, Steel, F, Moustaki, I & Galbrath, JI
2008, Analysis of multivariate social science data,
CRC Press / Taylor & Francis, Boca Raton Fla.u.a.
Dagiene, V 2008, 'Bebras International Contest on Infor-
matics and Computer Literacy Criteria for Good
Tasks', Lecture notes in computer science, pp. No.
5090 (2008),19-30.
Dagiene, V & Futschek, G 2008, 'Bebras International
Contest on Informatics and Computer Literacy: Crite-
ria for Good Tasks'. Informatics Education - Support-
ing Computational Thinking, Third International Con-
ference on Informatics in Secondary Schools - Evolu-
tion and Perspectives, ISSEP 2008, Torun, Poland, Ju-
ly 1-4, 2008, eds RT Mittermeir & MM Syslo, Spring-
er, pp. 19-30.
Klieme, E, Avenarius, H, Blum, W, Döbrich, P, Gruber,
H, Prenzel, M, Reiss, K, Riquarts, K, Rost, J, Tenorth,
H & Vollmer, HJ 2004, The Development of National
Educational Standards. An Expertise, Bundes-
ministerium für BildungundForschung, Berlin.
Magenheim, J, Nelles, W, Rhode, T, Schaper, N, Schu-
bert, SE & Stechert, P 2010, 'Competencies for infor-
matics systems and modeling: Results of qualitative
content analysis of expert interviews'. Education En-
gineering (EDUCON), 2010 IEEE, pp. 513–521.
Martin-Löf, P 1974, 'Exact tests, confidence regions and
estimates' in Proceedings of Conference on Founda-
tional Questions in Statistical Inference. (Aarhus,
1973), Univ. Aarhus, Aarhus, pp. 121–138.
OECD (ed.) 2013, PISA 2012 Results in Focus. What 15-
year-olds know and what they can do with what they
know, OECD Publishing, Paris.
Rizopoulos, D 2006, 'ltm: An R Package for Latent Varia-
ble Modeling and Item Response Analysis', Journal of
Statistical Software, vol. 17, no. 5, pp. 1–25.
Rost, J & Carstensen, CH 2002, 'Multidimensional Rasch
Measurement via Item Component Models and Facet-
ed Designs', Applied Psychological Measurement, vol.
26, no. 1, pp. 42–56.
Schott, F & Azizi Ghanbari, S 2009, 'Modellierung,
Vermittlung und Diagnostik der Kompetenz
kompetenzorientiert zu unterrichten – wissen-
schaftliche Herausforderung und ein praktischer
Lösungsversuch', Lehrerbildung auf dem Prüfstand,
vol. 2, no. 1, pp. 10–27.
Seidel, T & Prenzel, M 2008, 'Assessment in Large-Scale
Studies' in Assessment of competencies in educational
contexts, eds E Klieme, D Leutner & J Hartig, Hogrefe
& Huber Publishers, Toronto, pp. 279–304.
Tucker, A, Seehorn, D, Carey, S, Moix, D, Fuschetto, B,
Lee, I, O’Grady-Cuniff, D, Stephenson, C & Verno, A
2011, CSTA K-12 Computer Science Standards. Re-
vised 2011. CSTA Standards Task Force, CSTA.
Available from:
Wald, A 1943, 'Tests of Statistical Hypotheses Concerning
Several Parameters When the Number of Observations
is Large', Transactions of the American Mathematical
Society 1943, pp. 426–482.
Weinert, FE 2001, 'Concept of Competence: A conceptual
clarification.' in Defining and Selecting Key Compe-
tencies, eds DS Rychen & L Salganik, Hogrefe and
Huber, Seattle.
Wing, JM 2006, 'Computational thinking', Commun. ACM,
vol. 49, no. 3, pp. 33-35.
KDIR2014-InternationalConferenceonKnowledgeDiscoveryandInformationRetrieval
322
