
A Holistic Seismic Risk Scheme Using Fuzzy Sets
Part One: The Social System Fragility
J. Rub
´
en Gonz
´
alez
1
,
`
Angela Nebot
2
, Francisco Mugica
2
, Martha-Liliana Carre
˜
no
3
and Alex H. Barbat
3
1
IUSS UME School Via Ferrata 45, Pavia, Italy
2
Soft Computing Group, Technical University of Catalonia, Jordi Girona Salgado 1-3, Barcelona, Spain
3
International Center for Numerical Methods in Engineering, Technical University of Catalonia, Jordi Girona Salgado
1-3, Barcelona, Spain
Keywords:
Fuzzy Sets, Risk Management, Natural Hazards, Vulnerability Index, Social Vulnerability, Seismic Vulnera-
bility, Inference System.
Abstract:
Hazard related Risk is a strange concept since its represents something that has not happened yet, something
which is blur and randomness related. Along its estimation, social vulnerability aspects come to arise. Such
aspects are even more difficult to define in part because there is still missing a robust way to quantify them
and, therefore, to establish a clear analytic framework useful to understand inherent complexities of a human
society. In this paper, we build a social aggravation coefficient fuzzy model considering Cardona-Carre
˜
no
aggravation descriptors. By reducing the number of aggravation descriptors and establishing fuzzy logic rules
between them, we found similar results in tendency and spatial distribution for seismic resilience and fragility
at Barcelona, Spain. We used a classical Mamdani fuzzy approach, supported by well established fuzzy theory,
which is characterized by a high expressive power and an intuitive human-like manner. We believe that in this
way, a more clear analyses of the resilience and fragility bond can be done exploiting in a more suitable way
fuzzy logic capabilities, because the inference process to obtain an aggravation coefficient is based precisely
on the establishment of rules (if-then type) directly over the involved variables in social vulnerability formation
which allows a smooth application of risk management knowledge, encouraging debate over the used rules,
besides the discussion among the employed membership functions.
1 INTRODUCTION
Social vulnerability is one of the key factors to as-
sembly risk in space and time, however, such impor-
tant element is largely ignored over ex-ante, ex-post
and cost/lost estimation reports, in part because the
measurement of social vulnerability is not quite un-
derstood, and in part because the presence of epis-
temology oriented-based discrepancies along vulner-
ability definition, which binds a particular method-
ology with the orientation where such definition has
been used, i.e. ecology, human, physical, etc. There-
fore, there is a concept discrepancy when a social vul-
nerability model is about to be built. Diverse models
have been used to obtain social vulnerability estima-
tions. For example Cutter et al. (2003) used a haz-
ard of-place model to examine the components of so-
cial vulnerability to natural hazards among US coun-
ties through the development of a vulnerability index
based on the reduction of variables by a factor analy-
sis plus an additive model. Kumpulainen (2006) us-
ing ESPON Hazards integrative model, created a vul-
nerability index map for all Europe regions based on
an aggregated model, considering that regional vul-
nerability is measured as a combination of damage
potential (anything concrete that can be damage) and
the coping capacity. The principal difference between
these models rely on one basic definition: while in
Cutter’s model the hazard potential is dependent on
risk and mitigation, in ESPON model risk is a com-
bination of the same hazard potential and the regional
vulnerability.
Carre
˜
no et al. (2012) proposed an seismic ag-
gravation risk model based on Cardona’s conceptual
framework of a risk model analysis for a city consid-
ering a holistic perspective, thus describing seismic
risk by means of indices (Cardona, 2001) and assess-
ing risk with the expression known as Mocho’s equa-
828
González R., Nebot À., Mugica F., Carreño M. and Barbat A..
A Holistic Seismic Risk Scheme Using Fuzzy Sets - Part One: The Social System Fragility.
DOI: 10.5220/0005129808280835
In Proceedings of the 4th International Conference on Simulation and Modeling Methodologies, Technologies and Applications (MSCCEC-2014), pages
828-835
ISBN: 978-989-758-038-3
Copyright
c
2014 SCITEPRESS (Science and Technology Publications, Lda.)

tion in the field of in the field of disaster risk indica-
tors. They propose that seismic risk is the result of
physical risk (those elements susceptible to be dam-
age or destroyed) and an aggravation coefficient that
includes both, the resilience and the fragility of a soci-
ety. Although the model was intended to be applied to
assess the risk over a city when it is strike by an earth-
quake, the structure of the social vulnerability module
of the model, (the one who deals with resilience and
fragility), can easily be transformed in a non-disaster
dependent analytic framework.
In this article, we propose a complete Mamdani
fuzzy aggravation model starting from the aggrava-
tion descriptors described in Carre
˜
no et al. (2012).
The aggravation model synthesizes the social aggra-
vation characteristics of a city struck by an earthquake
that could conduct to social vulnerability enhance-
ment or moderation. A main advantage of the pro-
posed model is its white box nature that results in a
high level understandability model. Moreover, the
fuzzy approximation used in this paper is well stab-
lished and with solid background.
2 PREVIOUS MODELS
Many times the strength of a vulnerability model be-
comes weakened not because the type or resolution
of the models themselves but because the lack of in-
formation and accurate data, in such a way that the
results achieved are misleading in many ways
1
. Fur-
thermore, the lack on understanding about how accu-
rately measure vulnerability is one of the major un-
certainty sources among social models. In most of
the cases, social vulnerability is described using the
individual characteristics of people (age, race, health,
income, type of dwelling unit, employment, gross do-
mestic product (GDP), income, etc.) Just in recent
time, vulnerability models started to include place in-
equalities, such as level of urbanization, growth rates
and economic vitality (Carre
˜
no et al., 2012).
Although there is a general consensus about some
of the major factors that influence social vulnerability,
disagreement arise in the selection of specific vari-
ables to represent these boarder concepts (Cutter et
al., 2003).
The proposed model by Cardona (2003) focus on
considering risk, as the possible economic, social and
environmental outcomes when a seismic might occur
over a period of time. Following a holistic approach,
1
Sometimes redirecting towards a definition staying that
vulnerability is a characteristic and not a condition, leading
towards the assumption that without damage, or a specific
hazard, vulnerability places could stand forever
Table 1: Descriptors used for aggravation estimation
(Carre
˜
no et al., 2012).
AGGRAVATION DESCRIPTORS
Marginal Slums
Population Density
Mortality Rate
Delinquency Rate
Social Disparity
Hospital Beds
Human Health Resources
Emergency and Rescue Personnel
Development Level
Emergency Operability
the model puts in practice a multidisciplinary view,
which considers not only the expected physical dam-
age among infrastructures and structures, numbers of
victims and economic losses, but also those condi-
tions related with social fragility and lack of resilience
that can enhance the generation of second order ef-
fects, due the earthquake. Therefore, the variables
needs to address towards specific indexes or indica-
tors related with physical vulnerability, the suscepti-
bility of exposed elements to be damage considering
potential seismic intensities over a period of time, and
the context vulnerability which is dependent of social
fragility and lack of resilience of urban systems with
the potential to be harm because a disaster. The de-
scriptors used by (Carre
˜
no et al., 2012) for aggrava-
tion estimation can be seen in the table 1.
2.1 Index Method
Carre
˜
no et al. (2012) obtained a seismic risk evalu-
ation for Barcelona city by means of indicators that
leads to the calculation of a total risk index. This is
obtained by direct application of Moncho’s equation
described in 1:
R
T
= P
R
(1 + F) (1)
where R
T
is the total risk, P
R
is the physical risk and
F is a aggravation coefficient.
Thus Carre
˜
no’s model considers that seismic risk
is produced for both: physical and an aggravation co-
efficient; this coefficient provides an approximate vi-
sion of the state of the social capital infrastructure.
The F coefficient depends on a weighted sum
of an aggravation factors set associated to socioe-
conomic fragility of the community (F
SFi
) and lack
of resilience of exposed context (F
LR j
), according to
equation 2.
F =
m
∑
i=1
w
SFi
F
SFi
+
n
∑
i=1
w
LR j
F
LR j
(2)
AHolisticSeismicRiskSchemeUsingFuzzySets-PartOne:TheSocialSystemFragility
829
where w
SFi
and w
LR j
are the assessed weights on each
factors calculated by an analytic hierarchy process
(Carre
˜
no et al., 2007; Saaty and Vargas, 1991), and m
and n the total number of descriptors, of fragility and
lack of resilience, respectively. The descriptors of the
socioeconomic fragility and lack of resilience of ex-
posed context where obtained from existent databases
and statistical data for the studied area.
One of the issues arising from Moncho’s equation
is the consideration that F can be up to much twice the
value of P
R
, which is not always accomplished, be-
cause some times the indirect effects are much larger
than the direct effects, leading a mislead in risk esti-
mation.
2.2 Carre
˜
no’s Fuzzy Method
Taking the objective of build a more flexible risk man-
agement tool when information is incomplete or is not
available, Carre
˜
no et al. proposed the use of fuzzy
logic tools and expert opinion to replace indexes by
fuzzy sets. The same descriptors are used and the se-
quences of calculations are similar to those made in
the caonventional index method, however the aggra-
vation’s descriptors values which were originally ob-
tained by demographic data bases are replaced by lo-
cal expert opinions. Using linguistic qualifiers, in-
stead of using numerical values, the aggravation value
can be evaluated. Distinct linguistic descriptors qual-
ifiers where proposed, which range in 5 levels of ag-
gravation description: very low, low, medium, high,
very high. Using local expert opinion, a membership
function was defined for each linguistic level used to
link the reported demographic or expert opinion value
to one level of aggravation.
With the positive link between a reported data and
its suitable linguistic level, the level is then grouped
into another set of membership functions, (based on
expert opinion or strictly arbitrary) which plays as
a homogenizer since it blends the original qualifier
level into a new single fuzzy set.
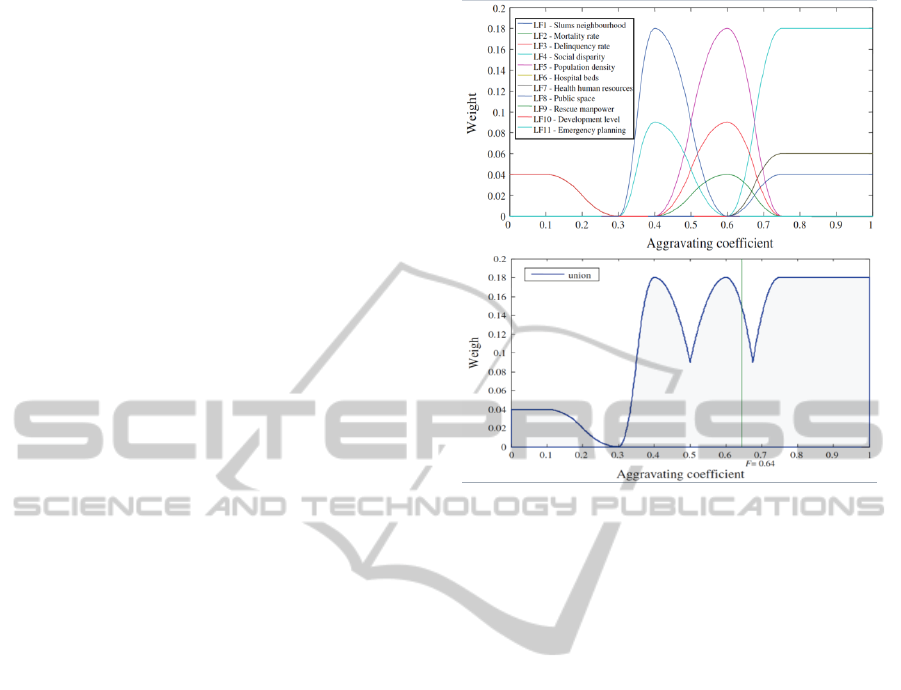
They calculated the fuzzy union between so-
cial fragility and lack of resilience descriptors,
µ
f
(x
SF
, x
LR
), and applied on each of these new mem-
bership functions, µ, the weights, w, corresponding to
the level of aggravation, L
F
, of each descriptor x
SFi
and x
LR j
, as defined in equation 3.
µ
f
(x
SF
, x
LR
) = max (w
SF1
µ
FL1
(L
F1
)...w
LR1I
µ
FLI
(L
F1
))
(3)
The proposed weighted and union methods be-
tween social fragility and lack of resilience descrip-
tors can be seen in Figure 1.
In the same way of index’s method, weights are
Figure 1: Carre
˜
no weighting (up) and union method (low)
for San Mart
´
ı District, Barcelona Spain (taken from Carre
˜
no
et al., 2012).
assigned to each fuzzy set by using an analytic hier-
archy process. The aggravation coefficient F is cal-
culated as the centroid abscise of the area beneath the
curve obtained with Equation 3.
We think that the Carre
˜
no’s fuzzy model presented
in this section is not entirely appropriate because it
is a non-conventional fuzzy approach, which may be
questionable due to the fact that fuzzy mathematical
raised in the inference process is not well established
and accurately validated.
3 CLASSICAL FUZZY METHOD
The model proposed in this research pretend to build
the same aggravation coefficient by re-defining their
variables into three different Fuzzy Inference Systems
(FIS), called: resilience, fragility and aggravation.
Each subsystem is defined by a set of rules directly
over the aggravation descriptors. A conceptualiza-
tion of the different steps along the proposed model
can be seen in Figure 2. The variables involved in
each subsystem are presented in the left hand side of
Figure 2. FIS #1, corresponds to the Fragility model
and has as input variables the Marginal Slums (MS),
the Social Disparity Index (SDI) and the Population
Density (PD). The output of FIS #1 is the level of
Fragility. On the other hand, FIS #2 corresponds to
the Resilience model and has as input variables the
SIMULTECH2014-4thInternationalConferenceonSimulationandModelingMethodologies,Technologiesand
Applications
830
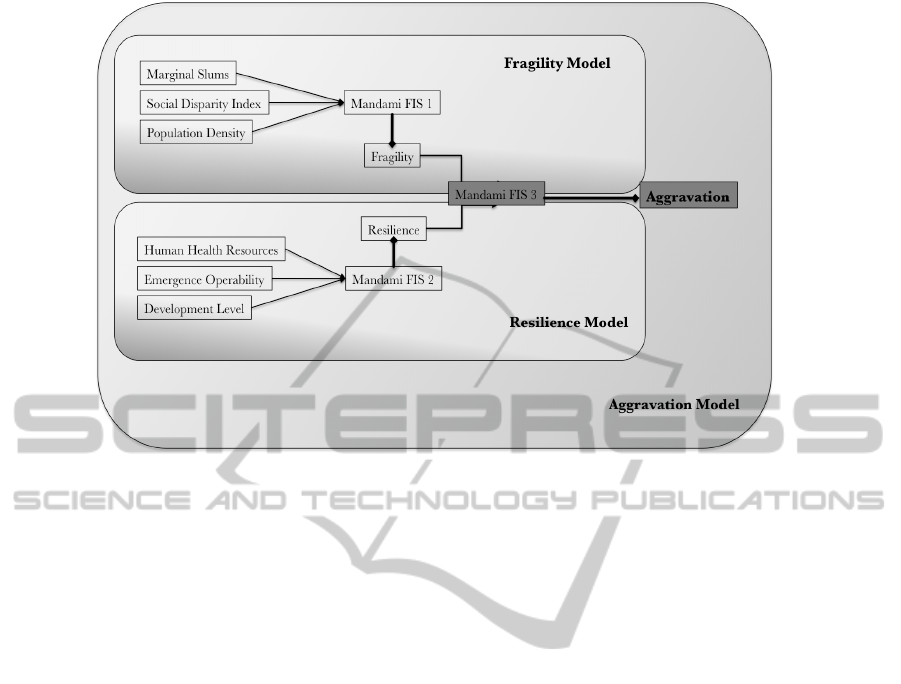
Figure 2: Conceptualization of Fuzzy Classical Model to estimate Aggravation Coefficient.
Human Health Resources (HHR), the Emergency Op-
erability (EO) and the Development Level (DL). The
output of FIS #2 is the Resilience level. The Aggra-
vation model (FIS #3) takes as inputs the fragility
and resilience levels that are the output of FIS #1
and #2, respectively, and infers the aggravation co-
efficient. All the fuzzy inference systems proposed
in this research are based on the Mamdani approach
(Mamdani and Assilian, 1975), since it is the one that
better represents the uncertainty associated to the in-
puts (antecedents) and the outputs (consequents) and
allows to describe the expertise in an intuitive and
human-like manner. Our main objective is to develop
a fuzzy aggravation model as much interpretable as
possible and with high expressive power. In our ap-
proach the original ten variables presented in Table 1
are reduced to six variables. Population density, Slum
area or marginal slums, Human health resources and
Development level remain the same, and Social dis-
parity index and Emergence operability are redefined
in such a way that subsume the other variables. The
reduction or simplification of the original variables
was made by taking advantage of certain descriptors
that are linked and could englobe various descriptors
in one single class considering its social nature, for
example: the descriptors called: mortality rate and
delinquency rate, are related between them and are
reflecting social consequences produced by a social
structure failure (could be lack of access) to certain
social advantages, such as having an efficient public
health program, or no marginalization dynamics, or
access to education and effective justice and law poli-
cies. Therefore we consider these descriptors could
be enclosed within the descriptor called social dispar-
ity index, which is a fragility descriptor as well. In
the case of resilience descriptor we merge descriptors
called: Public Space, Hospital beds, and Emergency
Personnel, into the descriptor called Emergence Op-
erability, because the former descriptors acts when
the emergency is being or has recently occurred, and
therefore are related with the capacity of the city to
face an emergence situation, and the assets that a city
has to confront it. We modify fuzzy classes by reduc-
ing the number of linguistic levels defined for each
descriptor up to 3 (low, medium, high) along their re-
spective universe of discourse, but we kept the same
five levels for the final output (resilience, fragility
and aggravation). We think that 3 classes is enough
to represent accurately the input variables of the re-
silience and fragility models. Moreover, a reduction
of the number of classes implies also a more com-
pacted and reduced set of fuzzy rules. In the same
way, to improve model’s sensibility, we adjust mem-
bership functions forcing them to be more data-based
kind of type, thus considering the reported aggrava-
tion data as embedded along membership functions
limits definition. With these new membership func-
tions we build a set of fuzzy logic rules that could in-
fer the behaviour of the aggravation coefficient com-
ponents using the three Mamdani Fuzzy Inferences
Systems mentioned before (see Figure 2).
The developing of the fuzzy rules was established
for consider all possible combinations between the
input descriptor’s linguistic levels, giving a total of
AHolisticSeismicRiskSchemeUsingFuzzySets-PartOne:TheSocialSystemFragility
831

Table 2: Logic Rules used for resilience estimation.
HHR=Human Health Resources, DL= Development Level,
EO=Emergency Operability, R = Resilience, VH = Very
High, H = High, M = Medium, L= low, VL = Very Low
1.
If (HHR is L) and (DL is L) and (EO is L) then (R is VL)
2. If (HHR is M) and (DL is M) and (EO is M) then (R is M)
3. If (HHR is H) and (DL is H) and (EO is H) then (R is VH)
4. If (HHR is M) and (DL is L) and (EO is L) then (R is L)
5. If (HHR is H) and (DL is H) and (EO is L) then (R is M)
6. If (HHR is L) and (DL is M) and (EO is L) then (R is L)
7. If (HHR is M) and (DL is M) and (EO is L) then (R is M)
8. If (HHR is H) and (DL is M) and (EO is L) then (R is H)
9. If (HHR is L) and (DL is H) and (EO is L) then (R is M)
10. If (HHR is M) and (DL is H) and (EO is L) then (R is M)
11. If (HHR is H) and (DL is H) and (EO is L) then (R is H)
12. If (HHR is L) and (DL is L) and (EO is M) then (R is L)
13. If (HHR is M) and (DL is L) and (EO is M) then (R is M)
14. If (HHR is H) and (DL is L) and (EO is M) then (R is H)
15. If (HHR is L) and (DL is M) and (EO is M) then (R is M)
16. If (HHR is H) and (DL is M) and (EO is M) then (R is H)
17. If (HHR is L) and (DL is H) and (EO is M) then (R is M)
18. If (HHR is M) and (DL is H) and (EO is M) then (R is H)
19. If (HHR is H) and (DL is H) and (EO is M) then (R is H)
20. If (HHR is L) and (DL is L) and (EO is H) then (R is M)
21. If (HHR is M) and (DL is L) and (EO is H) then (R is H)
22. If (HHR is H) and (DL is L) and (EO is L) then (R is H)
23. If (HHR is L) and (DL is M) and (EO is H) then (R is H)
24. If (HHR is M) and (DL is M) and (EO is H) then (R is VH)
25. If (HHR is H) and (DL is M) and (EO is H) then ((R is VH)
26. If (HHR is L) and (DL is H) and (EO is H) then (R is H)
27. If (HHR is M) and (DL is H) and (EO is H) then (R is VH)
27 rules for calculating fragility and resilience val-
ues respectively. The rules were intended to follow
risk management literature which could suggest pos-
sible outcomes when three of these elements interact
to form resilience or fragility. The Mamdani aggrava-
tion model, that has as input variables the resilience
and the fragility, discretized into 5 classes each, is
composed of 25 fuzzy rules. In Table 2 the rules of the
Mamdani resilience model are presented as an exam-
ple. As mentioned before, the use of classical fuzzy
systems, with well established fuzzy inference theory,
allow a high level understandability model, easily un-
derstandable by experts which leads towards a deepest
discussion in the topic of social vulnerability descrip-
tion and casual interrelation.
Let’s describe the inference process by follow-
ing the example of the proposed Resilience FIS. The
fuzzy inference engine combines the fuzzy if-then
rules (see Table 2) into a mapping from fuzzy sets
in the input space U ⊂ R
n
to fuzzy sets in the output
space V ⊂ R, based on fuzzy logic principles.
Let’s U = U
1
x U
2
x U
3
⊂ R
n
and V ⊂ R, where
U
1
, U
2
and U
3
represents the universes of discurse of
Marginal Slums, Social Disparity Index and Popula-
tion Density input variables, respectively, and V the
universe of discourse of Resilience. In hour case each
input variable contains three fuzzy sets and the output
variable is discretized into five fuzzy sets. Then, the
fuzzy rule based shown in Table 2 can be expresed in
a canonical form as shown in Equation 4.
R
(l)
: IFx
1
isA
l
1
and...andx
n
isA
l
n
T HENyisB
l
(4)
where A
l
1
and B
l
are fuzzy sets in U
i
and V , respec-
tively, x = (x
1
, x
2
, x
3
) ∈ U are Marginal Slums, So-
cial Disparity Index and Population Density linguistic
variables, y ∈ V is the Resilience linguistic variable
and l = 1, 2, ..., 27 is the rule number. Consider now
the fuzzy facts: x
1
is A
0
1
, x
2
is A
0
2
, x
3
is A
0
3
, being A
0
1
, A
0
2
and A
0
3
fuzzy sets.
The Generalized Modus Ponens allows the deduc-
tion of the fuzzy fact y is B
0
by using the compo-
sitional rule of inference (CRI), defined trough the
fuzzy relation between x and y, as defined in Equa-
tion 5.
B
0
= A
0
◦ R (5)
where A
0
= (A
0
1
, A
0
2
, A
0
3
). The simplest expression of
the compositional rule of inference can be written as
Equation 6.
µ
B
0i
(y) = I (µ
A
i
(x
0
), µ
B
i
(y)) (6)
when applied to the ith-rule; where:
µ
A
i
(x
o
) = T
µ
A
i
1
(x
1
), µ
A
i
2
(x
2
), µ
A
i
3
(x
3
)
where x
0
= (x
1
, x
2
, x
3
). Here, T is a fuzzy conjuctive
operator and I is a fuzzy implicator operator.
Once the inference is perfromed by means of the
compositional rule of inference scheme, the resulting
individual (one for each rule) output fuzzy sets are
aggregated into an overall fuzzy set by means of a
fuzzy aggregation operator and then a defuzzification
method is employed to transform the fuzzy set into a
crisp output value, i.e. the resilience level following
the example. The defuzzification method used in this
work is the Centre Of Gravity (COG), which slices
the overall fuzzy set obtained in the inference process
into two equal masses. The centre of gravity can be
expressed as Equation 7.
COG =
R
b
a
xµ
B
(x)dx
R
b
a
µ
B
(x)dx
(7)
where B is fuzzy set on the interval [a, b].
In this research, this Mamdani fuzzy inference
process is used for both descriptors, i.e. fragility and
resilience. Once the evaluation has been made for
both descriptors, it’s possible to calculate the aggra-
vation coefficient using the Aggravation fuzzy infer-
ence system (see Figure 2). The antecedents in this
case are the resilience and fragility descriptors and the
SIMULTECH2014-4thInternationalConferenceonSimulationandModelingMethodologies,Technologiesand
Applications
832
consequent is the aggravation coefficient. The crisp
value for the aggravation coefficient was obtained also
trough the calculation of COG. For comparison pur-
poses and following Carre
˜
no’s fuzzy previous work,
the obtained aggravation value is then used to evalu-
ate aggravation’s linguistic level, in order to perform
a graphical representation of the levels of aggravation
in each district, as presented in the next section.
In absence of a defensible method for assigning
weights for social vulnerability estimators (Cutter,
2003), and contrarily to Carre
˜
no’s fuzzy approach, we
did not made any a priori assumption about the im-
portance of each factor in the overall behaviour of the
system. In this way, each factor was viewed as having
an equal contribution to the fragility or resilience con-
figuration. In this way it becomes possible to study
the importance of the weights assigned in previous
works when evaluating an aggravation coefficient.
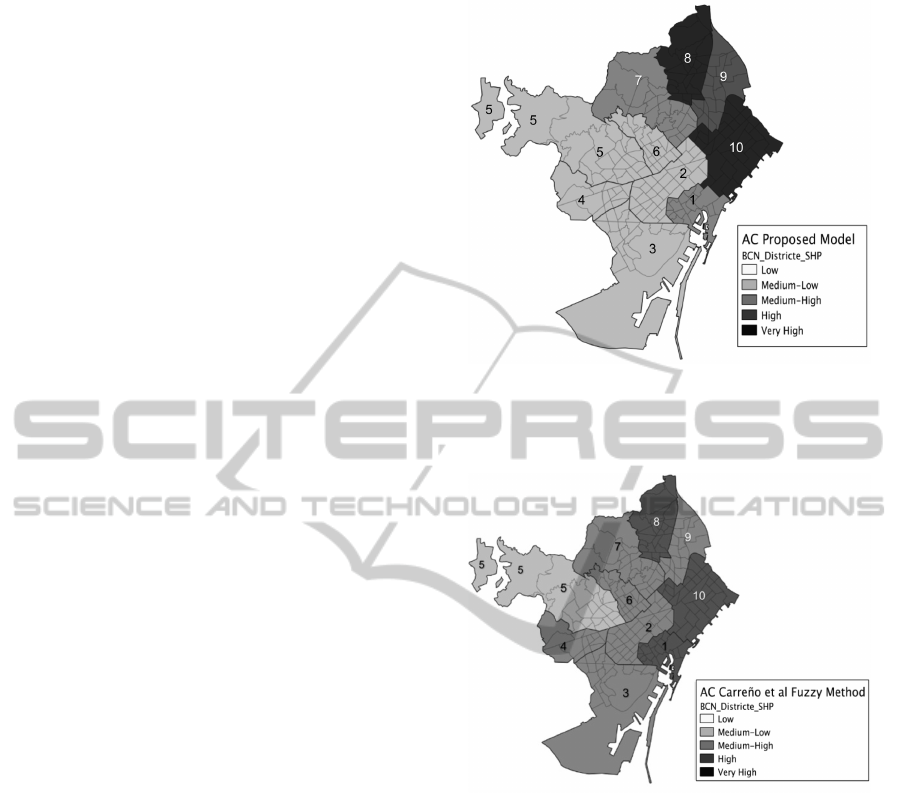
4 RESULTS AND COMPARISON
Figure 3 shows the estimated spatial distribution of
the aggravation coefficient and its correspondent level
for the 10 administrative districts, of the city of
Barcelona, achieved through the proposed model.
Figures 4 and 5 show the aggravation coefficient cal-
culated by Carre
˜
no et al. using fuzzy sets or index
methods, respectively.
The proposed model, equal than the two alterna-
tive methods, estimates that highest aggravation is
spread mostly over the northeast part of the city. In
our model, levels of very high are reached over Sant
Mart
´
ı and Nou Barris district, high for San Andreu,
medium-high values for Horta-Guinard
´
o and Ciutat
Vella, while the rest of the city presents values of
medium-low aggravation level.
As we can see in Figure 4, Carre
˜
no’s fuzzy method
considers that most of the city aggravation coefficient
ranges between medium-low and medium-high levels,
while index method and our proposed method resem-
ble similar value levels (medium-low) thus not over-
estimating aggravation.
Figures 6, 7 and 8 show the aggravation coeffi-
cient numerical value obtained by the proposed fuzzy
model, the index model and Carre
˜
no’s fuzzy model,
respectively. Districts are ordered from lower to high-
est aggravation level. In these figures we can see that
even there is no correct total match among the three
methods, all of them preserve quite the same order in
terms on higher and lower aggravation levels. When
comparing the numerical aggravation value obtained
from both fuzzy models (Carre
˜
no’s fuzzy model and
the proposed model) to a robust method like index
Figure 3: Aggravation Coefficient. Proposed Model: (1)
Ciutat Vella, (2) Eixample, (3) Sants-Montjuic, (4) Les
Corts, (5) Sarri
`
a-Sant Gervasi, (6) Gr
`
acia, (7) Horta-
Guinard
´
o, (8) Nou Barris, (9) Sant Andreu, (10) Sant Mart
´
ı.
Figure 4: Aggravation Coefficient. Carre
˜
no et al fuzzy
method: (1) Ciutat Vella, (2) Eixample, (3) Sants-Montjuic,
(4) Les Corts, (5) Sarri
`
a-Sant Gervasi, (6) Gr
`
acia, (7) Horta-
Guinard
´
o, (8) Nou Barris, (9) Sant Andreu, (10) Sant Mart
´
ı.
models (Marulanda et al., 2009), both suffer a slight
under and overestimation of the aggravation values by
district. In the proposed method this issue could be
addressed with the inclusion of weights to each de-
scriptor, as the other methods do. Nevertheless, we
consider that even with these small numerical dissim-
ilarities, the proposed fuzzy model limits the differ-
ent aggravation levels in a suitable way, allowing the
identification of more potentially problematic zones
with a good resolution and reduced computation time.
Figure 9 shows the same as Figures 6, 7 and 8 but
without ordering the districts by aggravation value,
showing how the aggravation values behaves along
the different districts. As it can bee seen, even if the
explicit aggravation coefficient value is not the same
AHolisticSeismicRiskSchemeUsingFuzzySets-PartOne:TheSocialSystemFragility
833
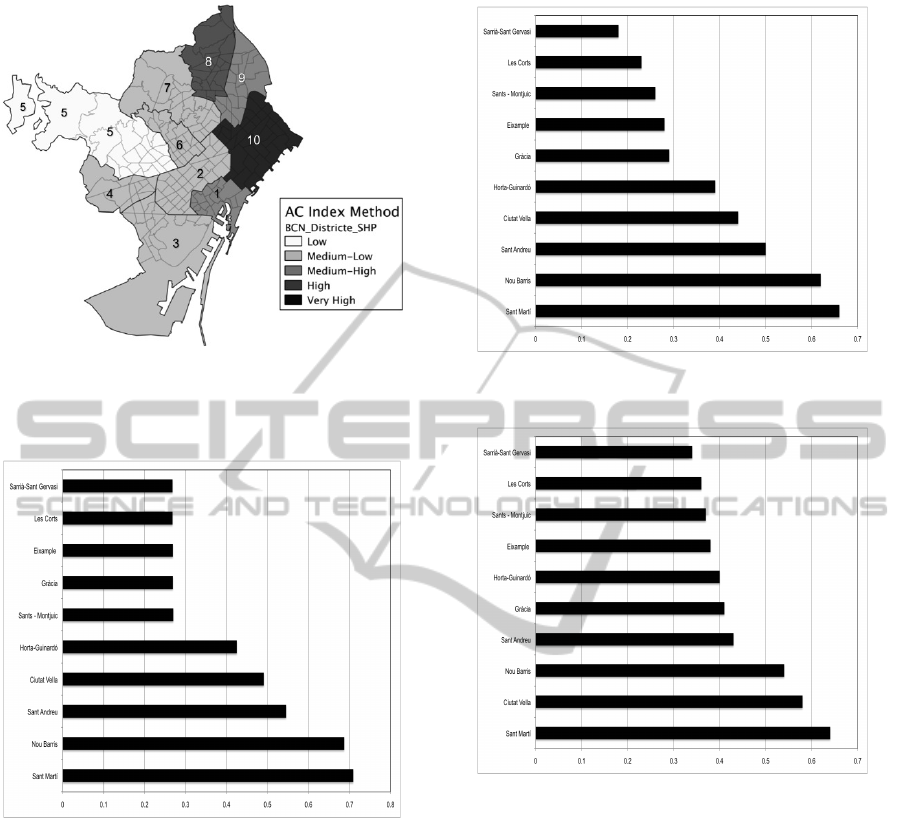
Figure 5: Aggravation Coefficient. Index Method: (1) Ciu-
tat Vella, (2) Eixample, (3) Sants-Montjuic, (4) Les Corts,
(5) Sarri
`
a-Sant Gervasi, (6) Gr
`
acia, (7) Horta-Guinard
´
o, (8)
Nou Barris, (9) Sant Andreu, (10) Sant Mart
´
ı.
Figure 6: Aggravation Coefficient values by district, Pro-
posed Fuzzy Model.
for each district, a similar trend shape come to appears
(with the inherent over and underestimation aggrava-
tion level), which leads to the conclusion that the gen-
eral behaviour of the proposed model is coherent with
the other two mentioned models.
4.1 Discussion
According to the previous analysis, with the use of
classical fuzzy inference system methodology it is
plausible to reproduce the results obtained from a
more analytical method such as indexes, for exam-
ple: in terms of district aggravation classification, or
in reproducing similar spatial pattern of aggravation.
In first term, the proposed inference model allows a
useful simplification for the large quantity of vari-
Figure 7: Aggravation Coefficient values by district, Index
Model.
Figure 8: Aggravation Coefficient values by district,
Carre
˜
no’s Fuzzy Model.
ables required for social aggravation analysis, in the
spirit of reduce the subjectivity associated with ag-
gravation descriptors suitability designation by using
a more flexible and small descriptors set in which
the underlying links between them can be more eas-
ily observed, enabling a more understandable anal-
ysis scheme for social aggravation inference estima-
tion. Building rules directly over the aggravation de-
scriptors allows to assemble a compositional rule of
inference over the very same descriptors that are as-
sumed to create aggravation itself, therefore the infer-
ence process can be made using rules designed to fol-
low risk management knowledge, allowing the model
to represent, with a certain degree of freedom, the ac-
tual understanding of aggravation formation, and at
the same time, it allows a real discussion of the rule’s
structure strength; which can be absolutely improved
with a deepest debate.
SIMULTECH2014-4thInternationalConferenceonSimulationandModelingMethodologies,Technologiesand
Applications
834

Figure 9: Aggravation coefficient comparison over the 10
Barcelona Districts.
Fuzzy logic inference capabilities can be exploited
in a more suitable way because the outputs from each
FIS used in the model are always fuzzy sets, giving
the chance to connect them trough a new FIS without
loosing consistency, allowing model completeness.
At the other hand, the proposed model slightly
over and underestimated aggravation values for some
districts when comparing with index model, as it is
also de case of Carren
˜
o’s fuzzy model. However, if
necessary, the proposed fuzzy model can be further
tuned if descriptors are weighted.
4.2 Future Work
The flexibility of the model enables its adaptation to
several conditions which could be used in more gen-
eral studies of social vulnerability and that can also
help to fill some gaps among analytic methods. For
example, the same procedure can be applied to a more
general social vulnerability model that considers not
only physical, and aggravation inputs, but environ-
mental, economic and even completely subjective de-
scriptors can be add as well, such as solidarity or
brotherhood
2
. All of these can then be embedded into
one single inference model. One of the main prob-
lems of risk ex-ante and ex-post models is that they
don’t necessarily consider the interconnectivity of so-
cial characters (sectors) in a real scenario, for exam-
ple, the lack of hospitals in one geographic area does
not necessarily mean that human health resources is
zero at that place. It will be like assuming that the
fire department can only help those who are in close
proximity. Assuming interconnectivity, the potential
damage to the social network-connections in case of
2
Loosing in this way its event-base model characteriza-
tion.
disaster is the real issue that must be addressed, and
we consider it plausible to be approach using fuzzy
methods.
5 CONCLUSIONS
We obtain a inference fuzzy model to make an esti-
mation of social aggravation over Barcelona city us-
ing the descriptors proposed in (Carre
˜
no et al., 2012).
Building inference compositional rules over the se-
lected descriptors, we were able to obtain a robust
method that resembles the identification of relevant
aspects and characteristics of seismic risk of cities al-
ready achieved by two other consolidated methods.
The proposed model displays more simplicity, flex-
ibility and resolution capacities and can be rapidly
transformed into a non-disaster event model type with
the inclusion of new type of variables, englobing a
more detailed social vulnerability scheme and inter-
connectivity issues.
REFERENCES
Cutter, S. L., Boruff, B. J., Shirley, W. L., (2003) Social
Vulnerability to Environmental Hazards. Social Sci-
ence Quarterly,84.
Cardona, O. D., (2001), Holistic evaluation of the seis-
mic risk using complex dynamic systems (in Span-
ish), PhD Thesis Technical University of Catalonia,
Barcelona, Spain.
Cardona, O. D., (2003), The need for rethinking the con-
cepts of Vulnerability and Risk from an Hollistic Per-
spective: a necessary review a criticism for effective
Risk Management, Mapping Vulnerability: Disasters,
Developing and People Chapter 3 Earthscan Publish-
ers, London.
Carre
˜
no, M. L., Cardona, O. D., Barbat, A. H., (2007), Dis-
aster risk management performance index, Nat Haz-
ards 40 1-20.
Carre
˜
no, M. L., Cardona, O. D., Barbat, A. H., (2012) New
methodology for urban seismic risk assessment from
a holistic perspective Bull Earthquake Eng, 10, 547-
565.
Mamdani, E. H., Assilian, S., (1975) An experiment in lin-
guistic synthesis with a fuzzy logic controller. Intern.
J. of Man-Machine Studies,7(1), 1-13.
Marulanda, M. C., Cardona, O. D., Barbat, A. H., (2009)
Robustness of the holistic seismic risk evaluation in
urban centers using the USRi, Nat Hazards, 49, 501-
516.
Kumpulainen, K., (2006) Vulnerability Concepts in Hazard
and Risk Assessment Geological Survey of Findand,
42, 65-74.
Saaty, T. L., Vargas, L. G., (1991) Prediction, projection,
and forecasting: applications of the analytical hier-
archy process in economics, finance, politics, games,
and sports, Kluwer Academic Publishers
AHolisticSeismicRiskSchemeUsingFuzzySets-PartOne:TheSocialSystemFragility
835
