
Monitoring of the Functional State of Athletes by Pupillometry
N. N. Varchenko
1
, K. A. Gankin
1
and I. A. Matveev
2,3
1
Sambon Precision and Electronics Co.,LTD, B. Tatarskaya str., 21, Moscow, Russia
2
Computing Centre of Russian Academy of Sciences, Vavilov str., 40, Moscow, Russia
3
Iritech Inc. RnD Center, B.Tatarskaya str., 21, Moscow, Russia
Keywords:
Pupil Reaction, Functional State Evaluation, Binocular Pupillometry.
Abstract:
Method of binocular pupillometry is presented with an application to evaluation of the functional state of ath-
letes. The method is based on synchronous registration of both pupil reactions to a light flash stimulus. Pupil
reaction reflects the state of sympathetic-parasympathetic balance of autonomic nervous system and serves as
an objective measurement of the body condition. The advantages of the method are: non-invasiveness, quick
operation, wide spectrum of measured characteristics, and the fact that pupil reaction to light flash stimulus
is an unconditioned reflex and is not controlled by the cortex and consciousness. Results of the experiments
performed with various groups of athletes are presented. A possibility of using the pupillometry for evaluating
athletes’ state is shown. Comparison with traditional methods of functional state evaluation is done.
1 INTRODUCTION
Nowadays trainers, physicians, rehabilitation doctors
who are involved in sports of high achievements face
increasing negativeeffectsof sport to the human body.
Quite frequently this is connected with lack of infor-
mation on functional state of the athletes in the right
time. That is why it is necessary to enhance the meth-
ods of survey, diagnosis, and control in order to notice
deviations of health condition in time and to prevent
unwanted outcomes of training and competition loads
as well as to correct training process. One of actual
problems of modern sport medicine is development
of new methods of examination, allowing more com-
plete and reliable evaluation of the functional state of
an athlete.
One of such methods is pupillometry that is mea-
suring pupil response to a stimulus, typically light
flash. Possibility to use pupil as an objective crite-
rion for estimating the condition of autonomic ner-
vous system and various connected characteristics
was persuasively proven by the works (Velhover
and Ananin, 1991; Apter, 1956; Shahnovich, 1964;
Smirnov, 1953). Pupillometry is especially attractive
since pupil reaction is unconditioned reflex, which
is not driven by cortex and thus is not controlled by
mind (Velhover and Ananin, 1991; Andreassi, 2000).
At the same time it is sensitive indicator of wide
spectrum of physiological processes connected with
sympathetic-parasympathetic balance.
Despite the seeming simplicity, registration and
processing of pupil reaction poses several difficul-
ties due to its quickness and relatively small size of
an object to be measured. Pupillometry as a clini-
cal medicine method dates back more than 100 years:
in the end of 19-th century Du Bois-Reymond and
P. Garten made attempts to photograph the pupil for
diagnostic purposes. However necessity of speedy
recording and processing of vast data amount delayed
the development of the method. First versions of
pupillometer devices also faced problems connected
with bright background illumination necessary for
capturing the film, which causes strong constriction
of the pupil. Due to modern means of image registra-
tion and processing these problems are now solved.
Recent development of informational technology al-
lowed to construct the systems, which register pupil
image stream with high speed and process it in real
time precisely and reliably. Basic informative fea-
ture of modern pupillometry systems is pupillogram,
which is a graph of pupil size during its reaction.
This paper presents a method of binocular pupil-
lometry in its application to athlete functional state
evaluation. Following section describes some pecu-
liarities of the method. In the third chapter results of
experiments are presented. The tests were performed
210
N. Varchenko N., A. Gankin K. and A. Matveev I..
Monitoring of the Functional State of Athletes by Pupillometry.
DOI: 10.5220/0005132102100215
In Proceedings of the 2nd International Congress on Sports Sciences Research and Technology Support (icSPORTS-2014), pages 210-215
ISBN: 978-989-758-057-4
Copyright
c
2014 SCITEPRESS (Science and Technology Publications, Lda.)
on several groups of athletes before and after training
loads. Abilities of pupillometry in the evaluation of
their conditions are shown. The presented method is
compared with standard ones used for this purpose.
2 BINOCULAR PUPILLOMETRY
METHOD
Method of pupil reflex registration and processing is
implemented by HW/SW complex. Images of right
and left eyes are registered simultaneously and syn-
chronously during 2.5 seconds. Light flash stimu-
lus is outputted after 200ms after start of registra-
tion. Light intensity of 145lux was used in examina-
tions described herein. Images are registered by two
CCD/NTSC cameras with interlacing. Frame rate is
60 frames per second, thus 150 pairs of frames are
captured in one registration session. Frame period is
1/60 = 16.67ms. Image resolution is 640 ∗ 480 pix-
els, grayscale 8 bit. Infrared illumination with wave-
lengths of 880nm and 940nm is used. Frame scan and
light flash output are synchronized. Examination in-
cludes registration of three series split by 1-minute
pauses for pupil recovery. Thus total duration of ex-
amination does not exceed three minutes. Apart from
images age of testee is input since normal behaviour
of pupil depends on the age of person.
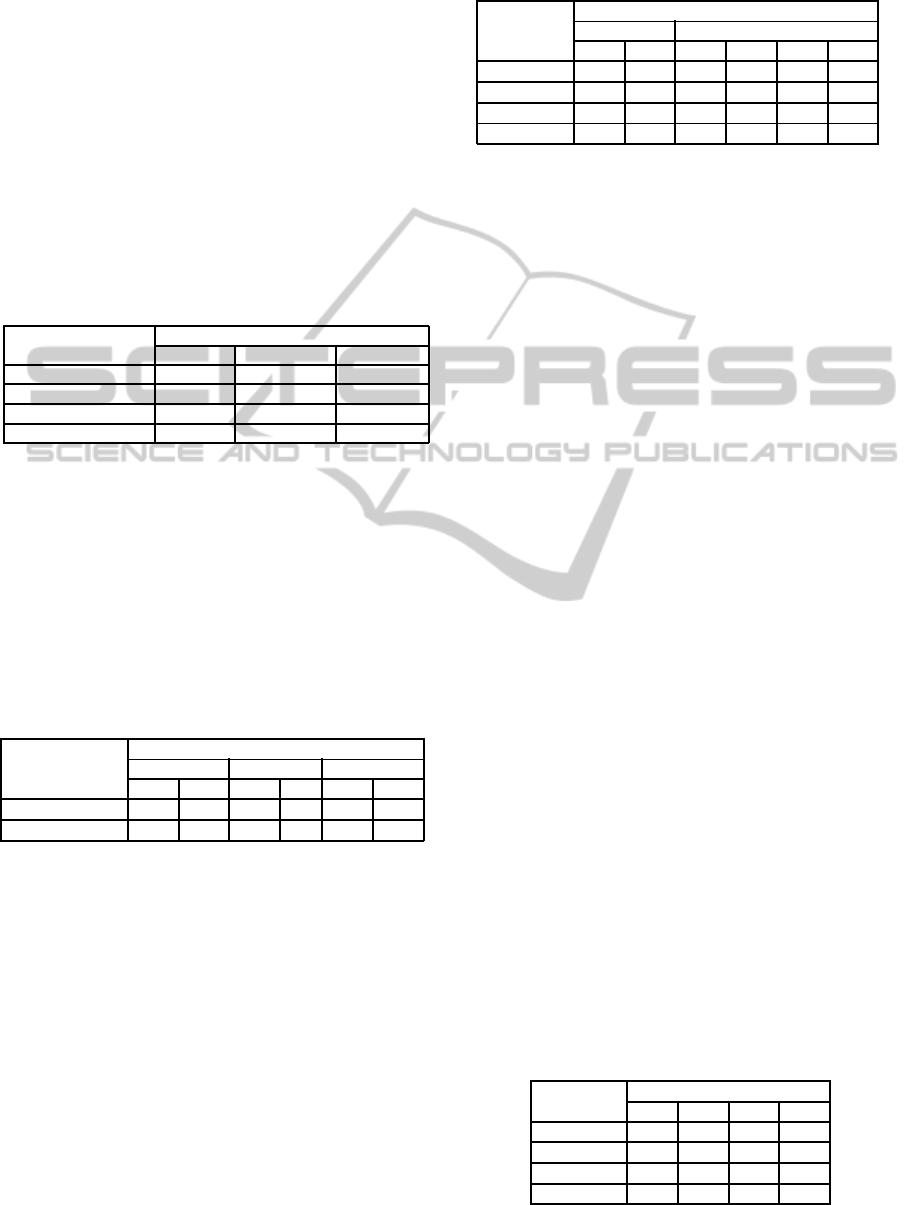
Figure 1 shows a sample of eye images obtained
in pupillometry examination. Images with maximum
pupil size (before flash) and in the moment of maxi-
mum pupil constriction are presented.
Figure 1: Sample of pupil reaction. (a) — first image in se-
quence, original pupil size; (b) — 55-th (from 150) image,
minimal pupil size.
Pupillogram is determined as a ratio of pupil and
iris sizes, dependent on time, expressed in percent:
R(t) =
r
pupil
(t)
r
iris
(t)
100% , (1)
where r
pupil
(t) and r
iris
(t) are measured radii or pupil
and iris in the moment t. One should note that it is
necessary to measure iris radius in all frames of the
sequence since the testee can move and scale of image
may change. Radii of pupil and iris are determined in
frames by the iris segmentation algorithms (Gankin
et al., 2014) that give higher precision compared to
photometric methods (Shahnovich, 1964) and sub-
stantially higher speed compared to manual process-
ing (Velhover and Ananin, 1991), which were used
earlier.
First phase of pupillogram reflects the state of
pupil sphincter innervated by parasympathetic ner-
vous system. Second phase reveals the state of pupil
dilator innervated by sympathetic nervous system.
Hence pupillogram characterizes interaction of these
two compounds of autonomic nervous system and
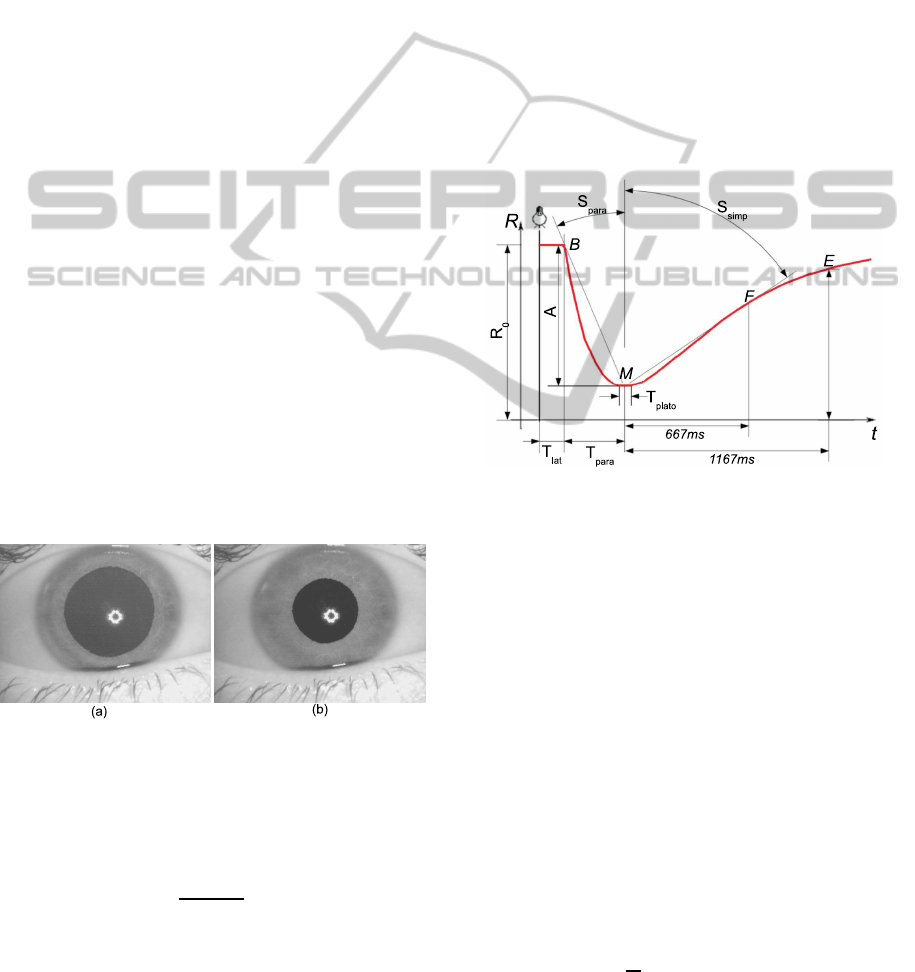
gives an opportunity to judge about them. Figure 2
represents the typical appearance of the pupillogram.
Abscissa axis uses time in milliseconds, ordinate axis
gives relative pupil radius (1).
Figure 2: Scheme of the pupillogram and some of its pa-
rameters.
From mathematical point of view pupillogram is
a series of 150 numbers: {r(t)}
150
t=1
each belonging to
an interval from 10 to 80 (minimal and maximal pos-
sible relative pupil radius). Using time series analysis
methods (Hamilton, 1994) the following characteris-
tic points are located in pupillogram: B — moment of
reaction start; M — middle of the plateau, which is
a flat segment of minimum pupillogram values; F —
control point lying in a distance of 667ms from M;
E — control point lying in a distance of 1167ms from
M. Various parameters describing person’s functional
state can be extracted from pupillogram. We present
nine of them, which are used for functional state mon-
itoring and easily interpretable.
1. R
0
— original relative pupil size, measured in
percent. It is calculated as an average relative radius
in several beginning frames:
R
0
=
1
T
T
∑
t=0
R(t) , T ≈ 5 . (2)
2. T
lat
— duration of latent period of pupil con-
MonitoringoftheFunctionalStateofAthletesbyPupillometry
211

striction, i.e. time elapsed from light flash till the start
of pupil reaction. It is measured in milliseconds. This
parameter is numerically equal tot coordinate of point
B: T
lat
= t(B). It characterizes the agility of nervous
processes.
3. T
para
— duration of parasympathetic phase of
pupil reaction i.e. time passed from start of pupil re-
action to the middle of plateau. T
para
= t(M) −t(B).
4. S
para
— criterion of pupil constriction activ-
ity, which is an angle between the BM segment and
ordinate axis.
5. A — reaction amplitude, measured as a con-
striction of pupil relative to iris radius:
A =
r
pupil
(B) − r
pupil
(M)
r
iris
(0)
, (3)
where r
pupil
(B) and r
pupil
(M) are absolute pupil sizes
in B and M points.
6. C
max
— maximum speed of pupil constriction,
expressed in percent per millisecond.
C
max
= max
t∈[B
t
;M
t
]
−
dR(t)
dt
. (4)
Values of T
para
, S
para
, A, C
max
characterize strength
and stability of nervous and muscular excitations.
7. T
plato
— duration of latent period of recovery,
time from stopping constriction till starting dilation.
This is the width of the plateau. This value as well
as T
lat
characterizes agility of nervous processes, i.e.
speed of switching between excitation and inhibition.
For sportive achievements it is optimal to have this
parameter in minimum of normal range.
8. S
simp
— criterion of activity of pupil recovery,
which is an angle between FM segment and ordinate
axis.
9. V — ratio of pupil sizes after certain period of
recovery (control point E). It characterizes recovery
abilities of the body. It is expressed in percent:
V =
R(E)
R
0
100% , (5)
If this parameter falls below 50%, chronic fatigue
syndrome may take place (Ananin, 1982). With ath-
letes it means over-training.
Average, minimal and maximal values are deter-
mined for each parameter statistically. These values
vary according to age of the testee. Parameters are
normalized so as to fit in range [−100%;+100%]:
˜
P =
P− P
norm
P
norm
− P
min
100%, P 6 P
norm
,
P− P
norm
P
max
− P
norm
100%, P > P
norm
,
(6)
where P
norm
, P
min
, P
max
are average, minimal and
maximal norms of P. By this normalization param-
eters become dimensionless and their substantial de-
pendence from age is eliminated.
Synchronous binocular pupillometry obtains two
pupil reactions and hence gives an opportunity to re-
veal and examine bilateral asymmetry of nervous sys-
tem, particularly hemisphere asymmetry. One of ba-
sic asymmetry manifestations is anisocoria i.e. rela-
tive difference in radii of two pupils, defined here as:
An = 2
˜
R
(D)
0
−
˜
R
(S)
0
|
˜
R
(D)
0
| + |
˜
R
(S)
0
|
, (7)
where
˜
R
(D)
0
and
˜
R
(S)
0
are normalized parameter R
0
(2)
for right and left eyes respectively. Due to limita-
tions of iris segmentation methods precision of aniso-
coria value is 2%. Thus hemisphere asymmetry is
detected if An /∈ [−0.02;0.02]. For athletes presence
of hemisphere asymmetry first of all means possible
mismatch in coordination.
3 COMPARISON WITH OTHER
METHODS
Pupillometry abilities were verified in comparative
tests with standard methods. 30 professional volley-
ball players were tested. Age of the athletes ranges
22-24 years, sport experience is 5-6 years. Con-
trol group was formed from 30 healthy men of same
age, not athletes. Tests were performed in natu-
ral conditions, i.e. in the sports hall. Pupillogram
was registered in rest (before the load) and after the
load (training or competition). Complex estimation
of functional condition of the testees was done in-
cluding studies of cardiovascular, somatic and auto-
nomic nervous systems, operability, emotional and
volitional qualities. Cardiovascular system was eval-
uated by conventional sports medicine methods: heart
rate (HR), blood pressure (BP) and electrocardiogram
(ECG) (Dolmatova et al., 2001). Operability was
determined by a common European test PWC-170.
Maximal oxygen consumption (MOC) calculated by
the method (Karpman et al., 1988). State of condi-
tioned reflex activity was determined by the latent pe-
riod of the motor response (visual-motor test). Senso-
rimotor coordination (tremor of hands, strength and
endurance of individual muscle groups hands) was
determined by labyrinth tremor-meter as the number
of errors made in 30 seconds. Emotional and voli-
tional qualities and status of major organs and sys-
tems were determined by electro-puncture reflex di-
agnosis (Nacatani and Yarnashita, 1985). The ath-
icSPORTS2014-InternationalCongressonSportSciencesResearchandTechnologySupport
212
letes were divided into two groups according to their
performance in competitions: I — high professional
group, II — middle level group.
As shown in Table 1, indicatorsHR and BP in both
groups of athletes have the same value, and the value
of these indicators point to a good recovery of the car-
diovascular system. However, the performance of the
MOC and PWC in group I was significantly above
the rate of group II and correlated with the level of
professional training of athletes. Control group has
significantly lower MOC and PWC, and indicators of
the cardiovascular system showing that these testees
are above their limits of adaptation at this test load.
Table 1: Indicators of cardiovascular and performance after
the load test
Indicator
Groups
Group I Group II Control
HR, beats/min 54− 74 56− 71 110− 118
BP, mm Hg 130/60 130/75 150/90
MOC, ml·kg/min 60± 1 51± 6.8 33± 5.2
PWC-170, kgm/kg 21.8± 1 17.3± 2.13 11.4± 1.7
The effects of exercise on the somatic nervous
system and the coordination of movements are pre-
sented in Table 2. Columns ’A’ and ’B’ show the
results in tests before and after exercise, respec-
tively. As the table shows, the reaction rate (based on
reflex-meter) and sensorimotor coordination (in terms
tremor-meter) before exercise are same in both groups
of athletes, but after training indicators of Group I are
much better.
Table 2: Indicators of reaction speed and tremor before and
after the load.
Indicator
Groups
Control Group I Group II
A B A B A B
Reflex, ms 380 495 126 96 129 128
Tremor, errors 30 52 30 10 30 25
In the control group, the rate of reaction and sen-
sorimotor coordination worsens after a load test, that
indicates the deterioration of conditioned reflex activ-
ity and inadequate physical load, which led to fatigue.
Pupillometry results are presented in Tables 3 and
4. Columns ’A’ and ’B’ show test results before and
after exercise, respectively. For athletes columns ’C’
and ’D’ show results before and after the competition.
As shown in Table 3, latent period of pupil reac-
tion T
lat
in Group I before exercise is much shorter
(at 48ms), than in the control group. For Group I T
lat
becomes shorter after a training and is reduced even
more before compatition, that can be explained by
emotion tension. After the competition T
lat
increases
to the level observed after training, but does not reach
Table 3: Dynamics of pupillometry parameters for Group I
and Control.
Parameter
Groups
Control Group I
A B A B C D
T
lat
, ms 283 306 235 224 216 223
T
para
,ms 408 401 441 453 483 508
A,% 8 6 12 14 15 16
V,% 65 57 76 82 84 90
the values that characterize the state of rest. Thus, the
readiness of athletes in Group I, characterized by T
lat
,
increases during exercise, peaking before the compe-
tition. Observed dynamics of T
lat
in this group of ath-
letes is positive and indicates an adequate adaptation.
Dynamics of T
para
for Group I is characterized
by a progressive increase. It is minimum in the
state of rest, grows after training, grows more be-
fore competition, reaching a maximum after compe-
tition. This demonstrates high functionality of ath-
letes in Group I. Maintaining a high level indicator
after the event shows that the functional reserves of
the athletes in this group have not been exhausted by
psycho-emotional and physical stress even till the end
of the competition.
A similar pattern is observed for the reaction am-
plitude A. For Group I the indicator increases during
exercise, increases even more before the competition
and reaches a maximum by the end of the competi-
tion. This behavior shows that the potential perfor-
mance of athletes by the end of the competition is not
exhausted, but due to the inertia of energy mobiliza-
tion processes remained at a high level even after the
competition.
Recovery criterion V for Group I is also signifi-
cantly higher than in control group. After training,
V value is significantly higher than before training
and remains approximately same before the compe-
tition. After the competition the recovery process is
strengthened. Thus, the pupillometry study of Group I
confirms a known phenomenon of overcompensation
after exercise for well-trained athletes. Pupillometry
analysis allows to conclude that in this group of vol-
leyball players a high level of adaptation of the auto-
nomic nervous system to physical activity is achieved.
For these athletes psycho-emotional load during com-
petition stimulates the adaptive mechanisms.
Table 4: Dynamics of pupillometry parameters for Group
II.
Parameter
Group II
A B C D
T
lat
, ms 251 253 246 274
T
para
, ms 427 432 442 421
A, % 10 10 12 9
V, % 74 77 80 68
MonitoringoftheFunctionalStateofAthletesbyPupillometry
213

As can be seen by comparing the tables 3 and
4, value and dynamics of pupillogram parameters of
Group II significantly differ from Group I. Parameters
of Group II show higher activity than that of control
group, but lower than in Group I.
The latent period of the reaction T
lat
is longer.
Whereas in Group I duration of the latent period de-
creased after training and before the competition, in-
dicating the improvement of readiness, no significant
differences of T
lat
is found for Group II, and after the
competition the latency significantly increases. This
marks a decline of starting readiness for these athletes
and slower decision making.
Level of reaction revealed by duration of parasym-
pathetic phase T
para
generally follows the dynamics
of T
lat
. Under the influence of emotional tension be-
fore the competition, the durability of reaction in-
creases, but after the event it becomes worse than be-
fore training. Such dynamics indicates an insufficient
degree of fitness and lower potential performance of
athletes in Group II compared with Group I.
Reaction amplitude A is significantly lower in
Group II compared to Group I and does not change
under the influence of physical load during training.
Before the competition, under the influence of emo-
tional stress, these athletes demonstrate an increase of
the amplitude, but after the contest reaction strength
declines.
Distinct differences between two sportsmen
groups exist also in recovery. Characteristic of Group
I is a positive trend of all pupillogram parameters dur-
ing training and competition. Characteristic of Group
II is the lack of positive dynamics after exercise com-
pared with the resting state, the trend toward improve-
ment in these areas before the competition and a sig-
nificant decline after the competition. Apparently, in
this group of athletes at the time of tests reached the
limit of adaptation capabilities of autonomic regula-
tion. This yields slight improvement in performance
under the influence of emotional stress before com-
petition, but then frustration during the competition.
Evidence of this frustration is the deterioration of all
pupillogram parameters after the competition.
4 COMPARISON OF SPORTS
SPECIALIZATIONS
Apart from monitoring of training process
pupillometry-based estimation may be applied
in other aspects. One of them is evaluation of the
appropriateness of the athlete to this or that sport
specialization. Different specializations require
different physical and psychical characteristics. A
study of athletes from different sport specializations
was performed in order to determine whether such
differences can be revealed by pupillometry.
Male athletes were tested from three different spe-
cializations: power (boxing), game (volleyball) and
endurance (skiing) in the age group under 25 years.
The control group consisted of men of the same age
who were not athletes. All participants in the study
period were healthy. Each groups included at least 20
persons. Table 5 key indicators for groups of athletes
are shown. The groups are designated as ’P’, ’G’, ’E’
(power, game, endurance). Control group indicators
are taken as 100%.
Table 5: Pupillogram parameters for athletes of different
specializations.
Parameter
Groups
P G E
T
lat
89% 78% 87%
T
para
69% 72% 73%
A 164% 165% 151%
V 150% 175% 172%
In general, the reaction of athletes of different spe-
cializations differ: reduced amplitude response in a
group of endurance, which is associated with the need
to save power and distribute it over a longer period.
The reaction time is less for the Game group that re-
flects the focus on making quick decisions. Degree of
recovery is higher for Game and Endurance groups.
These indicators are lower for Power group, and it
is logical, because these sports suppose high perfor-
mance in short time periods, whereas recovery may
be slow.
5 CONCLUSION
Binocular pupillometry is an objective method of as-
sessing the state of the autonomic nervous system and
an important additional method for complex evalua-
tion of the functional state of the athletes. Studies
of pupil reflex in persons involved in various sports
revealed a significant correlation between the time
of pupil constriction and overall reactivity of human.
Data obtained by pupillometry correlate with analyses
of reflex-meter, tremor measurements, latent periods
of somatic motor responses.
Binocular pupillometry method allows estimating
the degree of athlete’s adaptation to the physical and
psycho-emotional stress. Absence of positive dy-
namics of pupillogram parameters after exercise com-
pared with the resting level indicates tension in adap-
tation processes and the threat of failure of adap-
tation during the competition. Analysis of the dy-
icSPORTS2014-InternationalCongressonSportSciencesResearchandTechnologySupport
214

namics pupillogram parameters allows to effectively
adjust the training process of athletes, analyze their
functional fitness and health, optimize and personal-
ize training loads at various stages of preparation, as
well as to identify athletes with limited reserves of
adaptation and make the selection of athletes for com-
petitions.
Method of computer binocular pupillometry is
easy to use, requires no special training and can be
utilized for mass screening.
ACKNOWLEDGEMENTS
Supported by the RFBR grant 12-07-00778.
REFERENCES
Ananin, V. (1982). Bioregulation of human pupillomotor
system. In Bionic problems, number 28, pages 88–98.
Andreassi, J. (2000). Pupillary response and behavior. Psy-
chophysiology: Human Behavior and Physiological
Response. fourth ed. Lawrence ErlbaumAssociation,
Mahwah, NJ.
Apter, J. (1956). Studies on the autonomic innervation of
the iris. In Amer. J. Ophthalm., volume 42, pages 122–
130.
Dolmatova, T., Graevskaya, N., Kim, D., Varchenko, N.,
Makarchuk, I., and Gankin, K. (2001). Screening
method of synchronous binocular pupillometry in the
monitoring of sportsmen functional state. In Theory
and Practice of Physical Culture, number 6, pages 14–
17.
Gankin, K., Gneushev, A., and Matveev, I. (2014). Iris
image segmentation based on approximate methods
with subsequent refinements. In Journal of Computer
and Systems Sciences International, volume 53, pages
224–238.
Hamilton, J. (1994). Time Series Analysis. Princeton Uni-
versity Press.
Karpman, V., Belotserkovsky, Z., and Gudkov, I. (1988).
Testing in sport medicine. Moscow. Physical Culture
and Sport.
Nacatani, Y. and Yarnashita, K. (1985). Ryodoraku
Acupunctur. Chun-Jo, Freiburg.
Shahnovich, A. (1964). Pupillography. Moscow. Medicine.
Smirnov, V. (1953). Pupils in norm and pathology.
Moscow. Medicine.
Velhover, E. and Ananin, V. (1991). Introduction to iridol-
ogy. Pupil diagnostics. Peoples’ Friendship Univer-
sity, Moscow.
MonitoringoftheFunctionalStateofAthletesbyPupillometry
215
