
Mining for Adverse Drug Events on Twitter
Felipe Duval, Ernesto Caffarena, Oswaldo Cruz and Fabrício Silva
Fundação Oswaldo Cruz - Instituto Oswaldo Cruz, Av. Brasil 4365, Rio de Janeiro, Brazil
Keywords: Adverse Event, Data Mining, Text Mining, Big Data, Pharmacovigilance, Neglected Diseases, UMLS,
Twitter, Tweet, Nosql, Disproportionality Analysis, Malaria, Dengue, Ruby, Ctakes, Drug Safety, Adverse
Drug Reaction, Natural Language Processor, Post-Marketing Phase, REST API.
Abstract: At the post-marketing phase when drugs are used by large populations and for long periods, unexpected
adverse events may occur altering the risk-benefit relation of drugs, sometimes requiring a regulatory
action. These events at the post-marketing phase require a significant increase in health care since they
result in unnecessary damage, often fatal, to patients. Therefore, the early discovery of adverse events in the
post-marketing phase is a primary goal of the health system, in particular for pharmacovigilance systems.
The main purpose of this paper is to prove that Twitter can be used as a source to find new and already
known adverse drug events. This proposal has a prominent social relevance, as it will help
pharmacovigilance systems.
1 INTRODUCTION
At the post-marketing phase when drugs are used by
large populations and for long periods, adverse
events (AE) may occur, altering the risk-benefit
relation of drugs, sometimes requiring a regulatory
action. Adverse events are health problems that may
arise on users or patients during treatment with a
drug. They could be caused by medication errors,
low quality drugs, adverse drug reaction (ADR),
medical interactions and poisoning (Mendes, 2008).
ADR is any unintentional, harmful or
undesirable drug response that occurs at regular
doses given to a patient for prophylaxis, diagnosis,
disease therapy or changes of physiological
functions.
Despite the amount of research, tests and
considerable time for a drug to reach its marketing
stage, sometimes some adverse drug effects are not
identified. The number of patients in phases I to III
is limited, and its selection and treatment often
differs from the methods used in clinical practice
(Venulet and Ham, 1996). For that, the earlier
discovery of AEs in the post-marketing phase it is a
primary goal of health’s systems, mainly for the
pharmacovigilance.
Computational methods commonly referred as
"signal detection" or "tracking" algorithms allow
drug safety evaluators to analyze a large amount of
data to find signs of potential AE risks. These
methods have been shown to have extreme
significance in pharmacovigilance. For example, the
Food and Drug Administration (FDA) routinely
traces signals to generate statistics reports
associations for all millions of drug combinations
and events in their adverse event communication
system. Nevertheless, these signs alone are not
sufficient to confirm a causal relation, but can be
considered as first warnings that require more
evaluation by experts to establish causality. This
new evaluation typically consists of a complex
process in which the evaluators analyze drug safety
information, such as time relations, published case
reports in the literature, biological and clinical
plausibility, data from clinical trials and
epidemiological studies in multiple related health
databases.
Several studies have shown that search logs
(Ginsberg 2009; Denguetrends 2014; Flutrends
2014) and social networks (Signorini 2011; Lampos
and Cristianini 2012) can be very useful for
epidemiological surveillance networks. The main
objective of this paper is to prove that Twitter can be
used to find new "adverse drug event" associations.
In order to do accomplish the objective we will build
an automated system that will gather and process
tweets to find these associations.
This paper is organized as following. Section 2
354
Duval F., Caffarena E., Cruz O. and Silva F..
Mining for Adverse Drug Events on Twitter.
DOI: 10.5220/0005135203540359
In Proceedings of the International Conference on Knowledge Discovery and Information Retrieval (KDIR-2014), pages 354-359
ISBN: 978-989-758-048-2
Copyright
c
2014 SCITEPRESS (Science and Technology Publications, Lda.)

describes the methods used to extract and process
Twitter data. Section 3 describes the storage of the
large amount of data. Section 4 shows the filtering
of previous data to determine adverse events and/or
drugs and evaluate tweets. Section 5 explains the
disproportionality analysis used to find relevance
from filtered data. Section 6 deals with an overview
of the preliminary results. Section 7 concludes with
future directions of this work. We will initially focus
on neglected disease drugs like malaria and dengue,
but we also will perform some research with AIDS.
The system pipeline can be viewed in Figure 1.
Gold
Standard
Evaluation
Drug‐adverse
EventFilter
Tweets
Twitter
pre‐processor
Disproportionality
analysis
Figure 1: System overview.
2 TWITTER PROCESSOR
Twitter (Twitter, 2014) is a social network and
microblogging service made up of 140-character
messages called tweets, which are our targeted data.
In this phase, data will be processed to facilitate the
drug and adverse event associated to it. This stage
has an initial step that consists of collecting tweets to
process them afterwards. The data is in text format
and should go through a process that extracts natural
medicines, diseases and symptoms information to be
mapped to Concept Unique Identifiers (CUIs)
defined by the UMLS (Bodenreider, 2004) and other
medical language patterns aiming standardization. In
this phase the cTAKES (cTAKES, 2014) tool will be
used.
2.1 Collecting Tweets
To collect tweets we studied the Twitter REST API
(Twitter REST API, 2014) and Twitter Streaming
API (Twitter Streaming API, 2014). REST stands
for Representational State Transfer architecture
proposed by (Fielding, 2000) and is a way to
perform CRUD operations (create, read, update or
delete) on the server using simple HTTP calls. A
REST Application Programming Interface (REST
API) is a type of web server that enables a client,
either user-operated or automated, to access
resources that model a system's data and functions
(Masse, 2011). Both APIs need a Twitter’s account
for using and present some limitations. Therefore,
we have searched other ways to get tweets with the
four Twitter certified data resellers: (Topsy, 2014;
Gnip, 2014; Datasift, 2014; Dataminr, 2014). They
all have access to Twitter’s firehose (complete
public data), and most of them have REST APIs to
access these data.
To get data from any reseller, a license is needed.
Some give a temporary free license for research, but
others only provide the data by means of the
payment for the service.
We have made programs using both Twitter’s
API with the twitter rubygem (Twitter Rubygem,
2014) and some programs using the resellers API.
2.1.1 Twitter REST API
The REST API uses GET and POST methods to
give access to many Twitter’s resources like
timelines, tweets, searches, direct messages,
favorites, users, geolocation, followers, trends and
others. However, it has several limitations such as:
450 requests / 15 minutes
Returns only recent tweets (about 1 week)
To use the API an API Key is needed and can be
acquired freely.
A Ruby program was made to use this API. As
the input, the searched query is used, and the list of
tweets related to it is given as the output, which can
be a file with one tweet per line or directly stored in
a database.
2.1.2 Twitter Streaming API
This API allows access to continuous data stream
from some resources. Hence, we keep a permanent
connection with Twitter to gather new tweets that
were related to some queries.
A Ruby program was also made to use this API.
It receives as input the searched queries and as
output, it stores news tweets in the database.
Gathering these resources we intent to create a
standard database for searching adverse events.
We are currently collecting tweets with neglected
diseases.
MiningforAdverseDrugEventsonTwitter
355

2.1.3 Topsy
Topsy is a Twitter data reseller that claims to have
all the tweets since 2006 and was bought by Apple
in 2013. It also has an API with fewer resources than
the official Twitter, being less limited than Twitter.
To use the Topsy API, an API Key is also needed
and with it, it is possible to search old tweets.
2.1.4 GNIP
GNIP is another Twitter data reseller. It also has
data from others social networks as Tumblr,
WordPress, Foursquare, Disqus, IntenseDebate,
StockTwits, and GetGlue. It was recently bought by
Twitter itself.
2.1.5 Others Data Resellers
DataSift has data from many social networks, and it
has a very well documented API for developers, but
it has not a free license for research. It also offers a
seven days free trial period, being paid after it.
Dataminr focus in areas of Finance, News and
the Public Sector, and it has not a free license. For
that, we did not make a deep study of its resources.
2.2 Processing
After collecting the tweets, we will run them through
natural language processor (NLP). Wu (2012)
compared some tools for this task: Medlee
(Friedman, 1994), cTAKES and MetaMap
(Aronson, 2001). One of the best-known NLP in the
medical field is the Medlee. However, it is neither
free anymore nor open source, so we chose
cTAKES, an Apache NLP for extraction of medical
data, using some sources that we will use to create
our benchmark.
We also use the MedlinePlus Connect Web
Service (MedlinePlus, 2014) and the RxNorm
RESTful API (RxNorm API, 2014) to get drug
adverse effects and name spelling suggestions.
2.2.1 cTAKES
Apache clinical Text Analysis and Knowledge
Extraction System (cTAKES) is an open-source
natural language processing system to extract
information from electronic medical record clinical
free-text. It can identify different types of clinically
named entities from sources as the Unified Medical
Language System (UMLS) - medications,
diseases/disorders, signs/symptoms, anatomical sites
and procedures.
cTAKES uses the Apache UIMA Unstructured
Information Management Architecture engineering
framework and Apache OpenNLP natural language
processing toolkit. It has been used in the biomedical
domain in cases like phenotype discovery,
translational science, pharmacogenomics and
pharmacogenetics.
For better use of cTAKES with UMLs, a UML
user ID and password are needed, which can be
acquired freely at the U.S. National Library of
Medicine / National Institutes of Health (NIH)
(NLM, 2014). Because cTAKES’s language is java,
we made a java program for better and faster
integration with it. The program has as input, the
query (a drug or disease) used in the previous
session. It search the database for all tweets related
to that query to process each one with cTAKES.
2.2.2 MedlinePlus Connect Web Service
MedlinePlus Connect is a free service of the
NLM/NIH and the Department of Health and
Human Services (HHS). It provides up-to-date
health information resources.
MedlinePlus Connect Web Service supports the
International Classification of Diseases (ICD), the
National Drug Code Directory (NDC), the
normalized naming system for generic and branded
drugs (RxNorm), the Systematized Nomenclature of
Medicine, Clinical Terms (SNOMED CT) and
others codes.
We used it to get drug adverse effects. For that,
we made a ruby program that uses as input an
RXCUI or NDC from a drug. The output consists in
the adverse effects of this drug classified as normal
or serious.
For example, the input ‘49349056102’ (NDC
from mesalamine) returns: back pain, nausea,
vomiting, heartburn, burping, constipation, gas, dry
mouth, itching, dizziness, sweating, acne, slight hair
loss, decreased appetite and others adverse effects
associated to that drug.
2.2.3 RxNorm RESTful API
The RxNorm RESTful API is a webservice
developed at the NLM for accessing RxNorm data.
We use it to get the RxCUI from a drug name and to
get drug spelling suggestions to search in tweets.
This API is used in a ruby program integrated with
the MedlinePlus Connect.
3 DATABASE
As working database, we chose the noSQLDB due
KDIR2014-InternationalConferenceonKnowledgeDiscoveryandInformationRetrieval
356

to the large amount of data to be processed. The
specific noSQLDB we use is MongoDB because we
are using only one server. Figure 2 shows how we
store tweets in MongoDB Documents.
Query
{
{“text”:”malaria”,“tweets_documents”:[
{“name”:”Malaria1”,”start”:”01/01/2010”,
”end”:”31/12/2010”},
{“name”:”Malaria2”,”start”:”01/01/2011”,
”end”:”31/12/2011”},...
]},
{“text”:”dengue”,“tweets_documents”:[
{“name”:”Dengue1”,”start”:”01/01/2010”,
”end”:”31/12/2010”},
{“name”:”Dengue2”,”start”:”01/01/2011”,
”end”:”31/12/2011”},...
]}
}
Malaria1
{
“tweets”:[
{“_id”:”12345”,”text”:”Tweettext1”,
”created_at”:”01/02/2010”,
”author”:”author1”},
{“_id”:”6789”,”text”:”Tweettext2”,
”created_at”:”01/03/2010”,
”author”:”author2”},
{“_id”:”99999”,”text”:”Tweettext3”,
”created_at”:”01/03/2010”,
”author”:”author3”},
]
}
Malaria2
...
Figure 2: MongoDB’s tweet documents.
The query document contains all the queries and
a link to the tweet’s documents that belong to it.
Each tweet’s document has at most 100,000 tweets.
MongoDB also has documents for diseases and
its adverse effects. These documents were created
using the MedlinePlus Connect Web Service.
4 FILTERING
Each run of the system will be directed to one or
more drugs and/or particular adverse events
previously defined. In this step data from the
previous one will be filtered to leave only drug
and/or adverse events needed to the current
execution.
5 DISPROPORTIONALITY
ANALYSIS
Disproportionality analysis methods for drug safety
surveillance are the primary class of analytic
methods used to analyze data from spontaneous
reporting system (SRS). SRSs receive reports that
comprise of one or more drugs, one or more adverse
events (AEs) (Zorych, 2013). In this paper, we are
considering tweets as SRS’s reports.
Some of the most used disproportionality
analysis methods are the multi-item gamma-Poisson
shrinker, MGPS, (DuMouchel 1999; DuMouchel
and Pregibon 2001; Fram 2003), proportional
reporting ratios, PRR, (Evans, 2001), reporting odd
ratios, ROR, (Rothman, 2004), and Bayesian
confidence propagation neural network, BCPNN,
(Bate 1998; Norén 2006).
The basic task of a disproportionality method is
to rank order the tables in order of “interestingness”.
These methods search within SRS databases for
“interesting” associations and focus on low
dimensional projections of the data, specifically 2-
dimensional contingency tables.
Different disproportionality methods focus on
different statistical measures of association as their
measure of “interestingness”. MGPS focuses on the
“reporting ratio” (RR).
All these measures will serve to classify the
drug-adverse event peers previously identified. We
are currently using the Reporting Ratio (RR), PRR,
ROR and the information component (IC) used by
BCPNN but we intend to use also the MGPS with a
larger amount of tweets.
Table 1 shows a typical table, each number in the
table represents the amount of tweets. All tweets
have the disease “malaria”. Table 1 shows all
possible combinations with the drug “chloroquine”
and the adverse effect “itching”.
Table 1: A 2-dimensional projection example of tweets
database (malaria-chloroquine-itching).
Itching =
Yes
Itching =
No
Total
Chloroquine= Yes a=13 b=2250 n=2263
Chloroquine= No c=251 d=1632315 1632566
Total m=264 1634565 t=1634829
Table 2 shows the formulae for the measures of
association we used and the values related to the
example above. Letters ‘a’, ‘b’, ‘c’, ‘d’, ‘t’, ‘m’ and
‘n’ are values from Table 1. The ‘n’ value shows us
the amount of tweets containing that adverse drug
event. The higher the values, the higher the
probability the drug to cause the AE. Also, if the
drug and the AE are stochastically independent, the
measures will have a null value.
Table 2: Formulae for the measures of association.
Measure of Association Formulae Values
RR – Reporting Ratio (t.a)/(m.n) 35.57355
PRR – Proportional
Reporting Ratio
(a.(t-n))/(c.n) 37.36421
ROR – Reporting Odds
Ratio
(a.d)/(c.b) 37.57431
IC – Information
Component
log2(RR) 5.15273
We currently only did these analysis counting the
words in tweets but further analysis will be made
using cTAKES. The system performs this analysis
MiningforAdverseDrugEventsonTwitter
357
for all drugs/ adverse effects in the database for the
input query.
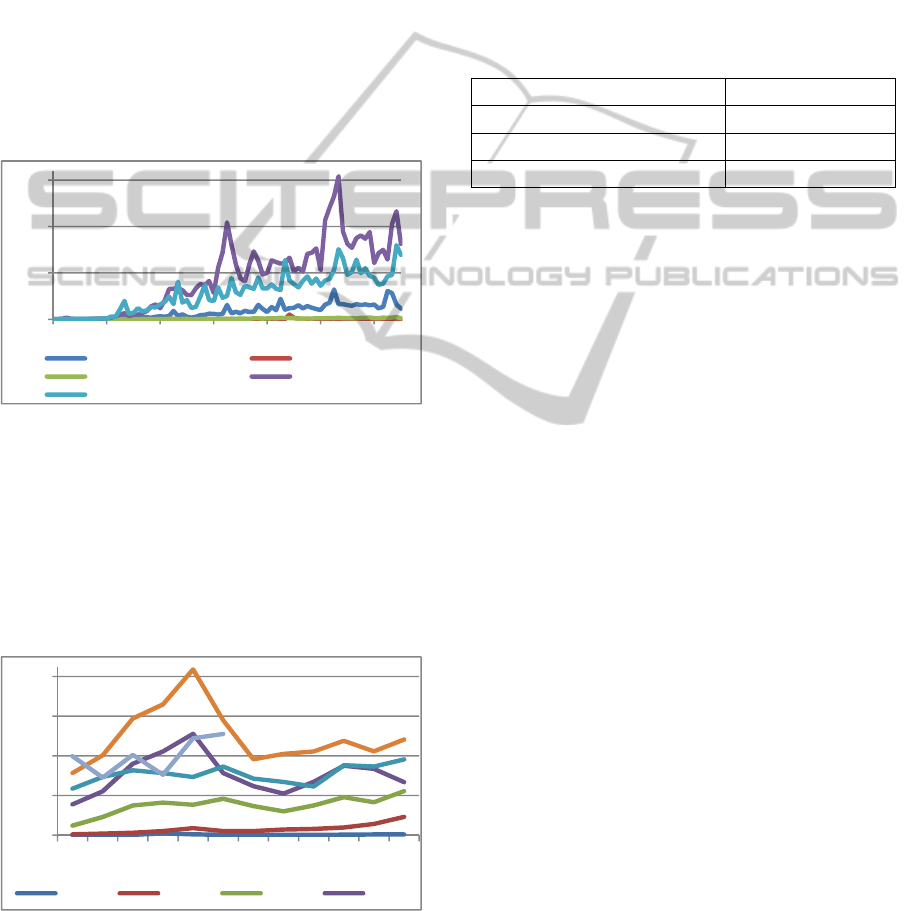
6 PRELIMINARY RESULTS
First, we queried Twitter to see the amount of tweets
related to some neglected diseases since its creation
in 2006, but until 2008 there were few tweets per
month (less than 200), so we decided to show only
tweets from 2008/Jan to 2014/Jun.
We searched for tuberculosis (196790 tweets),
Chagas disease (19999 tweets), leishmania (53338
tweets), dengue (3587284 tweets) and malaria
(2161169 tweets). As it can be seen in Figure 3,
dengue and malaria are the ones with most tweets.
Figure 3: Disease's tweets since 2008.
The y-axis represents the amount of tweets in
10,000 scale and the x-axis the month since
2008/Jan.
Since there are no drugs for dengue, we have
chosen malaria for further research. However,
because dengue is one of Brazil’s principal diseases
we studied its tweets a little more and constructed a
tweet/per month graph as showed in Figure 4.
Figure 4: Dengue tweet's per month.
Figure 4 show that the peaks of tweets were in
May, which is the month when we recorded higher
indices of dengue. This event shows that tweets
could be used for dengue’s research.
After this, we queried tweets related to some of its
drugs: mefloquine, lariam, chloroquine, doxycycline
and primaquine. We also queried AIDS/HIV and its
drugs: efavirenz, abacavir, stavudine, delavirdine,
didanosine, etravirine, emtricitabine, zidovudine,
nevirapine, lamivudine, rilpivirine.
Table 3 bellow shows some reporting ratio
values we have found at the disproportionality
analysis.
Table 3: Disproportionality analysis results.
Disease/Drug/AE Reporting Ratio
HIV/lamivudine/rash 41.95414
Malaria/ chloroquine/itching 35.57355
Malaria/chloroquine/vomit 12.61881
7 DISCUSSION
This system is still under construction, and it is one
of multiple pipelines, each one with different data
sources that will then be combined to obtain new AE
and historical changes in already knew AE. We
already found strong indication that tweets can be
used as a source for pharmacovigilance and one of
the possible uses is for dengue studies because
dengue’s tweets peak happened in the same month
as the disease did (Figure 4).
In our study, we found that malaria and dengue
where the most tweeted diseases. Further research
will be made with others neglected diseases.
So far, obtained results on disproportionality
indicate that Twitter can be used to find AE, as it
was shown in Table 3. Hence, we can proceed our
research on Twitter to finding new drug AEs.
Since Twitter reliability for finding new drug
AEs is not known, one of our tasks is to find already
known adverse drug events in tweets to see that
reliability.
ACKNOWLEDGEMENTS
We are grateful to the Scientific Computing
Program, Oswaldo Cruz Institute / Fiocruz, CAPES,
PAPES VI - Fiocruz.
REFERENCES
cTAKES [Online]. Available: http://ctakes.apache.org/
0
5
10
15
0 122436486072
tweetsx10000
tuberculosis chagasdisease
leishmaniose dengue
malaria
0
4
8
12
16
jan
feb
mar
apr
may
jun
jul
aug
sep
oct
nov
dec
tweetsx10000
"2008" "2009" "2010" "2011"
KDIR2014-InternationalConferenceonKnowledgeDiscoveryandInformationRetrieval
358

[Accessed April 2014].
Dataminr [Online]. Available: http://www.dataminr.com/
[Accessed June 2014].
Datasift [Online]. Available: http://datasift.com/
[Accessed June 2014].
Denguetrends [Online]. Available: http://www.google.
org/denguetrends/br/#BR [Accessed April 2014].
Flutrends [Online]. Available: http://www.google.
org/flutrends/br/#BR [Accessed April 2014].
GNIP [Online]. Available: http://gnip.com/ [Accessed
June 2014].
MedlinePlus [Online]. Available: http://www.nlm.nih.gov/
medlineplus/connect [Accessed June 2014].
RXNorm API. [Online] Available from: http://mor.
nlm.nih.gov/download/rxnav/RxNormAPIREST.html.
Topsy [Online]. Available: http://topsy.com/ [Accessed
June 2014].
Twitter. [Online] Available from: http://www.twitter.com.
Twitter REST API. [Online] Available from:
https://dev.twitter.com/docs/api/1.1.
Twitter Rubygem. [Online] Available from:
https://rubygems.org/gems/twitter.
Twitter Streaming API. [Online] Available from:
https://dev.twitter.com/docs/api/streaming.
U.S. National Library of Medicine / National Institutes of
Health [Online]. Available: http://www.nlm.nih.gov/
[Accessed June 2014].
Aronson AR, editor Effective mapping of biomedical text
to the UMLS Metathesaurus: the MetaMap program.
Proceedings of the AMIA Symposium; 2001:
American Medical Informatics Association.
Bate A, Lindquist M, Edwards I, Olsson S, Orre R,
Lansner A, et al. A Bayesian neural network method
for adverse drug reaction signal generation. European
journal of clinical pharmacology. 1998;54(4):315-21.
Bodenreider, O. 2004. The unified medical language
system (UMLS): integrating biomedical terminology.
Nucleic acids research, 32, D267-D270.
DuMouchel W. Bayesian data mining in large frequency
tables, with an application to the FDA spontaneous
reporting system. The American Statistician.
1999;53(3):177-90.
DuMouchel W, Pregibon D, editors. Empirical bayes
screening for multi-item associations. Proceedings of
the seventh ACM SIGKDD international conference
on Knowledge discovery and data mining; 2001:
ACM.
Evans S, Waller PC, Davis S. Use of proportional
reporting ratios (PRRs) for signal generation from
spontaneous adverse drug reaction reports.
Pharmacoepidemiology and drug safety.
2001;10(6):483-6.
Fielding RT. Architectural styles and the design of
network-based software architectures: University of
California, Irvine; 2000.
Fram DM, Almenoff JS, DuMouchel W, editors.
Empirical Bayesian data mining for discovering
patterns in post-marketing drug safety. Proceedings of
the ninth ACM SIGKDD international conference on
Knowledge discovery and data mining; 2003: ACM.
Friedman, C., Alderson, P. O., Austin, J. H., Cimino, J. J.
& Johnson, S. B. 1994. A general natural-language
text processor for clinical radiology. Journal of the
American Medical Informatics Association, 1, 161-
174.
Ginsberg, J., Mohebbi, M. H., Patel, R. S., Brammer, L.,
Smolinski, M. S. & Brilliant, L. 2009. Detecting
influenza epidemics using search engine query data.
Nature, 457, 1012-1014.
Lampos, V. & Cristianini, N. 2012. Nowcasting events
from the social web with statistical learning. ACM
Transactions on Intelligent Systems and Technology
(TIST), 3, 72.
Masse M. REST API design rulebook: " O'Reilly Media,
Inc."; 2011
Mendes, M., Pinheiro, R., Avelar, K., Teixeira, J. & Silva,
G. 2008. História da farmacovigilância no Brasil. Rev
Bras Farm, 89, 246-251.
Norén GN, Bate A, Orre R, Edwards IR. Extending the
methods used to screen the WHO drug safety database
towards analysis of complex associations and
improved accuracy for rare events. Statistics in
medicine. 2006;25(21):3740-57.
Rothman KJ, Lanes S, Sacks ST. The reporting odds ratio
and its advantages over the proportional reporting
ratio. Pharmacoepidemiology and drug safety.
2004;13(8):519-23.
Signorini, A., Segre, A. M. & Polgreen, P. M. 2011. The
use of Twitter to track levels of disease activity and
public concern in the US during the influenza A H1N1
pandemic. PloS one, 6, e19467.
Venulet J, Ten Ham M. Methods for monitoring and
documenting adverse drug reactions. International
journal of clinical pharmacology and therapeutics.
1996;34(3):112.
Wu Y, Denny JC, Rosenbloom ST, Miller RA, Giuse DA,
Xu H, editors. A comparative study of current clinical
natural language processing systems on handling
abbreviations in discharge summaries. AMIA Annual
Symposium Proceedings; 2012: American Medical
Informatics Association.
Zorych, I., Madigan, D., Ryan, P. & Bate, A. 2013.
Disproportionality methods for pharmacovigilance in
longitudinal observational databases. Statistical
methods in medical research, 22, 39-56.
MiningforAdverseDrugEventsonTwitter
359
