
Platform for Multimodal Signal Acquisition for the Control of Lower
Limb Rehabilitation Devices
Douglas Ruy Soprani S. Araujo
1, 2
, Thomaz Rodrigues Botelho
1, 2
, Camila Rodrigues C. Carvalho
2
,
Anselmo Frizera
2
, Andre Ferreira
2
and Eduardo Rocon
3
1
Department of Electrotechnology, Federal Institute of Education, Science and Technology of Esp
´
ırito Santo,
S
˜
ao Mateus, ES, Brazil
2
Department of Electrical Engineering, Federal University of Esp
´
ırito Santo, Vitoria, ES, Brazil
3
Bioengineering Group, Consejo Superior de Investigaciones Cientificas, CSIC, Arganda del Rey, Spain
Keywords:
Electroencephalographic Signals, Electromyographic Signals, Inertial Sensors, Multimodal, Robotic Rehabil-
itation.
Abstract:
Patients with some sort of motor disability may benefit from robotic rehabilitation since it can provide more
control, accuracy and variety of training modes. This enhances the efficiency of the rehabilitation and, there-
fore, the recovery of the patient. Assistive devices, like exoskeletons or orthoses, can make use of physiological
data, such as electromyography (EMG) and electroencephalography (EEG), in order to detect the movement
intention. Combination of data can potentially improve the adaptability of assistive devices with respect to the
individual demands. Different methods can be applied depending on the neuromuscular disorder, therapy or
assistive device. In this work, we present a multimodal interface which integrates EEG, EMG and inertial sen-
sors (IMU) signals. Experiments were conducted with healthy subjects performing lower limb motor tasks.
The aim of the proposed system is to analyze the movement intention (EEG signal), the muscle activation
(EMG signal) and the limb motion onset (IMU signal). An experimental protocol is proposed. The results ob-
tained showed that the system is capable to acquire and process the biological signals synchronously. Results
indicated that the system is able to identify the movement intention, based on the EEG signal, the movement
anticipation, based on the muscle activation, and the limb motion onset.
1 INTRODUCTION
The number of individuals with some sort of lower
limbs disability due to several reasons as stroke and
spinal cord injuries is increasing (Tsukahara et al.,
2009). Such disabilities can also lead to secondary
problems, like wheelchair dependence, osteoporosis
and bedsores. Therefore, these disorders are likely
to decrease the quality of life. In order to recover or
enhance the lower limbs functions, rehabilitation pro-
grams are the most used treatment (Ju et al., 2005).
Robots have been introduced in rehabilitation as
a potential tool to implement physical therapies since
they can assist therapists performing repetitive move-
ments (Den
`
eve et al., 2008).
Exoskeletons or orthoses are assistive devices of-
ten used in robotic rehabilitation. Besides all the chal-
lenges brought from the structural design and con-
struction, the assistive devices should support self-
initiated movements for intuitive interaction. This is
desired in systems controlling neuroprosthetic or neu-
rorobotic devices that aim to assist patients with mo-
tor disabilities as naturally as possible, i.e. reducing
the impact of the assistive technology (Ib
´
a
˜
nez et al.,
2013). This can be achieved by adapting the con-
trol of the device with respect to the patient’s inten-
tion (Kirchner et al., 2014). Those devices can make
use of physiological data in order to detect or predict
limb movement. The combination of such data can be
used to improve the reliability of assistive rehabilita-
tion robotic systems.
The integration of physiological data-based recog-
nition into the control of an assistive technical device
has a great advantage which is the earliness of pre-
diction (Muralidharan et al., 2011). A prediction of
movement onset that was based on EEG analysis can,
for example, be confirmed by the detection of mus-
cle activity and corroborated by measuring the limb
49
Ruy Soprani S. Araujo D., Rodrigues Botelho T., Rodrigues C. Carvalho C., Frizera A., Ferreira A. and Rocon E..
Platform for Multimodal Signal Acquisition for the Control of Lower Limb Rehabilitation Devices.
DOI: 10.5220/0005138900490055
In Proceedings of the 2nd International Congress on Neurotechnology, Electronics and Informatics (NEUROTECHNIX-2014), pages 49-55
ISBN: 978-989-758-056-7
Copyright
c
2014 SCITEPRESS (Science and Technology Publications, Lda.)
motion onset. Thus, a multimodal system provides
not only the intention to move but also shows the ac-
tual execution of the movement and the position of the
lower limbs during the rehabilitation. Thus, it is pos-
sible to characterize a volitional movement from its
planning to its execution (Gallego et al., 2012). This
approach was implemented in different studies.
Rocon et al. proposed functional compensation of
upper limb tremors with a soft wearable robot using
EEG, EMG and IMU analysis (Rocon et al., 2010).
Ibanez et al. proposed an adaptive and asynchronous
EEG-based system for online detection of the inten-
tion to move in patients with tremor (Ib
´
a
˜
nez et al.,
2013). Kirchner et al. showed that the combination
of EEG and EMG can potentially be used for move-
ment prediction and improve the adaptability of as-
sistive technical devices through an offline analysis
(Kirchner et al., 2014).
In this study it is proposed a multimodal platform
that enables the synchronization and the analysis of
electroencephalographic (EEG) signal, electromyo-
graphic (EMG) signal and Inertial Measurement Unit
(IMU) signal. The aim is to analyze the movement in-
tention, the muscle activation and the effective move-
ment of lower limbs through EEG, EMG and IMU
signals, respectively.
This paper will have the focus on the architecture
of the synchronization, and implementation of an of-
fline analysis, of EEG, EMG and IMU data, acquired
in a lower limb movement task, in order to identify
the activation steps. An experimental protocol, which
involves sensors placement, is proposed for the tasks
performed by healthy subjects. The platform can be
used in the development of interfaces for rehabilita-
tion robotics devices aiming at adapting their control
with respect to the patient’s intention.
2 MATERIALS AND METHODS
The equipment used to acquire the EEG and EMG
data was the BrainNet
R
BNT-36 (Lynx Eletronica,
Brazil). It is based on the requirements of general
safety for medical electrical equipment and has the
approval of the entities responsible for regulation of
medical products.
EEG signal was recorded using a international 10-
20 system cap. The positions used were Fp1, Fp2, F7,
F3, Fz, F4, F8, C3, Cz, C4 and Pz.
A bipolar channel was used to acquire a surface
EMG (sEMG) signal. Passive Ag/AgCl gel electrodes
were positioned on the right subject’s thigh, accord-
ing to the international protocol SENIAM (Hermens
et al., 1999) at the rectus femoris muscle, as it can be
seen in Figure 2.
Tech MCS
R
(Technaid, Spain) was used to ac-
quire the inertial signals. This system provides real
time spatial orientation for each sensor. Two IMUs
were used in the experiments.
2.1 Control Architecture for Data
Acquisition
A C#-based software was developed for the integra-
tion of both commercial systems described above. It
uses the UDP communication protocol to send and
receive data packages from BrainNet
R
BNT-36. A
library, provided by the manufacturer of the Tech-
naid system to capture data through the USB com-
puter port was also used. The data were synchronized
and saved in a computer and processed offline. The
data acquisition of the software developed was vali-
dated using the calibration sinusoidal signal provided
by Brainet
R
BNT-36 and also by controlled experi-
ments doing rotations of the IMUs. A representation
of the system developed can be seen in Figure 1.
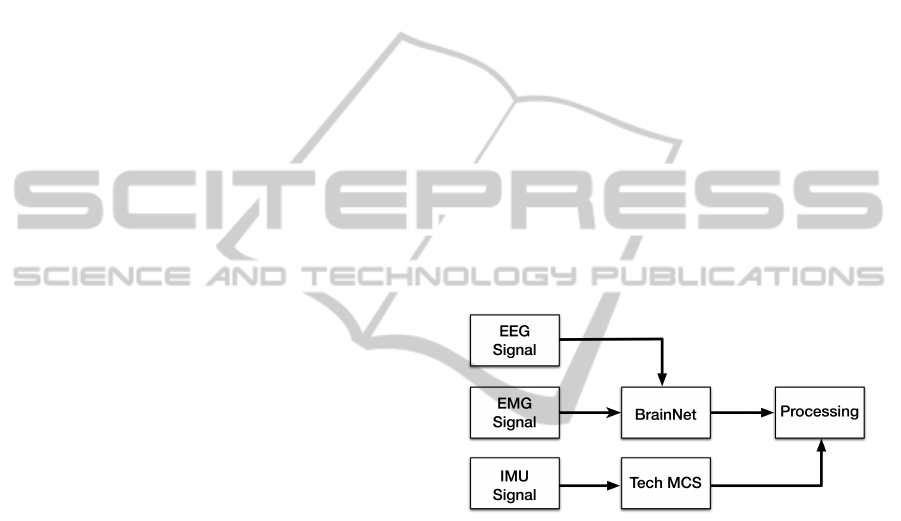
Figure 1: Representation of the platform proposed.
Figure 1 represents the proposed platform, as it
is can be seen, the software proposed integrates the
EEG, EMG signals acquired using the BrainNet
R
BNT-36 with the IMU signal acquired using the Tech
MCS
R
system. All data were synchronized and saved
in a computer for a offline processing, as illustrated.
The sampling frequency of the BrainNet
R
BNT-
36 was set to 600Hz, the maximum possible value.
The sampling frequency of the Technaid system was
set to 50Hz, compatible with the leg movement per-
formed in the experiments. The data processing is
made by MATLAB
R
-based software.
2.2 Experimental Protocol
Three female and one male, healthy and right-handed,
subjects with ages between 22 and 24 performed the
experiments. The proposed experiment was devel-
oped according to the protocol approved by Research
NEUROTECHNIX2014-InternationalCongressonNeurotechnology,ElectronicsandInformatics
50
Ethics Committee of Federal University of Esp
´
ırito
Santo Health Sciences Center (Project n. 214/10).
During the experimental session, subjects were
comfortably seated with hands resting on the legs and
with feet suspended, without touching the ground.
The angle between thigh and shank was assumed to
be 90
◦
. The calibration of the inertial system occurs
in this step. An acoustic signal indicates the end of
the calibration and the beginning of the experiment.
After about 10 seconds, another acoustic signal indi-
cates that the subject is allowed to perform the exten-
sion and flexion of the knee using both legs, from rest
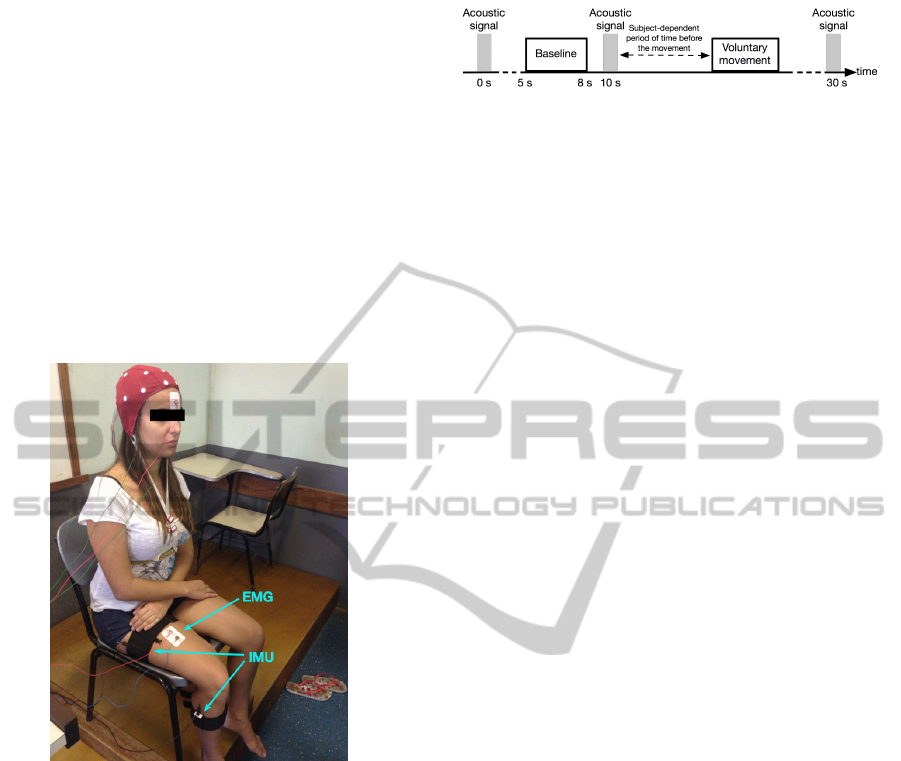
position up to maximum extension. The Figure 2 il-
lustrates a subject during the experiment wearing all
sensors.
Figure 2: User wearing the complete set of sensors during
an experimental session.
The inertial sensors were positioned on the right
thigh and shank of the subject. The placement pro-
tocol doesn’t require specific placement or any align-
ment between the sensors because the alignment was
done virtually during the data processing. The only
recommendation was to place the sensors on the ex-
ternal part of the leg, as it can be seen in Figures 2
and 4. The movement was assumed to be only in the
shank.
The protocol selected for the experiments defines
a self-chosen moment after hearing the acoustic indi-
cation to start the movement. The subject thinks and
immediately executes the task. The examiner asks to
the subject to perform the movement slowly and to
keep the eyes open, avoid blinking and swallowing.
Each experiment was composed by 30 trials of exten-
sion and flexion movement and one trial lasts approx-
imately 30 seconds. A graphical representation of one
Figure 3: Graphical representation of one trial.
trial can be seen in Figure 3.
Figure 3 illustrates one trial of the experiments
performed. As it can be seen, there is a subject-
dependent period of time before the voluntary move-
ment, after the second acoustic signal.
3 SIGNAL PROCESSING
The signal processing was made of two different
ways. To EEG signal, a multi-trial analysis was per-
formed while the EMG and IMU signals analysis
were a single-trial. Making not possible the presen-
tation of these three signals together.
3.1 EEG Signal Processing
EEG signal was used to estimate the movement in-
tention of the subject. In order to achieve this esti-
mative, the Event Related Desynchronization (ERD)
characteristic was evaluated by the classical method
described by (Pfurtscheller and Lopes da Silva, 1999).
The signals were filtered at µ and β bands by But-
terworth 4th order bandpass filters and the energy was
obtained.
The EEG signals were then analyzed under a per-
centage scale based on a baseline, represented in Fig-
ure 3. The baseline was evaluated between the 5th and
the 8th seconds of the experiment, while the subject
was resting before the second acoustic signal.
3.2 EMG Signal Processing
EMG signal was used to estimate the muscle activa-
tion of the subject during the experiment. For each
trial, the data was preprocessed with a variance fil-
ter defined by the Equation 1. In Equation 1, N is
the length of the window used for filtering, x is the
EMG raw signal and v is the EMG preprocessed sig-
nal. This processing was chosen for preserving the
initial muscle activation moment and for providing
enough differentiation between the rest and contrac-
tion positions, as described by (Kirchner et al., 2014;
Tabie and Kirchner, 2013).
An adaptive threshold classifier, as described by
the Equation 2, based on the mean and standard de-
viation, obtained in the baseline evaluates the initial
PlatformforMultimodalSignalAcquisitionfortheControlofLowerLimbRehabilitationDevices
51
muscle activation. The signals were processed on
windows with a length of 10 samples with 90% of
overlapping.
v(t) =
1
N − 1
N
∑
i=0
[x(t − i)]
2
−
1
N − 1
N
∑
i=0
x(t − i)
!
2
(1)
T (t) = m
N
(t) + pd(t)
N
(2)
In Equation 2, T is the threshold, m is the mean
value, d is the standard deviation and p the sensitiv-
ity factor of the threshold. N represents the length
of the window used to obtain the mean and the stan-
dard deviation. The moment of muscle activation is
defined when the first window, between a predeter-
mined number of consecutive windows, exceeds the
threshold. For each subject a leave-one-out cross val-
idation analysis of the data was performed and for the
parameters optimization a grid search was used.
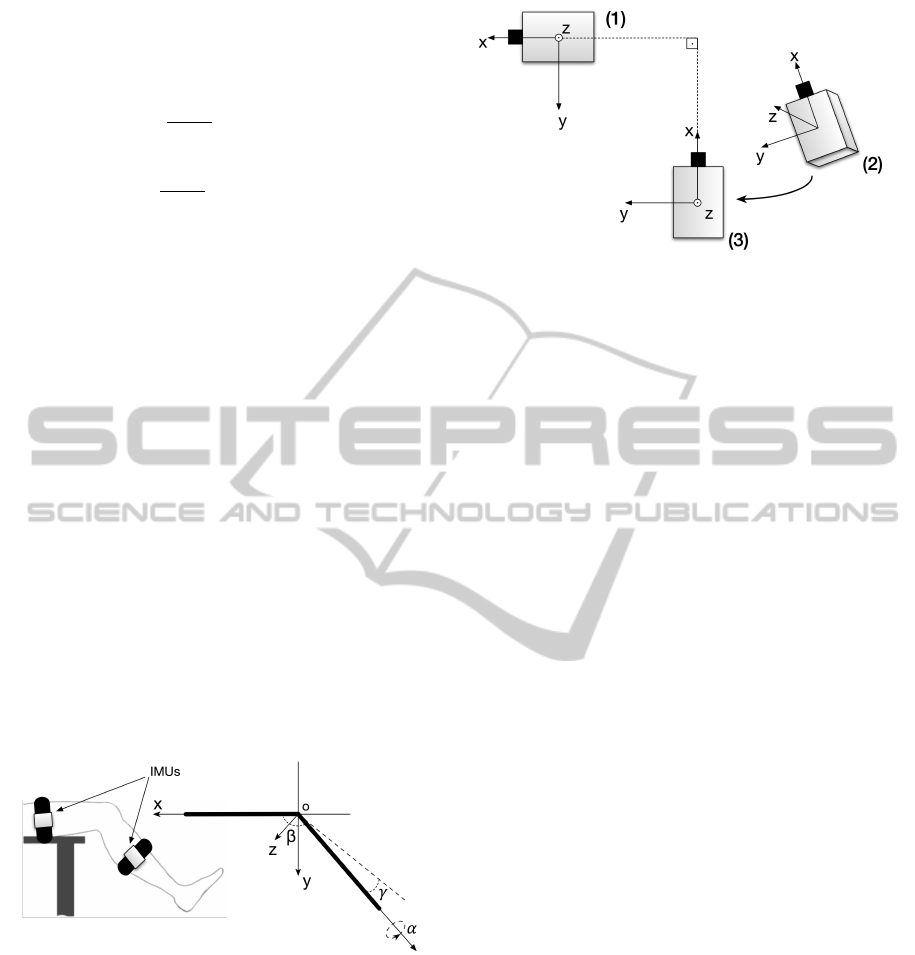
3.3 IMU Signal Processing
IMU signal was used to detect the movement onset,
i.e. the beginning of the limb displacement, and to
measure the angles of the knee joint. The three clin-
ical knee rotations occur: flexion/extension, abduc-
tion/adduction and internal/external rotation (Favre
et al., 2009). The thigh and shank can be represented
by links and the clinical rotations by β, γ and α, re-
spectively, as illustrated in Figure 4.
Figure 4: Inertial sensors placement, link-segment repre-
sentation of the leg and clinical rotations.
The angles measured between the thigh and the
shank were the relative angles between the sensors.
In order to measure these angles, the world reference
frame of the shank sensor was transformed to refer-
ence frame of the thigh sensor.
The sensors were supposed to be aligned in x and
z axes and to have an angle equal to 90
◦
between the
y axis when the calibration of the inertial system oc-
curs, as described in the experimental protocol and
illustrated in Figure 5.
Figure 5: Representation of the virtual alignment between
the inertial sensors.
A virtual alignment between the sensors was done,
achieving this configuration, in order to provide a
placement protocol regardless of sensors position.
Figure 5 shows the real shank IMU represented by
(2), the virtual shank IMU represented by (3) and the
thigh IMU is represented by (1).
The data from the IMUs were analyzed using a
threshold in order to determine the start of effective
movement. The data were also converted into Euler
angles in order represent the angles of the knee joint
movement along the tasks.
4 RESULTS AND DISCUSSION
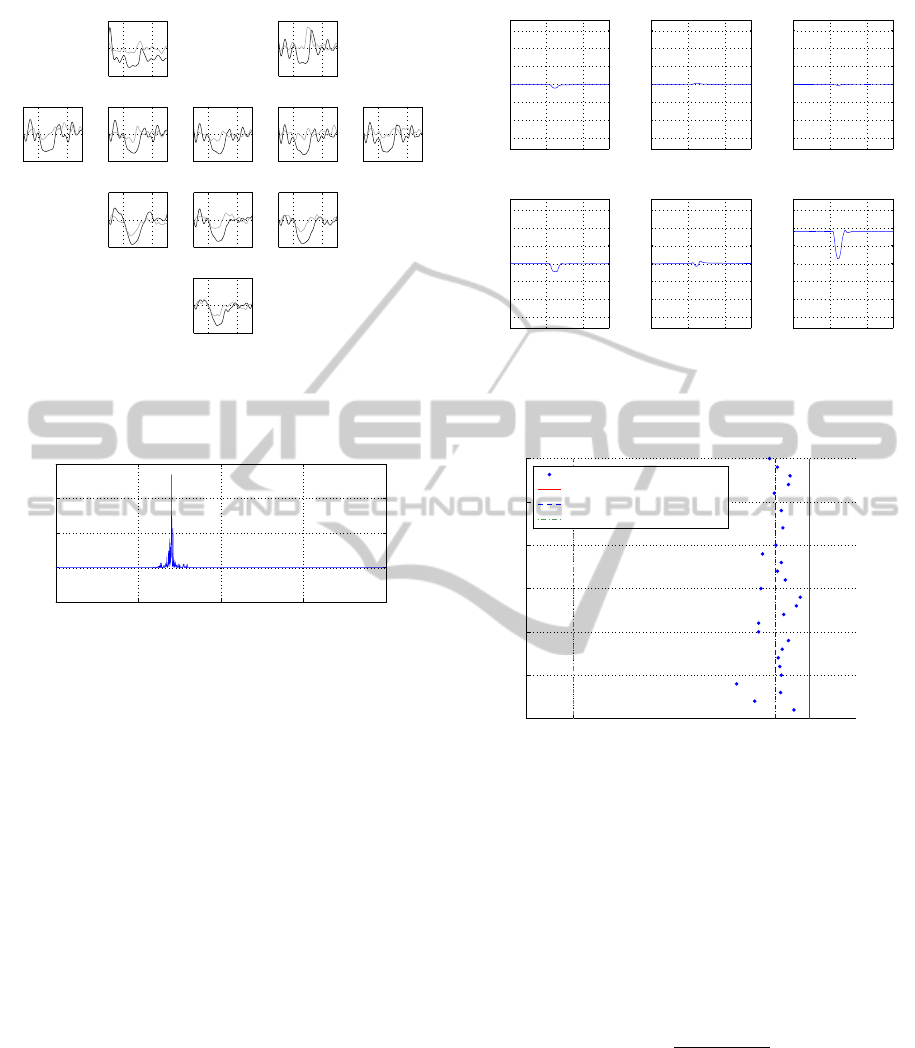
In Figure 6, the relative energy of µ and β bands of
the EEG signal is shown for the subject two. The first
five seconds were not shown because they represent
a signal stabilization and should not be taken into ac-
count. The last five seconds were not shown because
the trials were synchronized to the first moment of
movement along the trials, thus some samples had to
be discarded in the end of each trial. The ERD char-
acteristic can be seen in all channels, mainly in the
Cz, C3 and C4, which are positioned on the motor
cortex. In these channels the relative energy reaches
a decrease of approximately 80% in the µ band. The
ERDs are seen, approximately, from the 10th second
on. This is consistent with the movements performed
in the experiments.
In Figure 7, one trial of EMG, preprocessed with a
variance filter, of the subject two is shown. The time
scale is the same of Figure 6. An initial muscle acti-
vation can be seen in the 11th second, approximately.
The end of the muscle activation occurs in the 13th
second, approximately. This is consistent with the
time that the subject perform the extension and flex-
ion of the knee.
In Figure 8, the Euler angles related to the IMUs
signals for the same subject are shown. The angles
NEUROTECHNIX2014-InternationalCongressonNeurotechnology,ElectronicsandInformatics
52
10 20
−100
0
100
Fp1
10 20
−100
0
100
Fp2
10 20
−100
0
100
F7
10 20
−100
0
100
F3
10 20
−100
0
100
Fz
10 20
−100
0
100
F4
10 20
−100
0
100
F8
10 20
−100
0
100
C3
10 20
−100
0
100
Cz
10 20
−100
0
100
C4
10 20
−100
0
100
Pz
Figure 6: Relative energy of µ (black) and β (gray) bands,
in percent scale vs. time in seconds, obtained by an average
of 30 trials.
5 10 15 20 25
−2
0
2
4
6
x 10
5
EMG signal
Time (s)
A.U.
Figure 7: One trial of EMG signal preprocessed with a vari-
ance filter.
are related to the thigh sensor in calibration position.
In this figure, above, are shown the thigh sensor an-
gles. As it can be seen, only a small displacement oc-
curs. Thus, the movement can be considered only in
the shank. Below, the shank sensor angles are shown.
As it can be seen, mainly displacement occurs in Yaw,
which is related to the extension and flexion. The ini-
tial value was 90
◦
, as considered in the experimen-
tal protocol and obtained with the virtual alignment.
The final value depends on the subject’s extension. A
small displacement occurs in Roll and Pitch, which is
consistent with the clinical knee rotations. As it can
be seen, the initial limb displacement occurs, approx-
imately, in the 11th second.
In Figure 9, the distribution of prediction times
for EMG-based movement prediction for the subject
three is shown. Time point zero corresponds to the
physical movement onset, represented by the red line.
The dash-dot green line at time −0.5s indicates the
range up to where predictions based on EMG were
allowed. The movement onset up to the line at time
−0.5s was considered the EMG-window. The dashed
blue line represents the mean of EMG-based time pre-
dictions, which in this case was 72.3ms before the
0 10 20
−150
−100
−50
0
50
100
150
(a) Roll
Time (s)
Angle (Degrees)
0 10 20
−150
−100
−50
0
50
100
150
(b) Pitch
Time (s)
Angle (Degrees)
0 10 20
−150
−100
−50
0
50
100
150
(c) Yaw
Time (s)
Angle (Degrees)
0 10 20
−150
−100
−50
0
50
100
150
(d) Roll
Time (s)
Angle (Degrees)
0 10 20
−150
−100
−50
0
50
100
150
(e) Pitch
Time (s)
Angle (Degrees)
0 10 20
−150
−100
−50
0
50
100
150
(f) Yaw
Time (s)
Angle (Degrees)
Figure 8: One trial of IMU signals from both sensors, show-
ing Roll (a), Pitch (b) and Yaw (c) for the thigh sensor, and
Roll (d), Pitch (e) and Yaw (f) for the shank sensor.
−0.5 −0.0723 0
0
5
10
15
20
25
30
Time (s)
Trials
Time of EMG detection
Time of IMU detection
Average of correct detected EMG
Beginning of EMG window
Figure 9: Distribution of prediction times for EMG-based
movement prediction for the subject three.
movement onset. Only the classifications in the EMG
window are shown.
The classification results are summarized in Table
1. In Table 1 it is shown the accuracy of the EMG
classifier and the mean time of initial activation, tak-
ing into account only classifications inside the EMG-
window with the standard deviation. The accuracy is
defined by the Equation (3).
Ac(%) =
N
EMGW
.100
N
T
(3)
Where Ac is the accuracy of the system, N
EMGW
is the number of trials in which the EMG is classi-
fied in the EMG window and N
T
is the total number
of trials per experiment. As it can be seen, the ac-
curacy range was 46.67% up to 93.33%. The system
can classify the activation before the EMG window,
inside the EMG window, after the movement onset or
can not identify the activation. Thus, for the subject
PlatformforMultimodalSignalAcquisitionfortheControlofLowerLimbRehabilitationDevices
53

Table 1: Classification results of EMG-based prediction for
all subjects. The accuracy of the classification and the mean
time of EMG-based prediction inside the EMG-window
with the standard deviation.
Subject Accuracy (%) Time (ms)
1 70.00 −91.60 ± 91.30
2 46.67 −90.90 ± 130.70
3 93.33 −72.30 ± 46.20
4 57.67 −52.25 ± 51.40
Average 66.92 −76.74 ± 79.90
one and, mainly, for the subject three, is reached a
high level of accuracy. According to (Kirchner et al.,
2014), activations before the EMG-window were con-
sidered false positives. Taking into account all the
classes of classification, regardless of whether the de-
tection anticipates or not the movement onset or the
detection is classified before the EMG-window, 100%
of the trials were detected by the EMG classifier for
all subjects.
The difference of accuracy between the subjects is
directly related to the EMG time of activation, since
it defines the position of the EMG classification be-
tween the classes. The EMG time of activation de-
pends on many factors and vary between subjects and
trials, as it can be seen in Figure 9 and according to
the results achieved by (Kirchner et al., 2014).
The execution of the movement depends on many
motor unit-related parameters, e.g. twitch force, con-
tractile speed, axonal conduction velocity, fatigue re-
sistance, among others (Pons, 2008). Furthermore,
the surface electromyographic also depends on the
skin-electrode coupling which contributes to differ-
ent signals between subjects. Based on the study of
these characteristics, the length of the EMG-window
can be adapted for each subject. This can decrease the
number of wrong classifications of false positives. For
subjects whose accuracy is lower, the movement pre-
diction can be complemented by an EEG-based pre-
diction.
Depending on the type of neuromuscular disorder
and state of therapy, both, single EEG or single EMG-
based movement prediction, might no longer result in
good performance. In this case, the combination of
multimodal data should be even more relevant (Kirch-
ner et al., 2014).
5 CONCLUSIONS
A multimodal platform for lower limb studies in re-
habilitation based on EEG, EMG and IMU signals
was developed. An experimental protocol, applied
in healthy subjects to acquire data from the platform,
was also proposed. An offline analysis of the data
generated by this system in a lower limb movement
task was showed.
The analysis estimates the subject’s movement in-
tention evaluating the ERD characteristic in the EEG
signal and the muscle activation in the EMG signal.
The beginning of the movement was evaluated by
IMUs data, which also measure the angles between
the thigh and the shank of the subject during the tasks
performed.
The accuracy and the mean time showed the fea-
sibility of the interface proposed. Under a qualita-
tive analysis and based on the Figures 7, 8 and 9, the
system proposed was capable to acquire, synchronize
and process the combined signals. Thus, the platform
proposed can be used in the study and development of
multimodal interfaces. Prosthesis or orthoses whose
purpose is motor rehabilitation, adapting the control
of devices with respect to the patient’s intention, can
be developed with the platform proposed.
Results presented here were achieved in an offline
processing. In future work, a single trial algorithm
whose purpose is to analyze the EEG signal in order
to find MRPs will be applied. A platform which uses
online detection of EEG and EMG data will be ap-
plied to an exoskeleton, which is currently under de-
velopment.
REFERENCES
Den
`
eve, A., Moughamir, S., Afilal, L., and Zaytoon, J.
(2008). Control system design of a 3-DOF upper
limbs rehabilitation robot. Computer methods and
programs in biomedicine, 89(2):202–14.
Favre, J., Aissaoui, R., Jolles, B. M., de Guise, J. a., and
Aminian, K. (2009). Functional calibration procedure
for 3D knee joint angle description using inertial sen-
sors. Journal of biomechanics, 42(14):2330–5.
Gallego, J. A., Ib
´
a
˜
nez, J., Dideriksen, J. L., Serrano, J. I.,
del Castillo, M. D., Farina, D., and Rocon, E. (2012).
A multimodal human–robot interface to drive a neu-
roprosthesis for tremor management. IEEE Transac-
tions on Systems, Man, and Cybernetics, 42(6):1159–
1168.
Hermens, H. J., Freriks, B., Merletti, R., Stegeman, D.,
Blok, J., Rau, G., Disselhorst-Klug, C., and H
¨
agg, G.
(1999). European recommendations for surface elec-
tromyography.
Ib
´
a
˜
nez, J., Serrano, J., del Castillo, M., Gallego, J., and Ro-
con, E. (2013). Online detector of movement inten-
tion based on EEG—Application in tremor patients.
Biomedical Signal Processing and Control, 8(6):822–
829.
Ju, M.-S., Lin, C.-C. K., Lin, D.-H., Hwang, I.-S., and
Chen, S.-M. (2005). A rehabilitation robot with force-
position hybrid fuzzy controller: hybrid fuzzy control
NEUROTECHNIX2014-InternationalCongressonNeurotechnology,ElectronicsandInformatics
54

of rehabilitation robot. IEEE transactions on neural
systems and rehabilitation engineering : a publication
of the IEEE Engineering in Medicine and Biology So-
ciety, 13(3):349–58.
Kirchner, E. A., Tabie, M., and Seeland, A. (2014). Mul-
timodal movement prediction - towards an individual
assistance of patients. PloS one, 9(1):e85060.
Muralidharan, A., Chae, J., and Taylor, D. M. (2011).
Extracting Attempted Hand Movements from EEGs
in People with Complete Hand Paralysis Following
Stroke. Frontiers in neuroscience, 5(March):39.
Pfurtscheller, G. and Lopes da Silva, F. H. (1999). Event-
related EEG/MEG synchronization and desynchro-
nization: basic principles. Clinical neurophysiology
: official journal of the International Federation of
Clinical Neurophysiology, 110(11):1842–57.
Pons, J. L. (2008). Wearable Robots: Biomechatronic Ex-
oskeletons, Chapter 4. John Wiley & Sons.
Rocon, E., Gallego, J. A., Barrios, L., Victoria, A. R.,
Ib
´
anez, J., Farina, D., Negro, F., Dideriksen, J. L.,
Conforto, S., D’Alessio, T., Severini, G., Belda-Lois,
J. M., Popovic, L. Z., Grimaldi, G., Manto, M., and
Pons, J. L. (2010). Multimodal BCI-mediated FES
suppression of pathological tremor. In Annual In-
ternational Conference of the IEEE Engineering in
Medicine and Biology Society. IEEE Engineering in
Medicine and Biology Society. Conference, volume
2010, pages 3337–40.
Tabie, M. and Kirchner, E. A. (2013). EMG onset detec-
tion - comparison of different methods for a move-
ment prediction task based on EMG. In Proceedings
of the International Conference on Bio-inspired Sys-
tems and Signal Processing, pages 242–247.
Tsukahara, A., Hasegawa, Y., and Sankai, Y. (2009).
Standing-up motion support for paraplegic patient
with Robot Suit HAL. 2009 IEEE International Con-
ference on Rehabilitation Robotics, pages 211–217.
PlatformforMultimodalSignalAcquisitionfortheControlofLowerLimbRehabilitationDevices
55
