
The Use and Know-how of ICT-technology in Different Age Groups
Leena Korpinen
1
, Rauno Pääkkönen
2
and Fabriziomaria Gobba
3
1
Environmental Health, Tampere University of Technology, Tampere, Finland
2
Finnish Institute of Occupational Health, Tampere, Finland
3
Department of Public Health Sciences, University of Modena and Reggio Emilia, Modena, Italy
Keywords: ICT, Computers, Age.
Abstract: When developing various ICT solutions to support people’s well-being, the systems are quite often based on
the use of computers or smart phones. However, in different age groups, the skills to use ICT can vary;
therefore, not all people can use new technical systems. The aim of this paper was to investigate the self-
reported use and know-how of the ICT-technology in different age groups and using the answers to the
following questions: ‘how often do you use a desktop computer at leisure?’ and ‘how well do you know the
desktop computer?’. The study was carried out as a cross-sectional study by posting the questionnaire to
15,000 working-age Finns. To the question ‘how well do you know the desktop computer?’, 22% of the 20-
30 age group answered ‘very well’ and 19.1% of the 31-40 age group also replied ‘very well’. In the 41-50
age group, the value was 15.7%, and in the age group 51-60, the value was 10.6%. In the future, when new
well-being ICT technology is developed, it is important to take into account that older people do not know
as much about ICT as younger people.
1 INTRODUCTION
With the advance of well-being ICT technology, a
variety of new devices or internet solutions have
entered the market. The use of computers and other
mobile internet or communication devices has
increased. For example, according to the Finnish
Statistics Office (2008), in 2006, the percentages of
computer users among people aged 18–64 years was
100% in upper-level, white-collar workers and
students. According to the Finnish statistical office
(in spring 2007), 79% of aged 15 to 74 used the
internet. However, only 40% of people over the age
of 60 used the internet.
The Tampere University of Technology (TUT)
has investigated the health effects of new technical
equipment using a questionnaire sent to 15,000
working-age Finns. The questionnaire included
questions on the familiarity and usage of new
technical devices, prevalence of physical and mental
symptoms, accidents associated with mobile phone
use and an open-ended question on health and new
technology (Korpinen et al., 2009).
Our earlier article “Self-reported use of ICT
(Information and communication technology) uptake
in 2002 and discomfort amongst Finns aged 45-66”
presented that less than 30% of Finland’s middle-
aged population use daily desktop computers at
leisure. The use of new technical equipment among
the group of people who are outside working life
was lower than the people’s usage in general (4,9%
of women outside working life and 13.1% of men
outside workig life). (Korpinen and Pääkkönen,
2010).
The amount of daily internet use was 17.5% in
all data of Finns aged 45-66, 4.9% of women outside
working life and 8.0% of men outside working life.
However, 72% of all Finns aged 45-66 used mobile
phones on a daily basis, and 59.4% of female
respondents outside working life and 60.3% of male
respondents outside working life used mobile
phones daily. (Korpinen and Pääkkönen, 2010).
The aim of this paper was to investigate the self-
reported use of the ICT-technology in different age
groups and using the answers to the questions ‘how
often do you use a desktop computer at leisure?’ and
“how well do you know the desktop computer?”. In
addition, some self-reported symptom’s influence on
the answers will be studied.
56
Korpinen L., Pääkkönen R. and Gobba F..
The Use and Know-how of ICT-technology in Different Age Groups.
DOI: 10.5220/0005142200560060
In Proceedings of the 2nd International Congress on Neurotechnology, Electronics and Informatics (NEUROTECHNIX-2014), pages 56-60
ISBN: 978-989-758-056-7
Copyright
c
2014 SCITEPRESS (Science and Technology Publications, Lda.)
2 METHODS
2.1 Study Population and
Questionnaire
The cross-sectional study focused on the working-
age population, and the questionnaire was sent to
15,000 Finns between the ages of 18 and 65. The
names and addresses of the participants were
obtained as a random sample from the Finnish
Population Register Centre. The study design was
approved by the Ethical Committee of Pirkanmaa
Health District, Finland (decision R02099).
The questionnaire included six sections: (1)
background information, such as age, gender,
marital status, education, occupation, and home
county; (2) the familiarity and use of given technical
devices at leisure and at work; (3) physical loading
and ergonomics; (4) psychological welfare; (5)
accidents and close-call situations at leisure or at
work and (6) an open-ended question regarding
‘other observations concerning technology and
health’. The details of the questionnaire have been
published earlier (Korpinen et al., 2009).
2.2 Analyses
The statistical analysis was performed using IBM
SPSS Statistics versions 22 software. Age groups
were classified as under 20, 21–30, 31–40, 41–50,
51–60, and over 60. For the analysis, we took group
2 (21–30), group 3 (31–40), group 4 (41–50), and
group 5 (51–60). We analyzed the answer
percentages to the questions: a) How often do you
use the desktop computer at leisure? (choices: (0)
cannot say, (1) not at all, (2) less than monthly, (3)
monthly, (4) weekly, and (5) daily); b) How well do
you know the desktop computer? (choices: (0)
cannot say, (1) very poorly, (2) pretty poorly, (3)
moderately, (4) pretty well, (5) very well).
The options for question 16) ‘Have you suffered
a) sleeping disorders/disturbances, b) depression,
during the last 12 months?’ was classified so that
answers cannot say, not at all and sometimes were
coded 0 (no symptoms), and quite often, often and
very often were 1 (symptoms).
To compare differences between the age groups
we used independent samples Mann-Whitney U-test
analyses.
3 RESULTS
A total of 6,121 responses (3,486 women and 2,625
men) were received, and the average age of the
respondents was 41 years old. The amount of the
responses to the different age groups were: in the
group 2 (21–30) 1229 answers, in the group 3 (31–
40) 1305 answers, in the group 4 (41–50) 1375
answers and in the group 5 (51–60) 1479 answers.
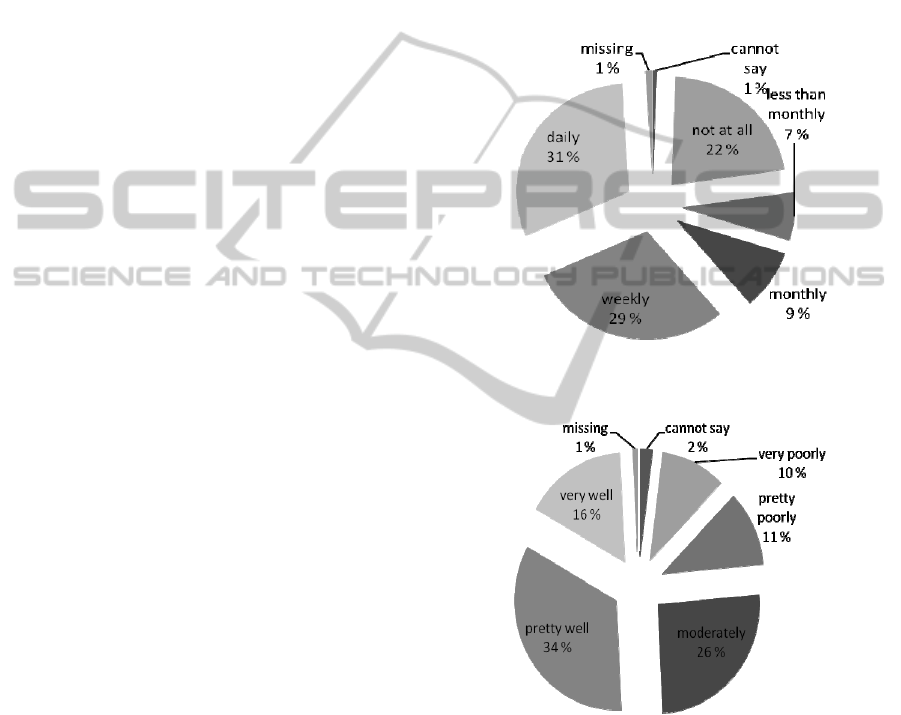
Figure 1 shows the answers of all participants to
the question ‘how often do you use a desktop
computer at leisure?’ and Figure 2 shows the
answers to the question ‘how well do you know the
desktop computer?’
Figure 1: The answers for the question ‘how often do you
use a desktop computer at leisure?’.
Figure 2: The answers for the question ‘how well do you
know the desktop computer?’.
Figure 3 shows results for the question ‘how
well do you know the desktop computer?’ in
different occupational groups.
Figure 3 shows that occupational groups
“homework, students” and “upper-level white collar
workers” know the desktop computers best.
Altogether, 11% of the participants outside working
life know desktop computers very well and 29 % of
them know it pretty well (Figure 4).
TheUseandKnow-howofICT-technologyinDifferentAgeGroups
57
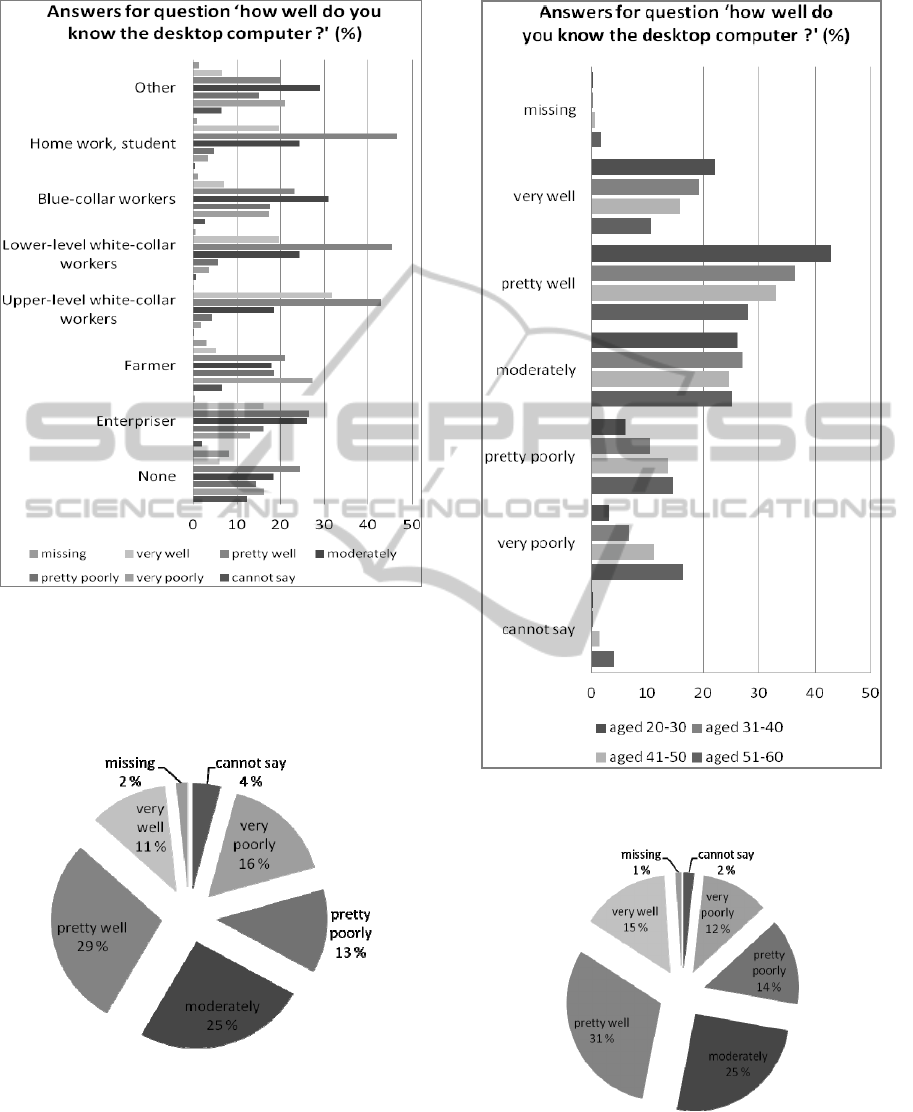
Figure 3: The answers of participants for the question
‘how well do you know the desktop computer?’ in
different occupational groups.
The answers of respondents outside working life.
(Figure 4).
Figure 4: The answers of participants outside working life
for the question ‘how well do you know the desktop
computer?’.
Figure 5 shows the answers to the question ‘how
well do you know the desktop computer?’ in
different age groups.
Figure 5: the answers to the question ‘how well do you
know the desktop computer?’ in different age groups.
Figure 6: the answers of participants who self-reported
sleeping disorders / disturbances to the question ‘how well
do you know the desktop computer?’.
Figures 6 and 7 show the answers of participants
who self-reported sleeping disorders/ disturbances or
NEUROTECHNIX2014-InternationalCongressonNeurotechnology,ElectronicsandInformatics
58
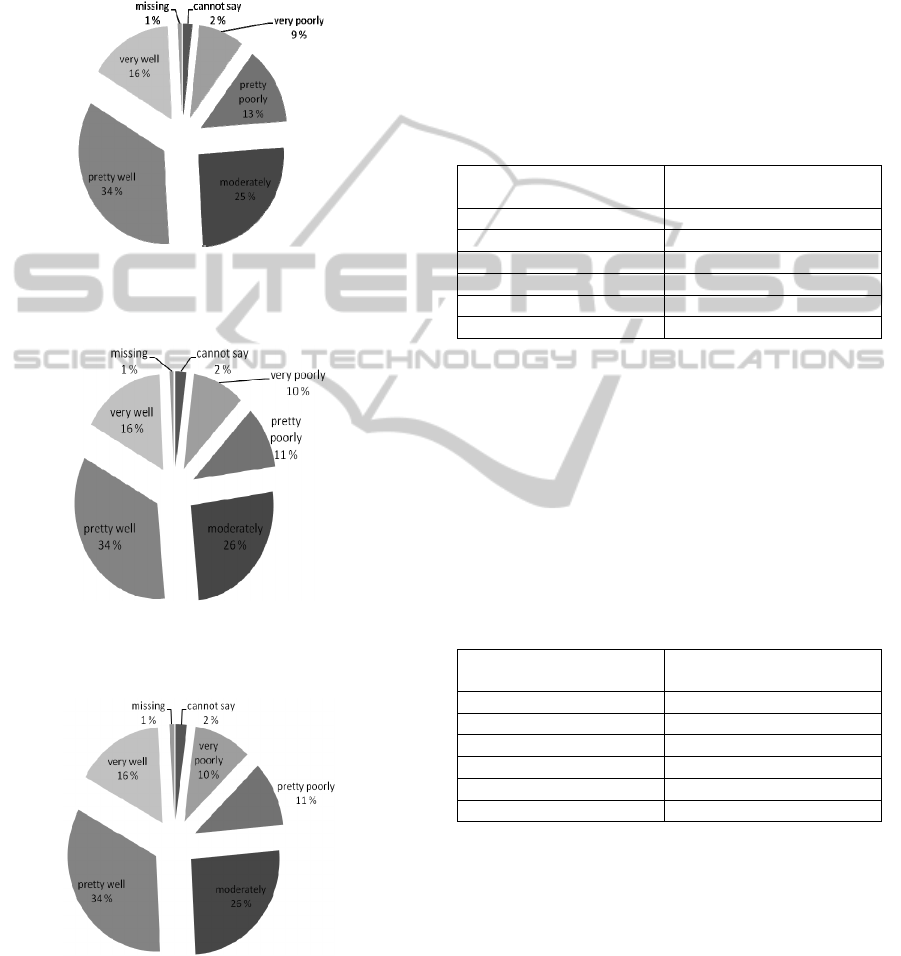
depression, during the last 12 months, to the
question ‘how well do you know the desktop
computer?’ Figures 8 and 9 show the answers of
participants who did not report sleeping disorders /
disturbances or depression, during the last 12
months.
Figure 7: the answers of participants who self-reported
depression to the question ‘how well do you know the
desktop computer?’.
Figure 8: the answers of participants who did not self-
report sleeping disorders / disturbances to the question
‘how well do you know the desktop computer?’.
Figure 9: the answers of participants who did not self-
report depression to the question ‘how well do you know
the desktop computer?’.
To the question ‘how well do you know the
desktop computer?’, 22% of the age group 20-30
answered very well and 19.1% of the 31-40 age
group also answered very well. In the age group 41-
50, the value was 15.7% and in the 51-60 age group,
the value was 10.6%.
Table 1 shows the results of the comparison
between the different age groups using the answers
to the question ‘how often do you use a desktop
computer at leisure?’ (with independent samples
Mann-Whitney U-test analyses).
Table 1: The results of the comparison between the
different age groups using the answer to the question ‘how
often do you use a desktop computer at leisure?’.
Comparison groups with
Mann-Whitney U-test
Asymp. Sig.(2-tailed)
Group 2 – Group 5 <0.001*
Group 3 – Group 5 <0.001*
Group 4 – Group 5 <0.001*
Group 2 – Group 4 <0.001*
Group 2 – Group 3 <0.001*
Group 3 – Group 4 0.060
* significant at p < 0.05
In table 1, there were significant differences
between almost all age groups. Younger persons
used more a computer at leisure than older persons.
Table 2 shows the results of the comparison
between the different age groups using the answer to
the question ‘How well do you know the desktop
computer?’ (with independent samples Mann-
Whitney U-test analyses).
Table 2: The results of the comparison between the
different age groups using the answer to the question
‘How well do you know the desktop computer?’.
Comparison groups with
Mann-Whitney U-test
Asymp. Sig.(2-tailed)
Group 2 – Group 5 <0.001*
Group 3 – Group 5 <0.001*
Group 4 – Group 5 <0.001*
Group 2 – Group 4 <0.001*
Group 2 – Group 3 <0.001*
Group 3 – Group 4 <0.001*
* significant at p < 0.05
In table 2, there were significant differences
between all age groups so that younger persons
know better a computer than older persons.
4 DISCUSSION
In this questionnaire study, the population was
15,000 working-age persons in Finland, and the
amount of responses was 6,121 (41%) (Korpinen et
TheUseandKnow-howofICT-technologyinDifferentAgeGroups
59

al. 2009). The data was quite large. However the
non-response rate was over 50%. The main focuses
of the questionnaire were the use of the new
technical units (e.g., desktop computers, portable
computers, hand-held computers, communicators,
internet, mobile phones, electronic marketplaces/
commerce and teletext) and physical/mental
symptoms. We asked many questions of the
participants’ know-how regarding new technology.
Therefore, we cannot make any strong conclusions
from the data. In addition, this questionnaire data is
about 10 years old, which is a long time in consumer
technology. For example, the use of the internet has
increased in all age groups. However, there can still
be differences between different groups. Typically,
young persons are more active in using new
technology.
In general, about 30% of all participants used
desktop computers daily, and 16% of all know the
desktop computer very well. Figures 3-8 show that
younger persons and persons who typically use
computers at work know desktop computers better
than others. This is easy to understand. However, it
is important to remember, when new well-being
technology or technology as part of treatment will be
developed, that older persons and persons outside of
working life are not always experts in the use of
technology. On the other side, older persons are
typically persons who need medical treatment and
the technology developed for the well-being area.
Figures 6-9 show that persons who self-reported
depression or sleep disorders / disturbances are as
familiar as others with desktop computers and show
in practise no difference. So those symptoms are not
relevant in the development of the new well-being
technology.
5 CONCLUSIONS
The daily use of desktop computers of all
participants was about 30% at leisure in all the data,
and 16% know desktop computers very well. To the
question ‘how well do you know the desktop
computer?’, 22% of the age group 20-30 answered
very well and 19.1% of the age group 31-40 also
answered very well. In age group 41-50, the value
was 15.7%, and in the 51-60 age group, the value
was 10.6%. Altogether, 11% of the participants
outside working life know desktop computers very
well. In the future, it is important to take into
account that older people do not know as much
about ICT as younger people, and it can influence
the use of the new well-being technology.
ACKNOWLEDGEMENTS
The assistance of the staff (Noomi Suuronen, Jari
Latva-Teikari and Riitta Lehtelä) of the
Environmental Health group, Tampere University of
Technology, is gratefully acknowledged.
REFERENCES
Finnish Statistics office, 2008. 2. Still more adult use
computers. (in Finnish) http:// www.stat.fi/til/aku/
2006/03/aku_2006_03_2008-06-03_kat_002_fi.html
[Last updated 3 June 2008]
Finnish Statistics office, 2007. Internet used by 79 per cent
of the population at the beginning of 2007.
http://www.tilastokeskus.fi/til/sutivi/2007/sutivi_2007
_2007-09-28_tie_001_en.html [Last updated 28.
September 2007].
Korpinen, L., Suuronen, N., Latva-Teikari, J., Pääkkönen,
R., 2009. Questionnaire on the health effects of new
technical equipment. International Journal of
Industrial, Ergonomics 39, 105–114.
Korpinen, L., Pääkkönen, R., 2010. Self-reported use of
ICT (Information and communication technology)
uptake in 2002 and discomfort amongst Finns aged
45–66, Applied Ergonomics 42, 85–90.
NEUROTECHNIX2014-InternationalCongressonNeurotechnology,ElectronicsandInformatics
60
