
A Clustering-based Approach for a Finest Biological Model Generation
Describing Visitor Behaviours in a Cultural Heritage Scenario
Salvatore Cuomo
1
, Pasquale De Michele
1
, Giovanni Ponti
2
and Maria Rosaria Posteraro
1
1
Department of Mathematics and Applications, Univeristy of Naples “Federico II”, Naples, Italy
2
UTICT-HPC, ENEA Portici Research Center, Naples, Italy
Keywords:
Computational Neural Models, Clustering, Data Mining, User Profiling.
Abstract:
We propose a biologically inspired mathematical model to simulate the personalized interactions of users with
cultural heritage objects. The main idea is to measure the interests of a spectator w.r.t. an artwork by means of
a model able to describe the behaviour dynamics. In this approach, the user is assimilated to a computational
neuron, and its interests are deduced by counting potential spike trains, generated by external currents. The
main novelty of our approach consists in resorting to clustering task to discover natural groups, which are used
in the next step to verify the neuronal response and to tune the computational model. Preliminary experimental
results, based on a phantom database and obtained from a real world scenario, are shown. To discuss the
obtained results, we report a comparison between the cluster memberships and the spike generation; our
approach resulted to perfectly model cluster assignment and spike emission.
1 INTRODUCTION
In the cultural heritage area, the needs of innovative
tools and methodologies to enhance the quality of ser-
vices and to develop smart applications is an increas-
ing requirement. Cultural heritage systems contain a
huge amount of interrelated data that are more com-
plex to classify and analyze.
For example, in an art exhibition, it is of great in-
terest to characterize, study, and measure the level of
knowledge of a visitor w.r.t. an artwork, and also the
dynamics of social interaction on a relationship net-
work. The study of individual interactions with the
tangible culture (e.g., monuments, works of art, and
artifacts) or with the intangible culture (e.g., tradi-
tions, language, and knowledge) is a very interesting
research field.
To understand and to analyze how artworks in-
fluence the social behaviours are very hard chal-
lenges. Semantic web approaches have been increas-
ingly used to organize different art collections not
only to infer information about an opera, but also
to browse, visualize, and recommend objects across
heterogeneous collections (Middleton et al., 2003).
Other methods are based on statistical analysis of user
datasets in order to identify common paths (i.e., pat-
terns) in the available information. Here, the main
difficulty is the management and the retrieval of large
databases as well as issues of privacy and professional
ethics (Kumar et al., 2010). Finally, models of artifi-
cial neural networks, typical of Artificial Intelligence
field, are adopted. Unfortunately, these approaches
seems to be, in general, too restrictive in describing
complex dynamics of social behaviours and interac-
tions in the cultural heritage framework (Kleinberg,
2008).
In this paper, we are interested in analyzing visitor
behaviours in cultural assets by means of biological
inspired mathematical models (Cuomo et al., 2011;
Cuomo et al., 2013; Bianchi et al., 2014). Here, the
main novelty w.r.t. previously proposed approaches
consists in exploiting unsupervised data groupings to
estimate the values characterizing neuron electrical
properties that allow to model it as a simple electrical
circuit. More specifically, we resorted to a cluster-
ing task to obtain data groups by employing the well-
known K-means algorithm (Jain and Dubes, 1988).
This strategy has the main advantage of producing
data groups (i.e., clusters) that highlight hidden pat-
terns and previously unknown features in the data,
without the need of any class labeling or training set.
In the next phase of our approach, we refer to a
computational neuroscience terminology for which a
cultural asset visitor is a neuron and its interests are
the electrical activity which has been stimulated by
appropriate currents. More specifically, the dynamics
427
Cuomo S., De Michele P., Ponti G. and Posteraro M..
A Clustering-based Approach for a Finest Biological Model Generation Describing Visitor Behaviours in a Cultural Heritage Scenario.
DOI: 10.5220/0005144104270433
In Proceedings of 3rd International Conference on Data Management Technologies and Applications (KomIS-2014), pages 427-433
ISBN: 978-989-758-035-2
Copyright
c
2014 SCITEPRESS (Science and Technology Publications, Lda.)

of the information flows, which are the social knowl-
edge, are characterized by neural interactions in bio-
logical inspired neural networks. Reasoning by sim-
ilarity, the users are the neurons in a network and
its interests are the morphology; the common top-
ics among users are the neuronal synapses; the social
knowledge is the electrical activity in terms of quan-
titative and qualitative neuronal responses (spikes).
This lead to produce a characterization of user be-
haviours in exhibits, starting from a real world sce-
nario.
The work is organized as follows. In Section 2 we
report the mathematical background of the problem.
In Section 3 we discuss a motivation example. The
proposed approach based on clustering and the neuron
modeling are shown in the Section 4. The Section 5 is
devoted to the related works. Finally, the conclusions
are drawn in the Section 6.
2 MATHEMATICAL
BACKGROUND
A mathematical model, corresponding to a particular
physical system S, consists of one or more equations,
whose individual solutions, in response to a given in-
put, represent a good approximation of the variables
that are measured in S. A biological neuron model
consists of a mathematical description of nervous cell
properties, more or less accurate, and allows to de-
scribe and predict certain biological behaviours. A
neuron can be modeled at different levels of com-
plexity: if we consider the propagation effects, then
we have compartmental models defined by means of
Partial Differential Equations (PDEs); if, instead, we
assume that the action potential propagation is al-
most instantaneous if compared to the time scale of
the generation of itself, then we have single compart-
ment models defined by means of Ordinary Differen-
tial Equations (ODEs) and algebraic equations.
The Integrate&Fire (I&F) is a simple ODE model
that considers the neuron as an electrical circuit, in
which only the effects of the membrane capacitance
are evaluated. The circuit is represented by the time
derivative of the capacitance law (Q = CV ), that is
dV
m
dt
+
V
τ
=
I
C
m
V
m
(0) = V
0
if ∃t : V
m
(t) = θ → V
m
(t)
+
= 0
where t
+
= t + ε with ε very small, V
m
is the mem-
brane potential, C
m
is the membrane capacitance, I(t)
is the ionic current of the neuron m, τ = R
m
·C
m
and
R
m
is the resistance. By the previous definition we
have that
C
m
dV
m
dt
= −
V
m
R
m
+ I(t)
The application of an external current in in-
put leads a membrane potential increase, until this
reaches a threshold value: at this point the neuron
emits a spike, after which the potential V
m
returns at
the rest value. The I&F describes simplified biolog-
ical dynamics able to illustrate only some features of
the neuronal activities. Our goal is to apply the dis-
cussed model to a case study of an artwork visitor of
a cultural heritage asset in an exhibit.
3 MOTIVATION EXAMPLE
We start to analyze data collected from a real sce-
nario. In particular, the key point event was an art ex-
hibition within Maschio Angioino Castle, in Naples
(Italy) of sculptures by Francesco Jerace, promoted
by DATABENC (Databenc, 2013), a High Technol-
ogy District for Cultural Heritage management re-
cently founded by Regione Campania (Italy). The
sculptures was located in three rooms and each of
them was equipped with a sensor, able to “talk” with
the users. After the event, the collected data have been
organized in a structured knowledge entity, named
“booklet” (Chianese et al., 2013b). The booklet con-
tents are necessary to feed the artworks fruition and
they require a particular structure to ensure that the
artworks start to talk and interact with the people. The
Listing 1 shows a XML schema diagram of a simpli-
fied model of the booklet entity, characterized by the
attributes of an artwork.
In this paper, we analyze the log file of a phantom
database that was populated with both real and ran-
dom data. It represents the basic knowledge on which
we test the applicability of the proposed biological in-
spired model.
4 THE BIOLOGICAL INSPIRED
MODEL
The I&F model can be adopted to characterize the
user dynamics w.r.t. the interactions with an artwork.
In (Cuomo et al., 2014), this issue has been addressed
by proposing a novel approach to find the I&F dy-
namic correlations with the output of a such well-
known classification method. Data have been ana-
DATA2014-3rdInternationalConferenceonDataManagementTechnologiesandApplications
428

lyzed through a naive Bayesian Classifier, in order to
have a comparison metric.
Listing 1: An example of the structured LOG file.
1 <? xml v e r s i o n = ” 1 . 0 ” e nc o d i n g =”UTF−8” ?>
2 <USER ID= ’ UI001 ’>
3 <STEREOTYPE USER>2< /
STEREOTYPE USER>
4 <START SESSION>< / START SESSION>
5 <END SESSION>< / END SESSION>
6 <TRANSACTION>
7 <REQUEST>
8 <HTTP METHOD>GET< / HTTP METHOD>
9 <PATH INFO> / o p e r a< / PATH INFO>
10 <REQUEST PARAMETERS>
11 <CODEARTWORK>ART0224VICTA</
CODEARTWORK>
12 <DATE>1 3 / 0 5 / 2 0 1 3< / DATE>
13 < / REQUEST PARAMETERS>
14 <REMOTE ADDRESS>1 9 2 . 1 6 8 . 1 . 6</
REMOTE ADDRESS>
15 < / REQUEST>
16 <PARAMETERS LOG>
17 <HOUR LISTEN START>13 / 0 5 / 2 0 1 3
13 : 5 8 : 1 2< / HOUR LISTEN START
>
18 <HOUR LISTEN END> 1 3 / 0 5 / 2 0 1 3 14
: 0 5 : 4 2</ HOUR LISTEN END>
19 <AUDIOS>
20 <TOT NUMBER>3< / TOT NUMBER>
21 <AUDIO ID= ’ AU1111 ’>
22 <HOUR END> 1 3 / 0 5 / 2 0 1 3 14
: 0 0 : 4 2</ HOUR END>
23 <LENGTH>180< / LENGTH>
24 < / AUDIO>
25 < / AUDIOS>
26 <IMAGES>
27 <TOT NUMBER>11< / TOT NUMBER>
28 <IMAGE ID= ’ IM1122 ’ />
29 <IMAGE ID= ’ IM1134 ’ />
30 <IMAGE ID= ’ IM1135 ’ />
31 < / IMAGES>
32 <VIDEOS>
33 <TOT NUMBER>2< / TOT NUMBER>
34 <VIDEO ID= ’ VI3333 ’>
35 <HOUR END> 1 3 / 0 5 / 2 0 1 3 14
: 2 0 : 1 2</ HOUR END>
36 <LENGTH>180< / LENGTH>
37 < / VIDEO>
38 < / VIDEOS>
39 <TEXTS>
40 <TOT NUMBER>4< / TOT NUMBER>
41 <TEXT ID= ’ TX4455 ’ />
42 <TEXT ID= ’ TX4456 ’ />
43 <TEXT ID= ’ TX4457 ’ />
44 <TEXT ID= ’ TX4458 ’ />
45 < / TEXTS>
46 < / PARAMETERS LOG>
47 < / TRANSACTION>
48 < / USER>
In this work, we propose a new strategy to dis-
cover classes in the data which can be used for the
next modeling step, that is the tuning of the elec-
trical parameters for the circuit model characterizing
the neuron. In fact, classification algorithms have the
major limitation of labeling data according to a yet-
known training set, as they are supervised approaches.
In many real world datasets, data objects do not typ-
ically have assigned class membership, and this may
lead to have accuracy issues in the whole classifica-
tion process.
For this reason, we propose to address such an is-
sue by introducing a clustering-based approach (Har-
tigan, 1975; Jain and Dubes, 1988; Kaufman and
Rousseeuw, 1990) to discover data groups. Cluster-
ing is an unsupervised task, since it can be applied to
unclassified data (i.e., unlabeled) to obtain homoge-
neous object groupings. In this approach, groups are
more representative w.r.t. single object as they sum-
marize their common features and/or patterns; indeed,
objects belonging to the same group are quite simi-
lar each other, whereas objects in different groups are
quite dissimilar.
In our context, data to be clustered are tuples rep-
resenting visitor’s behaviours related to an artwork.
Note that now “spike” has a more informative role in
the dataset, as it is not seen as a class but as a fur-
ther information about visitor’s behaviour. In our ex-
periments, we assume the following criteria for spike
generation. A visitor enjoyed an artwork if he benefits
from the whole content of at least one of the available
services, or if he exploits more than the 66% of the
total contents.
This new clustering-based approach allows us to
produce a more general dataset, in which we do not
need to assign object classes, and also attributes can
take values in a continuous range, instead of in a dis-
crete one. Therefore, the clustering phase produces
groups according to visitor’s preferences, which are
not necessary driven by spike generation.
We have organized the log file structure, discussed
in the previous section, in a Weka’s ARFF file for-
mat (Weka) and we have used it as an input of the
clustering task. In the following, we show the ARFF
file suitable for clustering process.
@RELATION ARTWORK
@ATTRIBUTE audios NUMERIC [0..1]
@ATTRIBUTE images NUMERIC [0..1]
@ATTRIBUTE texts NUMERIC [0..1]
@ATTRIBUTE spike {0,1}
@DATA
0.1,0.4,1.0,1
0.3,0.6,0.4,0
...
0.5,1.0,0.7,1
...
In the proposed scheme, data values represent the
amount of information that the visitor has exploited
for an artwork for each attribute of the dataset, and
AClustering-basedApproachforaFinestBiologicalModelGenerationDescribingVisitorBehavioursinaCultural
HeritageScenario
429
the last attribute describes the spike generation ac-
cording to the algorithm previously described. In this
way, combining the values of the attributes audios,
images and texts, it is possible to obtain a total
of N = 1, 331 different data objects (i.e., tuples) —
for simplicity, we take into account just real values
rounded at the first decimal value.
As regards the clustering task, we can employ any
algorithm to discover groups. However, in this paper,
we resorted to the well-known K-means clustering al-
gorithm (Jain and Dubes, 1988). K-means requires
only one parameter, that is the number K of clusters
(i.e., groups) to be discovered. Algorithm 1 shows the
outline of the K-means clustering algorithm.
Algorithm 1: K-means.
Require: a dataset objects D = {o
1
, . . . , o
N
}; the
number of output clusters K
Ensure: a set of clusters C = {C
1
, . . . , C
K
}
1: for i = 1 to K do
2: c
i
←randomInitialize(D)
3: end for
4: repeat
5: for all C
i
∈ C do
6: C
i
←
/
0
7: end for
8: for all o
u
∈ D do
9: j ← argmin
i∈[1..K]
dist(o
u
, c
i
)
10: C
j
← C
j
∪ {o
u
}
11: end for
12: for all C
i
∈ C do
13: c
i
← updateCentroid(C
i
)
14: end for
15: until centroids do not change or a certain termi-
nation criterion is reached
In our experiments, we first started with K = 2,
which is the natural starting choice to model a
classification-like approach (i.e, “spike” or “no-
spike”). Nevertheless, we can also perform further
experiments by setting higher values for K to capture
finest similarities and/or hidden patterns in the data.
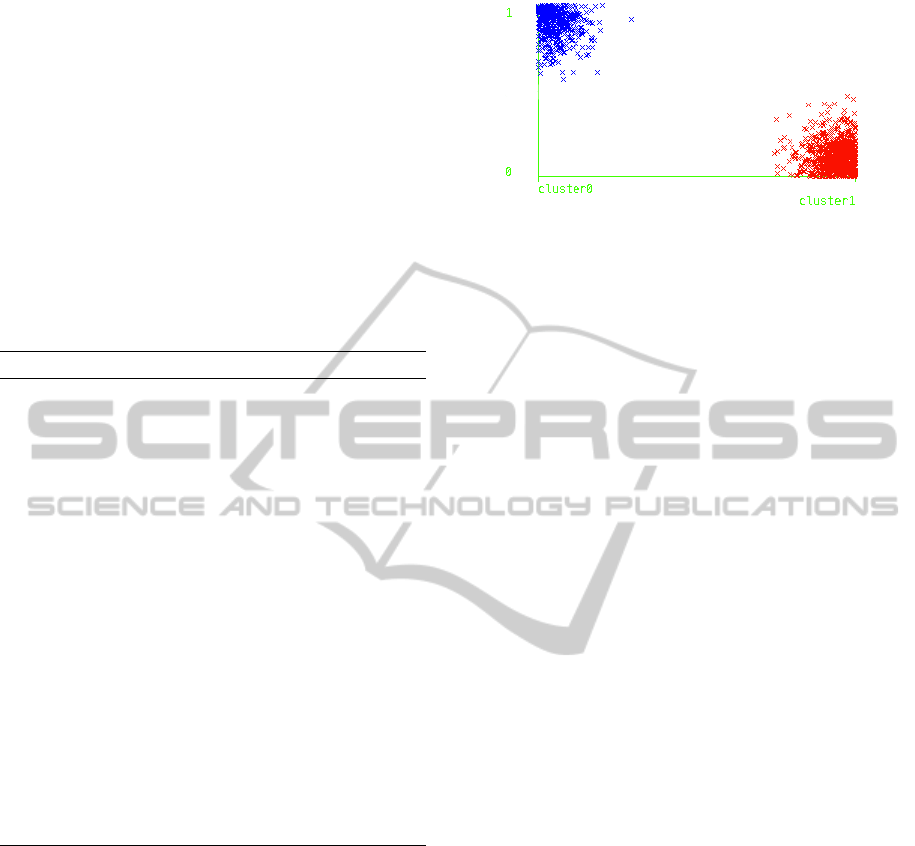
Figure 1 shows the output of the clustering phase
with K = 2. Note that we do not take into account the
“spike” attribute in the clustering process, as it could
clearly bias the entire process. However, we exploited
it at the end of the clustering phase to assess the result
accuracy. We resorted to Weka “simpleKMeans” im-
plementation, and the plot is also obtained employing
Weka clustering visualization facilities.
The plot represents tuples in terms of cluster mem-
bership (x-axis) and spike emission (y-axis). It is easy
to note that all the data in cluster0 refer to tuples that
Figure 1: Clustering results for K-means (K = 2).
produce spikes (i.e., with value 1), whereas all the
ones in cluster1 identify tuples that do not emit spike
(i.e., with value 0). Therefore, evaluating clustering
results in terms of well-separation of the data w.r.t. the
spike emission issue, we achieved a high-quality clus-
tering as all the data have been correctly separated.
Starting from the clustering output, in a second
approach, we have integrated the I&F computational
model in order to find some correlations with the clus-
tering results. In particular, the couple (R
m
, C
m
) rep-
resents the visitor sensitivity to the artwork. We have
exploited the clustering results in order to tune the val-
ues of the resistance R
m
and conductance C
m
of the
circuit that represents the model. In a first experiment,
a good choice for the couple (R
m
, C
m
) is
(R
m
, C
m
) = (0.51kOhm, 30µF)
The current is a linear combination of the values
of the attributes in the dataset. The Figure 2 gives the
dynamic response of the neuron.
In the first case (top of the Figure 2) the current
I(t) is not sufficient to trigger a potential difference
which gives a spike. In the second one (bottom of the
Figure 2) the neuron that has received stimuli is able
to produce an interesting dynamic.
In these experiments, we show how the compu-
tational model and the clustering give information
about the interest of a visitor about an artwork. In the
Table 1, experimental results for the clustering and
our model are reported. M.C.F. represents the Me-
dia Content Fruition w.r.t. the overall media contents.
With the symbol (*) we have labeled the tuple com-
binations that contain the information about the fully
fruition of at least one media content. Note that the
last column of the table indicates the degree of the
visitor interest for an artwork. Thus, in this respect,
such an information is obtained by the proposed I&F
neuron model to achieve a fine-grained indication for
spikes.
Let us suppose that we have two users with dif-
ferent sensitivity (R
m
, C
m
) respect to a fixed artwork.
The question is how is the behaviour of the users in
presence of the same combination of stimuli repre-
DATA2014-3rdInternationalConferenceonDataManagementTechnologiesandApplications
430

Figure 2: Top. With a current I(t) = 0.6 + 0.6 + 0.7, we
observe no spike presence. Bottom With a current I(t) =
0.6 + 0.8 + 0.8 we observe 4 spikes.
Table 1: Spike response for clustering and I&F neuron with
(R
m
, C
M
) = (0.51kOhm, 30µF).
Tuples M.C.F. (%) Cluster # spikes
0.2, 0.2, 0.2 20% cluster1 0
0.2, 0.2, 0.4 27% cluster1 0
0.4, 0.2, 0.2 27% cluster1 0
0.6, 0.6, 0.7 63% cluster1 0
0.6, 0.8, 0.8 73% cluster0 4
0.7, 0.9, 0.5 70% cluster0 4
0.8, 0.9, 0.3 67% cluster0 2
0.8, 0.9, 0.6 76% cluster0 5
1.0, 0.2, 0.1 43%
(∗)
cluster0 5
1.0, 0.8, 0.9 90%
(∗)
cluster0 10
1.0, 1.0, 0.6 86%
(∗)
cluster0 13
1.0, 1.0, 1.0 100%
(∗)
cluster0 16
sented by tuple interest values? The clustering-based
model can not answer to this question in a simple
way. In fact, taking into account only K = 2 clusters,
we just distinguish between two behaviours, that are
“spike” and “no-spike”. For this reason, here we high-
light the feature of I&F model to address the problem.
In the Figure 3, we have fixed
I(t) = 0.8 + 0.9 + 0.3
as a stimulus and we have compared two users U
1
Figure 3: Top. With the couple (R
m
, C
m
) = (0.51, 30) the
neuron has 2 spikes. Bottom With the couple (R
m
, C
m
) =
(0.6, 28) the neuron has 5 spikes.
with (R
m
, C
m
) = (0.51, 30) and U
2
with (R
m
, C
m
) =
(0.6, 28).
We can observe the different number of spikes be-
tween U
1
and U
2
respect to the same artwork. If the
spike are related to the the interests that a cultural as-
set has aroused in a viewer, the I&F is able to emerge
this features. The choice of the pair (R
m
, C
m
) suit-
able for a established user is the real challenge of
the model. More in general, it may be multiple sce-
narios to apply these dynamics. An example is the
case of a cultural asset exhibition in which the tar-
get is how to place artworks. A possible choice is to
select the operas that have attracted the visitors with
common interests, i.e., users with similar (R
m
, C
m
). In
the context-aware profiling instead the aim is how to
change (R
m
, C
m
) in such a way to predict the user be-
haviours in terms of spikes that represent its cultural
assets.
5 RELATED WORK
The studying of efficient methods for learning and
classifying the user behaviours and dynamics in the
real or digital life is a very large and fascinating
research area. The challenge is to have automatic
frameworks based on sensor networks, semantic web
AClustering-basedApproachforaFinestBiologicalModelGenerationDescribingVisitorBehavioursinaCultural
HeritageScenario
431

models, reputation systems and classifiers able to map
human activity and social user interactions. More
in details a smart system should be have the ability
to automatically infer interests of users and track the
propagation of the information. For real life applica-
tions, in (Amato et al., 2013; Chianese et al., 2013a) a
wireless sensor network, using bluetooth technology,
able to sense the surrounding area for detecting user
devices’ presence in a museum is discussed. About
the digital user behaviours a study of the relevance
of feedbacks, typically adopted for the profiling dur-
ing long-term modeling is given in (Kelly and Tee-
van, 2003). In (Widyantoro et al., 2001) an algo-
rithm based on the descriptors representation is de-
veloped to acquire high accuracy of recognition for
long-term interests, and to adapt quickly to changing
interests in the learning user activity. Other method-
ologies using computational approaches are based on
machine-learning (Domingos, 2012). Here, the focus
is to estimate the dynamics of the users’ group mem-
bership and to characterize the social relationships by
means of behaviour patterns with statistical learning
methods. In (Pentland, 2007), using the users data
to model an individual behaviour as a stochastic pro-
cess, the authors show a framework that predicts the
future activity, obtained by modeling the interactions
between individual processes. Ontological method-
ologies for user profiling in recommender systems
are described in (Middleton et al., 2003). Finally, a
multimedia recommender system based on the social
choice problem has been recently proposed in (Al-
banese et al., 2013).
6 CONCLUSIONS
In this paper, we describe a framework that is closed
to the computational methodology, adopted to infer
information about visitors in a cultural heritage con-
text. The challenge is to map, in a realistic way, the
biological morphology of a neuron in this application
scenario. We deal with a model where the (R
m
, C
m
)
couple represents the sensitivity of the user respect to
an artwork. The main novelty of our work has been to
employ a clustering algorithm methodology to obtain
starting groups from which these electrical parame-
ters can be tuned.
A very nice issue is to adapt, in a smart way, this
computational framework to many different applica-
tion issues such as the context-aware profiling, feed-
back based system or recommendation systems. In
future research lines, we will study more complex
neuronal dynamics by morphology point of view with
the aim to develop models that are more close to the
real users. Other research tracks will be the build-
ing of computational neural networks able to repro-
duce the interactions in social cultural heritage net-
works. In addition, regarding the preliminary cluster-
ing phase, we will tune our model with more than two
clusters, with the aim of obtaining fine-grainer clus-
tering solutions that are able to capture and to high-
light other neuron aspects, apart from spike genera-
tion.
ACKNOWLEDGEMENTS
Authors thank DATABENC, a High Technology Dis-
trict for Cultural Heritage management of Regione
Campania (Italy), and ENEA Portici Research Center,
UTICT-HPC Department, for supporting the paper.
REFERENCES
Albanese, M., d’Acierno, A., Moscato, V., Persia, F., Pi-
cariello, A.: A Multimedia Recommender System.
ACM Trans. Internet Technol. (2013) 13(1) 3:1–3:32.
Amato, F., Chianese, A., Mazzeo, A., Moscato, V., Pi-
cariello, A., Piccialli, F.: The Talking Museum
Project. Procedia Computer Science. (2013) 21(0)
114–121.
Bianchi, D., De Michele, P., Marchetti, C., Tirozzi, B.,
Cuomo, S., Marie, H., Migliore, M.: Effects of in-
creasing CREB-dependent transcription on the stor-
age and recall processes in a hippocampal CA1 mi-
crocircuit. HIPPOCAMPUS. 24(2) (2014) 165–177.
Chianese, A., Marulli, F., Moscato, V., Piccialli, F.:
SmARTweet: A location-based smart application for
exhibits and museums. Proceedings - 2013 Interna-
tional Conference on Signal-Image Technology and
Internet-Based Systems, SITIS 2013. (2013) 408–415.
Chianese, A., Marulli, F., Piccialli, F., Valente, I.: A novel
challenge into multimedia cultural heritage: An inte-
grated approach to support cultural information en-
richment. Proceedings - 2013 International Confer-
ence on Signal-Image Technology and Internet-Based
Systems, SITIS 2013. (2013) 217–224.
Cuomo, S., De Michele, P., Chinnici, M.: Parallel tools and
techniques for biological cells modelling. Buletinul
Institutului Politehnic DIN IASI, Automatic Control
and Computer Science Section. LXI (2011) 61–75.
Cuomo, S., De Michele, P., Piccialli, F.: A performance
evaluation of a parallel biological network microcir-
cuit in neuron. International Journal of Distributed &
Parallel Systems. 4(1) (2013) 15–31.
Cuomo, S., De Michele, P., Posteraro, M. (2014): A biolog-
ically inspired model for describing the user behaviors
in a Cultural Heritage environment. SEBD2014, 22nd
Italian Symposium on Advanced Database Systems,
June 16th - June 18th 2014, Sorrento Coast.
DATA2014-3rdInternationalConferenceonDataManagementTechnologiesandApplications
432

DATABENC, High Technology District for Cultural Her-
itage, http://www.databenc.it
Domingos, P.: A Few Useful Things to Know About Ma-
chine Learning. Commun. ACM. 55(10) (2012) 78–
87.
Hartigan, J. A.: Clustering Algorithms. Applied Statistics.
John Wiley & Sons, 1975.
Jain, A. K., and Dubes R. C.. Algorithms for Clustering
Data. Prentice-Hall, 1988.
Kaufman, L., and Rousseeuw, P. J.: Finding Groups in
Data: An Introduction to Cluster Analysis. John Wi-
ley & Sons, 1990.
Kelly, D., Teevan, J.: Implicit feedback for inferring
user preference: a bibliography. SIGIR Forum. 37(2)
(2003) 18–28.
Kleinberg, J.: The convergence of social and technological
networks. Commun. ACM 51, 11, 2008 66–72.
Kumar, R., Novak, J., Tomkins, A.: Structure and Evolution
of Online Social Network. Link Mining: Models, Al-
gorithms, and Applications J. Am. Soc. Inf. Sci. Tech-
nol. 978-1-4419-6515-8 (2010) 337–357.
Middleton, S. E., Shadbolt, N. R., De Roure, D. C.: Cap-
turing Interest Through Inference and Visualization:
Ontological User Profiling in Recommender Systems.
Proceedings of the 2Nd International Conference on
Knowledge Capture. (2003) 1-58113-583-1 62–69.
Pentland, A. S.: Automatic mapping and modeling of hu-
man networks. Physica A. (2007) 378(1) 59–67.
Roderick J. A. Little, Donald B. Rubin : Statistical Analysis
with Missing Data. Wiley Editor. 978-0-471-18386-0
(2002).
Weka, Data Mining Software in Java,
http://www.cs.waikato.ac.nz/ml/weka/
Widyantoro, D. H., Ioerger, T. R., Yen, J.: Learning User In-
terest Dynamics with a Three-descriptor Representa-
tion. J. Am. Soc. Inf. Sci. Technol. 52(3) (2001) 212–
225.
AClustering-basedApproachforaFinestBiologicalModelGenerationDescribingVisitorBehavioursinaCultural
HeritageScenario
433
