
A Wearable Inertial Sensor Unit for Jump Diagnosis
in Multiple Athletes
Marcus Schmidt
1
, Thomas Jaitner
1
, Kevin Nolte
1
, Carl Rheinländer
2
,
Sebastian Wille
2
and Norbert Wehn
2
1
Institute of Sports and Sports Science, TU Dortmund University, Otto-Hahn-Straße 3, Dortmund, Germany
2
Microelectronic Systems Design Research Group, University of Kaiserslautern, Kaiserslautern, Germany
1 OBJECTIVES
Flight and stance duration during jumping represent
basic and very useful information for track and field
coaches, and empirical evidence has been given that
these parameters correlate strongly with elite
performance (Hunter, 2004; Li et al. 2010; Slawinski
et al. 2010). In highly dynamical sports such as track
and field, athletes must be able to generate high
forces within a very short time and in an appropriate
manner. Consequently, reactive strength training
including multiple jumps or drop jumps from
different heights is very important for such athletes
(Kale et al., 2009, Markovic et al., 2007). Objective
feedback on performance is crucial to ensure a high
quality of such a training as intrinsic information is
merely available to the athlete due to the high
movement velocities. From a trainer’s perspective,
on the other hand, the quality of performance cannot
be assessed precisely enough by pure observation.
For the diagnosis of jumping performance in
field-based conditions, several devices have been
established in the last years. Contact mats or opto-
electrical systems like Optojump® allow a precise
and unobtrusive measureing of temporal parameters,
but limitations must be stated according the
operational area as well as group or ubiquitous
monitoring. More recently, the availability of
miniature solid-state inertial measurement units
(IMUs) offers large opportunities to overcome these
restrictions, and therefore open a new perspective
for in-field diagnosis. Combined with wireless data
transmission, IMUs can be used to provide athletes
and coaches with fast and accurate performance
measurements to improve athletic development and
elite performance. Additionally, IMUs merely affect
athletes during performance due to their small size
and weight.
IMUs have already been used to detect kinematic
parameters in track and field applications. High
correlations could be shown between IMUs and
reference measurements (force platforms and
optometric systems) for flight time and jump height
during counter-movement-jumps (Picerno et al.
2011; r=.87) and for reactive strength index during
drop jumps (Patterson and Caulfield, 2010; r=.98).
Reactive strength index, for example, can be used
for several purposes for the optimization of
plyometric training or for injury prevention (Mc
Clymont, 2003). It has also been applied as a tool to
judge athletes’ recovery state (Horita et al. 1999;
Toumi et al. 2006).
Bergamini et al. (2012) reported mean
differences of .005 seconds between IMU and high-
frequency video or dynamometry for stance and
stride durations during sprinting. Lower correlations
between force and acceleration peaks for drop jumps
(r=.70) and countermovement jumps (r=.55-59)
were found if only a three-axis accelerometer data
were considered (Tran et al. 2010).
The aim of the recent study was the development
and validation of an inertial sensor based device for
detecting explosive jump events in elite athletes.
Additionally, an ubiquitous group monitoring should
be supported to use the device during training
sessions with multiple athletes.
2 METHODS
2.1 System Design
A flexible wearable inertial sensor unit was
developed, that should support easy adaptation to
different diagnosis scenarios without changing the
hardware. Main requirement were a high data
resolution and accuracy, a direct connection to smart
phones/tablets without additional hardware, a
logging of raw data as well as compactness, little
weight, easy usability and long battery lifetime.
To connect the sensor unit with mobile devices, a
Bluetooth Low Energy (BLE) connection was
216
Schmidt M., Jaitner T., Nolte K., Rheinländer C., Wille S. and Wehn N..
A Wearable Inertial Sensor Unit for Jump Diagnosis in Multiple Athletes.
DOI: 10.5220/0005145902160220
In Proceedings of the 2nd International Congress on Sports Sciences Research and Technology Support (icSPORTS-2014), pages 216-220
ISBN: 978-989-758-057-4
Copyright
c
2014 SCITEPRESS (Science and Technology Publications, Lda.)
chosen. It allows ranges in free field up to 30m. In
comparison to classic Bluetooth or WiFi, BLE can
save up to 100x more energy. A drawback is smaller
amount of data that can be transferred in time. This
is compensated by an on-board processing. All
sensor values are direct handled by the MCU. Only
the results (e.g. stance duration) are sent.
Additionally, all raw data is saved on an internal
microSD card for later PC analysis. Via microUSB
data can be read out and battery recharged.
To ensure an easy usage of the system, an
Android App was developed. It connects to the
sensor units of the athletes automatically. A sensor
unit itself wakes up itself, so that no switch is
needed. As soon as for example a jump was
detected, the data is processed by the MCU, sent via
BLE to the App and the results are displayed there
(see Figure 1). Trainers can select one or more
sensor units in parallel to monitor different athletics
at the same time.
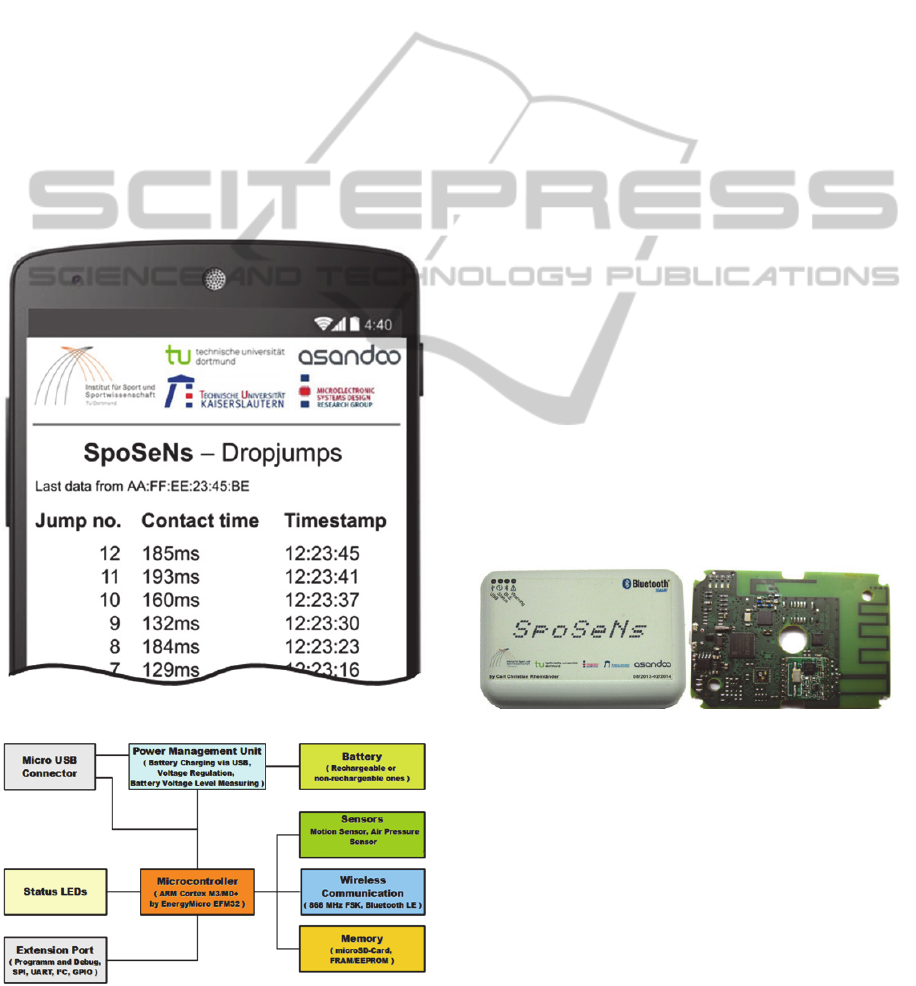
Figure 1: Screenshot of Android App.
Figure 2: Sensor unit hardware overview.
Be capable of using the system for future scenarios,
a platform-based approach was chosen. A board
including MCU, sensors, wireless communication,
memory, power management unit, and extension
port was developed. Depending on the scenario, it
can be equipped with the components needed for it.
For on-board processing of data and system
management the world most energy efficient ARM
Cortex M3 processor Giant Gecko from Silicon Labs
was chosen (48MHZ, 1MB Flash, 128KB RAM).
Two sensors can be used: the IMU MPU-9150
from InvenSense combines a 3-axis accelerometer
(up to 1 kHz and +/-16g), 3-axis gyroscope (up to 1
kHz and 1000 deg./s.) and 3-axis magnet field
(about 100Hz) sensor in one chip. Additionally in
the future, an air pressure sensor can be mounted
capable measuring height differences up to 10cm.
For BLE communication, the Nordic nRF8001 is
used (up to 30m free field). An own antenna was
designed for optimal electromagnetic radiation. A
second radio working in sub-GHz band can be used
for future scenarios to enhance range (up to 200m
free field).
An internal microSD card can save data up to
4GB.
The power management unit handles different
power sources (normal battery, rechargeable battery,
USB power) and recharges batteries. Batteries last
for several hours.
An extension port can be used for future add-ons
like new sensors. Figure 2
Figure 2: Sensor unit
hardware overview
gives an overview.
Overall size of the unit is 80x56x24mm³ (see
Figure 3).
Figure 3: Sensor unit (left) and board (right).
For fast software development and fast testing of
new algorithms a software framework following a
layered approach was created. Each layer abstracts
from the layer below. Accordingly, parts or layers of
the software can be changed easily without
modifying any other component. For example,
sensors can be changed or added without touching
the other parts of the software. Basic tasks like
initializing the MCU or the basic operating system
are abstracted from the application itself (see also
Figure 4).
AWearableInertialSensorUnitforJumpDiagnosisinMultipleAthletes
217
The lowest layer connects to the hardware
interfaces. The “device drivers” layer handles all
low level hardware like wireless radios or getting
sensor data. The layer “user libraries” provides basic
functionalities to the application. The “Task
manager” for example allow parallelization of jobs
like getting sensor data, saving it in raw format,
processing it, and sending it via BLE. The “BLE”
module abstracts from the BLE hardware and
provides for example easy access for sending
“advertisement data”, which can be read be the App.
The “Motion” module does pre-processing of the
IMU data and provides the information to the next
layer.
In “user program” the main part of the
application is written (here “Dropjump”). It utilizes
and combines functionalities of the lower layers
without interfering with the layer itself. All modules
are compiled and linked together to get at the end
the final software for the sensor unit. This way, new
applications can be developed in short time and parts
of the hardware can be extended or replaced,
respectively.
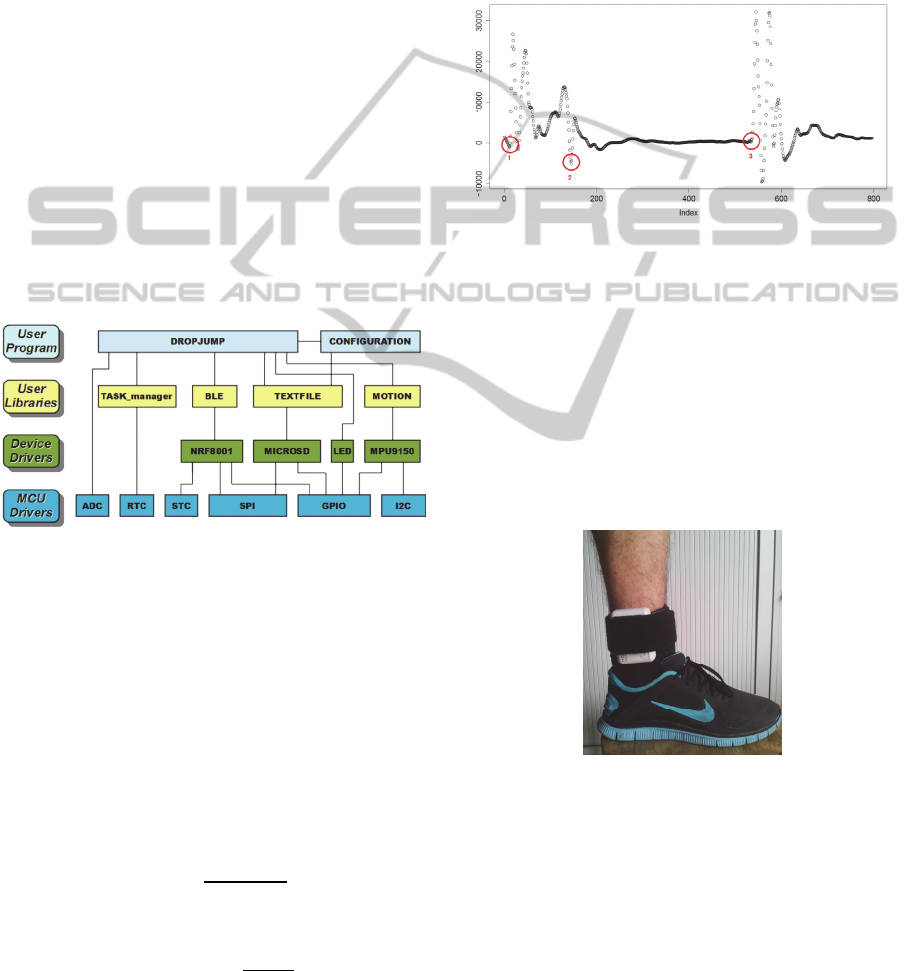
Figure 4: Sensor unit software overview.
2.2 Evaluation Study
The purpose of the evaluation study was first to
identify recognizable features in the data signals
supplied by the IMU for the estimation of stance (t
S
)
and flight duration (t
F
) as well as jump height (H)
and reactive strength index (RI). Stance duration
was determined by the first (landing) and last
(takeoff) ground contact of the feet. Flight time was
calculated from the take-off and the subsequent
landing. Jump height was derived by the following
equation:
(1)
Reactive strength index was calculated as shown
in equation 2.
RI
(2)
Landing and take off were estimated from the
acceleration in vertical direction. Accelerometer data
were first filtered by a fifth order moving average
filter. Landing was then defined as the beginning of
at least five consecutive data values including a
gradient larger then 400. With a delay of 90ms,
beginning at landing, a local minimum in the range
of 240ms is defined as takeoff. Figure 5 indicates
exemplarily acceleration data including first landing
(1), take off (2) and second landing after the jump
(3). All data processing was performed on-board.
Figure 5: Filtered accelerometer data from a drop jump off
of a box raised 31.5cm. The red points show the beginning
of ground contact (1), the local minimum detected at take
off (2) and the beginning of ground contact when landing
after the jump (3).
Because of delays in onboard data processing
when detecting a jump event, t
F
was calculated by
adding a correction factor of 20ms to the original
value.
The IMU device was mounted close to the ankle
as shown in Figure 6 with its x-Axis pointing
vertically upwards.
Figure 6: IMU Device mounted close to the ankle.
To evaluate accuracy of event detection the
provided information were compared with force
platform data (AMTI BP 600400) sampled at
1000Hz. The validation study included ten
participants (7 track and field athletes, 3 basketball
players). Mean age was 25.1 years with standard
deviation (SD) 3.45 years. Participants had a mean
height of 186.3 cm, SD= 10.4 cm and a mean weight
of 77.3 kg, SD= 12.45 kg. 3 were female and 7 were
male. Overall, each participant performed 15 drop
icSPORTS2014-InternationalCongressonSportSciencesResearchandTechnologySupport
218

jumps. A testing session consisted of 5 drop jumps
from three different heights (31.5cm, 40cm and
50cm). Subjects stepped off of the box and
performed their drop jump with each foot landing on
the force platform. After each jump participants had
a rest time of two minutes.
Statistical analysis was performed using R
(Project for Statistical Computing). Bland-Altman
plots for multiple observations per individual (Bland
and Altmann 2007) of t
S
, t
F
, and RI were computed
to assess the agreement between the developed
device and force platform data. H was not included
for the statistical analysis as no additional
information was expected due to the its computation
(see equitation 1)
3 RESULTS
Overall, 141 out of 150 jumps were detected
correctly which corresponds with a detection rate of
94 %. For t
s
and t
F
minimal differences of 0ms could
be detected. After calculating H and RI, observations
without differences between IMU and force platform
occurred as well. A descriptive overview of the
results of the evaluation study is given in table 1.
The 95% Level of Agreement (LOA) ranges
from 9.82 to -8.13 ms for t
S
; 15.02 to -11.40 ms for
Table 1: Descriptive overview for parameters t
S
, t
F
, H and
RI. “mean diff” represents the mean difference between
the device and force platform, “sd” its standard deviation,
“min” represents the minimal occurred and “max” the
maximal occurred difference during all correct detected
jumps.
N mean diff sd min max
t
S
141 3.40 ms +/- 2.97 ms 0 ms 14 ms
t
F
141 4.87 ms +/- 3,85 ms 0 ms 22 ms
H 138 0.59 cm +/- 0,47 cm 0 cm 2,4 cm
RI 138 0.06 +/- 0,05 0,00 0,22
Figure 7: Bland- Altmann plot comparing t
S
determined by
IMU and force platform data. The slight lines show the
95% confidence interval.
t
F
and 0.16 to -0.16 for RI. Figure 7 shows the
difference in measures plotted against the mean of
both measures on each trial for t
S
.
4 DISCUSSION
The results indicate the developed device as a
suitable tool for detecting selected parameters in a
field based diagnostic. A group and ubiquitous
monitoring is supported by the developed system.
Multiple athletes can be assessed for diagnostics in
the Android App by wearing the IMU.
However, the Bland-Altman results, specifically
the confidence interval calculations, highlight some
potentially important discrepancies between the
force platform and accelerometer values. It is
notable that our results and algorithm are only based
on the accelerometer data, but nevertheless are
comparable to results reported by Bergamini et al.
(2012) and Patterson and Caulfield (2010). It is
noteworthy, that the results include one participant
with “bad” detections, which seems to be caused by
technical difficulties in performing the Drop Jumps.
Without this single participant mean differences for
t
S
between IMU and force platform decrease to
2.87ms and the 95% LOA to 7.48 to -7.31ms. The
recent algorithm yields the advantage of less
processing power to facilitate on-board processing
and fast data broadcasting via Bluetooth low-energy.
Further research will focus on the optimization of
the algorithms. Promising approaches might be the
use of gyroscope data supplemental as well as
Kalman Filtering for data processing.
The developed IMU device promises an
optimization of plyometric training or even
technique training in jumping events by objective
feedback of crucial performance parameters.
Monitoring fatigue in repeated jumping or 400m
sprinting, as example, might also be an interesting
area of application.
Therefore, further research aims to develop an
algorithm to detect parameters like stance and flight
durations or step lengths and frequencies in sprinting
with a satisfying accuracy.
The continuous monitoring of multiple
movements will also allow analyzing movement
variability as a feature of expertise. Former studies
in badminton showed that expertised athletes not
tend to show higher manifestatitons of performance
parameters but stable results in repeated executions
(Jaitner and Gawin, 2010). Regarding stability and
variabilty of chronometrical influencing variables
only less empirical evidence is given for elite sports
AWearableInertialSensorUnitforJumpDiagnosisinMultipleAthletes
219

in track and field. To investigate this is a main aim
of further research for example in hurdling.
The use of the developed device in field based
studies will probably result in a deeper
understanding of how to design training programs to
optimize explosive performance like jumping and
sprinting in elite track and field athletes.
ACKNOWLEDGEMENTS
This work was founded by the Federal Institute for
Sport Science (BISp) under grant IIA1-071503/13
and by the “Landesschwerpunkt” amsys of the state
Rhineland-Palatinate.
REFERENCES
Bergamini, E., Picerno, P., Pillet, H., Natta, F., Thoreux,
P., Camomilla, V. (2012). Estimation of temporal
parameters during sprint running using a trunk-
mounted inertial measurement unit. Journal of
Biomechanics, 45(6), 1123-1126.
Bland, J.M., Altman, D.G., 2007. Agreement between
methods of measurement with multiple observations
per individual. Journal of Biopharmaceutical
Statistics, 17 (4), 571–582.
Horita, T., Komi, P. V., Nicol, C., and Kyrolainen, H.
(1999). Effect of exhausting stretch-shortening cycle
exercise on the time course of mechanical behaviour in
the drop jump: possible role of muscle damage. Eur J
Appl Physiol Occup Physiol, 79(2), 160-167.
Hunter, J.P., Marshall, R.N. and McNair, P.J. (2004).
Interaction of Step Length and Step Rate during Sprint
Running. Medicine and Science in Sports and
Exercise, 36, 2 261-271.
Jaitner, T. and Gawin, W. (2010). A Mobile Measure
Device for the Analysis of highly dynamic Movement
Techniques. Procedia Engineering, 2 (2), 2005-2010.
Kale, M., Asci, A., Bayrak, C. and Acikada, C. (2009).
Relationships among jumping performances and sprint
parameters during maximun speed phase in sprinter.
Journal of Strength and Conditioning Research 23 (8).
2272-2279.
Li, X., Zhou, J., Li, N. and Wang, J. (2011). Comparative
biomechanics analysis of hurdle clearance techniques.
Portuguese Journal of Sport Sciences, 11, 2, 307-309.
Markovic, G., Jukic, I., Milanovic, D. and Metkos, D.
(2007). Effects of sprint and plyometric training on
muscle function and athletic performance. Journal of
Strength and Conditioning Research, 21 (2), 543-549.
McClymont, D. (2003). Use of the Reactive Strength
Index (RSI) as an Indicator of Plyometric Training
Conditions. Proceedings of the Fifth World Congress
on Science and Football (2003). 623-632.
Patterson, M. and Caulfield, B. (2010). A method for
monitoring reactive strength index. Procedia
Engineering, 2 (2), 3115-3120.
Picerno, P., Camomilla, V. and Capranica, L (2011).
Countermoveent jump performance assessment using
a wearable 3D inertial measurement unit. Journal of
Sports Sciences, 29 (2), 139-146.
Slawinski, J., Bonnefoy, A., Leveque, J.-M., Ontanon, G.,
Riquet, A., Dumas, R. and Cheze, L. (2010).
Kinematic an kinetic comparisons of elite an well-
trained sprinters during sprint start. Journal of
Strength and Conditioning Research, 24, 4, 896-905.
Toumi, H., Poumarat, G., Best, T. M., Martin, A.,
Fairclough, J., and Benjamin, M. (2006). Fatigue and
muscle-tendon stiffness after stretch-shortening cycle
and isometric exercise. Appl Physiol Nutr Metab,
31(5), 565-572.
Tran, J., Netto, K., Aisbett, B., and Gastin, P. (2010).
Validation of accelerometer data for measuring
impacts during jumping and landing tasks.
Proceedings of the 28th International Conference on
Biomechanics in Sports (2010) (pp. 1-4).
icSPORTS2014-InternationalCongressonSportSciencesResearchandTechnologySupport
220
