
“No More Spray and Pray Audience Targeting in Mobile World”
IAB based Classification Approach for Mobile App Audience Measurement
Kajanan Sangaralingam
Department of Information Systems, School of Computing, National University of Singapore, 13 Computing Drive,
Group Digital Life, Singapore Telecommunications, Singapore, Singapore
1 STAGE OF THE RESEARCH
The specific problem this research addresses is how
programmatic media buying (IAB 2013; Ebbert
2012) could help in designing effective mobile app
advertisement campaigns. In particular, it is
proposed that ad campaigns which target the mobile
users via mobile applications would be more
effective when there is a way to determine the
audience information of mobile apps from which
mobile ad requests are generated. In order to solve
this dilemma, in this research it is proposed a
dynamic approach which can effectively measure
the audience demographics for the millions of
existing mobile applications as well as the new
incoming applications. There are mainly four steps
involved with this research. First step is to generate
top n categories for a given app A and estimate the
set of app audience demographic properties (Age,
Education & Has Children) based on the “category
– audience demographic” mapping. In the second
step it has been proposed a way to predict the
gender demographics of mobile app users. In the
third step, accuracy of predicted audience
demographic values is evaluated. In the fourth step
efficacy of using audience demographics data on a
real mobile app ad-campaign will be evaluated.
This research has progressed till step 3 and step 4 is
remaining.
Preliminary experiment of the proposed
approach yielded satisfactory results.
Since most of
the ad-requests do not contain relevant audience
information, proposed approach can be used to plug
this data as a third party platform to the ad-requests.
Given the popularity and usefulness of mobile apps,
studies of this nature can greatly help many
constituents of app eco system.
As a next step (Step 4), the effectiveness of
incorporating proposed programmatic buying
framework on a real time mobile advertisement
campaigns would be evaluated. For example,
suppose an advertiser wants to design an ad
campaign for a newly designed female fashion outfit
then the proposed framework in this study can be
utilized in numerous ways. Initially, using audience
profiling of each app, advertisers can identify the
apps which are mostly used by female users. Then
the most popular female apps at a given time t can
be identified by deriving the overall popularity of an
app in time t. Subsequently, the ads campaign can be
delivered through the set of identified apps.
In order to measure the effectiveness of this
programmatic buying framework in an ad campaign,
several of experiments will be designed. First, an
experiment will be designed with advertisements by
only using app audience profiles, then a second
experiment would be designed for the same ad
campaign only using popularity signals and a third
experiment would be designed, targeting the apps
which are popular at given time t and being used
mostly by female users. The practical efficacy of the
programmatic buying framework will be validated
against direct ad serving frameworks (i.e. non-
programmatic buying) and programmatic buying
without providing the additional info such as app
audience profile information and app popularity
signals. This way it can be estimated the
effectiveness of each approach and combined
approach in an ad campaign setting at a given time t.
2 OUTLINE OF OBJECTIVES
Mobile apps are increasingly popular in various
markets across the globe. The total number of apps
in the mobile app market and their rate of growth are
remarkable. An average user spends 10% of their
media attention staring at their smartphones and
tablets. Further, flurry reported that during the
period from December 2011 to December 2012 the
average time spent on smartphones by a US
consumer has increased from 94 minutes to 127
minutes (i.e. by 35%) (Simon 2013), while the
average time spent on web has decreased by 2.4%
3
Sangaralingam K..
“No More Spray and Pray Audience Targeting in Mobile World” - IAB based Classification Approach for Mobile App Audience Measurement.
Copyright
c
2014 SCITEPRESS (Science and Technology Publications, Lda.)

(i.e.72 minutes to 70 minutes). On average US
consumers are spending 1.8 times more on apps
compared to the web (Simon 2013). Statistics
indicate that roughly 224 million people use mobile
apps on a monthly basis, compared to 221 million
desktop users i.e. mobile app users are slightly more
than desktop users (Mary 2013b). Moreover, it is
observed that mobiles have become the first screen
and made TV as the second screen during the recent
super bowl event (Mary 2013a). This indicates that
brand owners need to concentrate more on mobile
advertising in order to reach more customers. Thus,
mobile apps have become a lucrative media with a
growing customer base and promising revenue.
With the growing customer base, understanding
the audience properties is crucial to yield greater
business value for mobile advertisers. However,
audience tracking is far more difficult in mobile
context. Commercial audience measurement
agencies Neilson, ComScore and Quantcast
determine the audience characteristics of media
(such as print, radio, TV and internet) often using
panel based approaches. In this approach, set of
users with known demographic information is
recruited, and their behavior is captured either by
survey or by instrumenting their gateway devices
(cable box and browser). Then demographic
attributes of these users are extrapolated to wider
audience. In addition, behavioral weights are used to
correct for potential biases in the recruited panel.
This approach leads to reliable audience estimates as
the popularity of TV shows and websites are
persistent for quite a long time. So the real-time
collection of demographics for TV shows and web
sites is less of an issue. For example, a popular
website such as CNN.com is unlikely to be wiped
out of the map in 60 days. Similarly popular TV
show American Idol is likely to be popular at least
for 90 days. In other words, popular websites and
regular TV shows hardly demonstrate churn.
However, unlike the traditional media (such as TV
and web), mobile app popularities are highly
transient. Table 1 illustrates the top 5 popular apps
based on their store ranks on 1
st
of May and 1
st
of
June 2013 in United States under Games Category.
As can be seen from Table 1 that paid and free
apps that were popular on 1st of May are no more
popular on 1st of June (i.e. within one month
/30days period). Thus we can infer that mobile app
popularities are not persistent. Considering the top
100 apps, on average 46% churn over 30 days and
85% churn in 90 days (Farago 2012).
Table 1: Top 5 Games Apps in US Store.
No
Top 5 Apps for: iPhone –
US Games Category on
1
st
May 2013
Top 5 Apps
for: iPhone - US
Games Category on
1
st
June 2013
Free Paid Free Paid
1.
Robot
Unicorn
Attack 2
Survival
craft
Dumb
Ways to
Die
Heads
Up!
2.
Draw
Something
2™ Free
Cut the
Rope: Time
Travel
Candy
Crush
Saga
Bloons
TD 5
3.
PAC-
MAN
DASH!
Minecraft –
Pocket
Edition
Tetris®
Blitz
Block
Fortress
4.
Iron Man
3 - The
Official
Game
Draw
Something
2™
Snoopy
Coaster
Plague
Inc.
5.
Whats
The
Movie?
Teenage
Mutant
Ninja
Turtles:
Rooftop Run
Fast &
Furious
6: The
Game
Kick the
Buddy:
No
Mercy
Interestingly churn rate of games and lifestyle apps
are extremely high (80% - 90%). If one wants to try
the panel based measurement in this scenario, the
process of panel based data collection needs to
happen almost every week or even every day to have
an accurate measurement, which is impossible to
carry out. In summary, app popularities are highly
volatile and transient in nature therefore, traditional
panel based techniques cannot be used in measuring
the app audience.
3 RESEARCH PROBLEM
Thus, in this study it is aim to resolve this challenge
by proposing a non-panel based reliable scientific
technique. It is proposed a hybrid machine learning
approach based on classification and prediction. In
the classification each app would be assigned to one
or multiple fine grained classes to each app. Based
on the class to which the app belongs, it is assigned
the demographic (Age, Gender, Has Children &
Education) to the app. Using the prediction approach
app’s gender would be predicted.
The proposed hybrid approach has several
advantages compared to the traditional panel based
approach. First, the approach is scalable with the
increased number of mobile apps (currently 1.4
million within Android Play store and Apple iTunes
combined). Second, audience demography of new
apps can be instantly computed as the apps get
ICSOFT2014-DoctoralConsortium
4

added to the app store and become popular, without
waiting for the panel to be recruited.
4 STATE OF THE ART
In this section it is briefly discussed the literature
and methodologies related to audience measurement
strategies.
4.1 Audience Measurement
Prior research has studied demographic attribute
prediction using user’s web usage pattern. The
studies have used content of the websites (Kabbur et
al. 2010), various types of internet user statistics
such as web page click though data (Hu et al. 2007),
search term (Murray & Durrell 2000; Zhang et al.
2006) to predict user demographic attributes. Adar
(2007) predicted the demographic information of
online audience using vector comparison (known vs.
unknown users) and a bias value for web pages. Hu
et al. (2007)used several methods including
Bayesian classification model, similarity between
users, and multiple classifiers to predict
demographic attributes of users. Murray and Durrell,
(2000) analyzed the search terms entered and web
pages accessed by users and predicted the user
demographic attributes using Latent semantic
analysis (LSA).
In practice, cookies are commonly used to gather
long term data of individual browsing histories.
Cookie is a piece of text sent from website and
stored in user’s web browser while user is browsing
a website. When the user browses the same website
again in future, the cookie is sent back to the website
to notify web user’s previous activity. Despite of the
popularity of cookies, they are often criticized for
privacy concerns (Mayer-Schönberger 1998).
Besides, internet marketing research agency
ComScore, measures the web audience, using a tag
that is propagated throughout the website to be
tracked, which in turn will measure traffic, page
views and other related information. To measure
audience attributes ComScore regularly maintains
around two million panelists who have installed a
background monitoring software that tracks their
online behavior. In addition, series of weight
adjustments are carried out to generate accurate US
or global web demographic. This is detailed by
comScore as “Demographic information is gathered
from our panel. When someone opts into the
comScore panel, they are required to fill out a short
questionnaire where we gather demographic
information for themselves as well as other people in
the HHLD who will be using the metered
computer. We then use census population estimates
to project out to the total internet population”.
Similarly Quantcast, a web analytics service,
measure the web audience statistics by allowing the
registered sites to run its data collection feeds, web
beacons and anonymous cookies to track the online
behavior of web users. Based on the online behavior
of behavior each user, Quancast build a profile of
that person’s browsing habits and hence extrapolate
demographics.
The literature on user demographic prediction
provides with the basic state of the art
methodologies on audience estimation. However the
approach used in literature cannot be utilized in the
context for several reasons. First as discussed earlier,
due to the changing popularity of apps and constant
additions of new apps, the panel based approach will
not work for mobile apps. Second, the number of
apps is so huge (1.4 million for Android Play Store
and iTunes store combined) that the recruitment of
panels for measuring demographics is an impossible
task. Third, similar to cookies, mobile app based
cookie tracking such as Safari flip-flop, HTML5
first party cookies and UDID (unique device
identifier) have also been criticized for privacy
concerns and apps with these tracking tools have
been rejected by platform owners. Therefore, in this
study it looks into a non-panel based techniques that
does not invade the privacy of users.
5 METHODOLOGY
5.1 Intuition
Audience demographics are the quantifiable
measures of a given population. Audience
demographic data are used widely in public
opinion polling, marketing and advertising.
Generally, demographics data of a person
includes gender, age, ethnicity, income, language
and even location. Precise estimation of audience
demographics can help in targeting the right
audience though media (such as web, mobile, TV,
Radio etc). Interactive Advertising Bureau (IAB)
(IAB 2011), an organization for developing industry
standards for advertisements has proposed a
standardized taxonomy for classifying mobile apps,
based on the advice received from taxonomy
experts. This IAB taxonomy has 23 broad categories
in Tier-1, 371 sub-categories in Tier-2 and infinite
number of categories in Tier-3. Table 14 shows
"NoMoreSprayandPrayAudienceTargetinginMobileWorld"-IABbasedClassificationApproachforMobileApp
AudienceMeasurement
5

some of the IAB’s Tie -1 to Tier-2 category
mapping. In this study it is intended to measure
some of the audience properties of mobile apps in
two ways. First by classifying apps into IAB defined
Tier-2 categories and then derive the specific
audience properties (“Age”, “Has Children” and
“Education”) of each app using the category-
audience mapping. Secondly the gender distribution
of each has been predicted using machine learning
approach. Both the approaches are detailed below.
Ideally the first goal is to generate top n
categories for a given app A and estimate the set of
app audience properties based on the “category –
audience demographic” mapping. For example, it
could be estimated the audience of iTunes app
‘Brides’, which is placed under ‘Lifestyle’ category
in the Apple iTunes store. First the app (‘Brides’)
would be classified into set of IAB Tier-2 categories.
In this case, the iTunes app ‘Brides’ will be
classified into IAB categories such as ‘Society:
Weddings’, ‘Society: Marriage’, ‘Style & Fashion:
Beauty’, ‘Style & Fashion: Fashion’ and ‘Hobbies
and Interests: Photography’. In addition to the
classification it is also obtain a class membership
score for the app in each of these categories. For
example for app (`Brides’) it receives 0.4 as the
score corresponding to `Society: Weddings’
category, 0.3 to `Society: Marriage’ category, 0.2 for
`Style & Fashion: Beauty’ category, 0.05 for `Style
& Fashion: Fashion’ and 0.05 for `Hobbies and
Interests: Photography’. The second step involves
creating the demographic against each of the IAB
Tier-2 categories. For this, first a set of apps are
identified in each category, whose demographics are
well known. For example, it is known that slot
machines are used by older female groups. So it can
be assigned similar demographics to the category
related to slot machine. There are several ways one
can obtain the demographics of such an app. These
apps are called reference apps. Having identified
multiple such reference apps, and their
corresponding demographics, for a given category,
the demographics of corresponding reference apps
are consolidated and overall demographics of the
category is derived. Thus for the given app ‘Brides’,
using the relevant category membership, the
audience demographics would be estimated as age =
‘20-35’, ‘education = ‘grad school & above’,
‘having children = no’.
The second goal is to for a given app A predict
its gender demographics distribution. For example
for the same app mentioned above (App “Brides”),
relevant gender distribution would be 20-80.
Meaning that 20% of users could be male and rest
80 % would be female users. It has been observed
that deriving the gender distribution of an app using
the classification approach discussed above did not
yield satisfactory results. Thus it is proposed using
machine learning approach and predicting the
gender can achieve better accuracy.
Table 2: IAB Tier-1 to Tier-2 mapping.
Tier -1 Business
Family &
Parenting
Sports Society
Tier -2
Advertising
Agriculture
Construction
Government
Human
Resources
Marketing
Adoption
Babies and
Toddlers
Day care/Pre
School
Family
Internet
Pregnancy
Special
N
eeds Kids
Auto
Racing
Base Ball
Bicycling
Cricket
Football
Inline
Skating
Olympics
Swimming
Dating
Divorce
Support
Gay Life
Marriage
Senior
Living
Teens
Weddings
Ethnic
Specific
5.2 Solution Details
Having described the intuition and the high level
approach, in the next section the details of the
solutions are described.
The solution has 4 major components: (1)
category-demographic mapping, (2) app
classification, (3) audience measurement (Age,
Education and Has Children) (4) gender prediction.
Below it is described each in detail.
5.2.1 Category Demographic Mapping
As described before, it is relied on IAB Tier-2
category for the demographic identification of an
app. One of the important steps in the approach is
determining the demographic of each IAB Tier-2
category. For this purpose, set of reference apps
were identified for each IAB category. Reference
apps are apps that have corresponding websites or
Facebook fan-pages, where the audience
demographics are known. For example for IAB Tier-
2 category “Travel:Hotels” is has been identified
apps like “Hotels.com”, “Travelocity - Book Hotels,
Flights & Cars”and “Kayak” which have their
respective sister websites such as hotels.com,
travelocity.com and kayak.com. In addition, these
set of apps have their respective Facebook pages as
well (e.g. www.facebook.com/travelocity). In the
proposed approach of demographic identification of
mobile apps, it is assumed that mobile app user
demographics are approximately similar to the user
demographics of their corresponding sister websites
ICSOFT2014-DoctoralConsortium
6
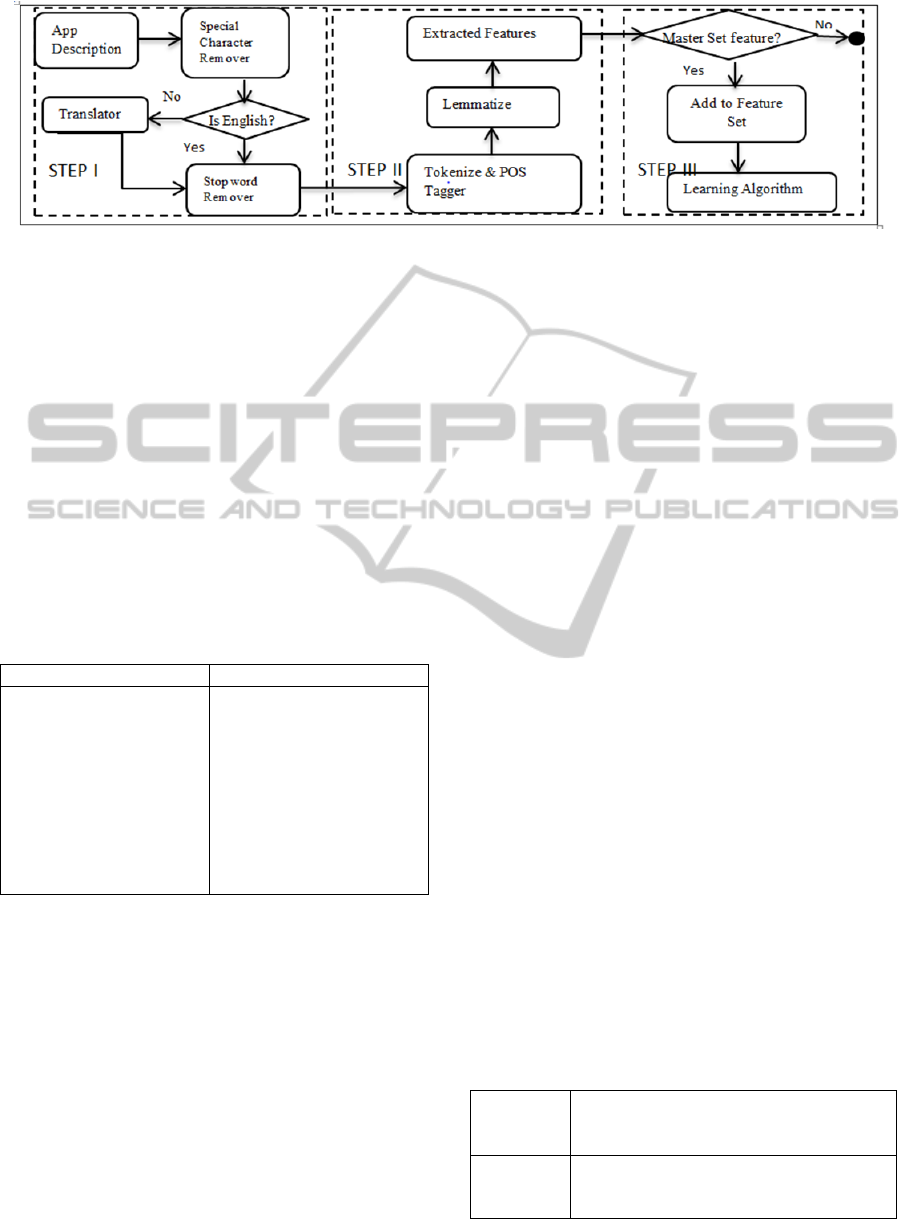
Figure 1 : Feature Extraction Process.
or relevant social media pages (e.g. Facebook fan-
pages). It has been validated this by calculating the
semantic similarity between reference app web site
contents and description of randomly selected apps
in each category. Using this assumption it was
combined the demographics of these sister websites
from known sources (Alexa 2012; Quantcast 2013)
and Facebook fan-pages to derive the demographics
of each reference apps. Next, using the
demographics of reference apps of each IAB
category, it derived the demographic of each IAB
Tier-2 category. As an example, Table 3 shows the
demographics of the “Society: Weddings” category
derived using the above mentioned approach.
Table 3: IAB Category Demographic Mapping.
Tie2 - Category Demographics
Society : Weddings
Age {Child: 0%, Teen:
10%,GenY: 75%,Middle
Age: 10% & Old:5%}
Gender{Male:30% &
Female: 70%}
Has Children{Yes: 15% &
No:85%}
Education :{No College:
5%, College:30% & Grad
School: 65%}
5.2.2 App Classification
a. Data Pre-processing and Feature Extraction
Once the demographic for each IAB Tier-2 category
has been identified, the process of demographic
identification of an app involves identifying the best
possible (in this case it was top 5) IAB Tier -2
categories to which an app can belong to. This
process classifies the existing apps into identified
IAB categories. For this purpose publicly available
app descriptions were used as the main source. For
classification it was followed supervised machine
learning approach. Initially to train the classifiers
approximately 25 apps for each category has been
manually identified. Hence, for all 371 IAB Tier-2
categories, 9205 apps as the training set have been
identified. All these apps have been validated twice
for the accuracy of categorization into their
respective classes (or categories) by professional
lexicographers. For example under the category
“Home & Garden: Gardening”, apps such as
“Garden Insects”, “Gardening and Landscape
Guide” and “Vegetable Gardening Guide” are
identified as training instances.
For each app in the training set, a set of features
has been identified. Figure 1 shows the details of our
feature extraction process that includes several steps.
Step1: In step 1 each app description is checked for
special characters (see Table 4) and if found will be
removed from the app description, then it is
subjected to language test. It has been identified
several non-English apps in the training of samples.
There were many country specific IAB categories
under the Tier 1 category “Travel” and it has
observed that some of the apps were not in English.
For example for the Tier 2 category “Travel: Saudi
Arabia” apps such as “Riyadh Food - ”
and “Al Tayyar Travel - ” were
identified as training instances. As the app
description was written using both English and
Arabic, a translator package (i.e. Bing Translator –
Microsoft Corporation, 2011) has been included to
handle app descriptions that contained languages
other than English. Then all the stop words have
been removed (see Table 4) from the app
description.
Table 4: Stop words & Special Characters.
Special
Characters
(
》《㋡〉
〠
_
✹★◆✦✔
•®#*
◇
–
、
'
〜
,àè:)ññé@#$%&(ñó#/.!;-
=üä?
【】
」「
)
Stop words
(Only some)
“a", "about", "above", "above", "across",
"after", "afterwards", "again", "against",
"all", "almost", "alone", "along", "already"
"NoMoreSprayandPrayAudienceTargetinginMobileWorld"-IABbasedClassificationApproachforMobileApp
AudienceMeasurement
7

Step 2: In step 2, the processed description was
subjected to part of speech tagging and
lemmatization. The Stanford part-of-speech tagger is
used (Toutanova et al. 2003) to attach a part-of-
speech tag to each token (i.e. word) in the app
description. More precisely, the app description is
parsed into sentences, which are then processed by
the part-of-speech tagger. When supplied with a
sentence, the tagger can produce an ordered list of
part-of-speeches as the output for each word in the
sentence (such as noun, verb, adjective, etc). For
example, the app called “Beer Calculator” had the
sentence like the following in its description: “By
now we all know that alcohol is bad for you, yet
most of will still go out to have a beer”. When we
subjected this sentence to part-of-speech-tagger the
word ‘By’ was tagged as a preposition, ‘now’ as
adverb, ‘we’ as personal pronoun and ‘all’ as a
determiner, and so on. Thus the overall tagging
results would be By/IN now/RB we/PRP all/DT
know/VBP that/IN alcohol/NN is/VBZ bad/JJ for/IN
you/PRP ,/, yet/RB most/JJS of/IN will/MD still/RB
go/VB out/RP to/TO have/VB a/DT beer/NN, where
IN,RB,PRP,DT, VBP, NN,VBZ, JJ,MD stands for
preposition, adverb, personal pronoun, determiner,
Verb, Noun, adverb, Verb, adjective and model
respectively. Once the descriptions were tagged,
only the verb, adverbs and nouns were extracted as
the initial features. Then extracted features were
subjected to lemmatization in order to get the root
word (e.g. “running” would be lemmatized as “run”)
form a particular extracted token.
Step 3: Once initial set of features were extracted
based on the above mentioned procedure, in step 3,
it was subjected to master feature set check. Master
feature set is a bag of words that contain words
related to app domain. Initial master feature set was
created by lexicographers based on the bag of words
(i.e. dictionary) related to app domain.
To build the master feature list, a corpus for
each category has been created by taking a sample of
100 apps per category and then came up with the
high frequency and higher idf (i.e. rare words)
tokens for each category (top 100 tokens). Then it
was added the tokens into the initial master feature
list. If the extracted top word appears in the master
feature set then it will be considered as one of the
feature for a given app. Thus for each app selected
for the training, features were extracted and kept in a
file in the following format.
“<feature1> <feature2><feature 3>………………………… <feature_n>”.
Now that the features have been extracted, next it
proceeds with building the classification model.
b. Building classification model
Multinomial Naïve Bayes, TF-IDF and Support
vector machines are used as the initial classification
approaches in classifying the apps into the possible
IAB Tier-2 categories. Brief introduction about these
methodologies are detailed below.
Naïve Bayes:
Since the training input is pre-processed app
description, token-based naive Bayes classifier is
used to compute the joint token count in app
description and category probabilities by factoring
the joint into the marginal probability of a category
times the conditional probability of the tokens given
the category defined as follows.
,|∗
Conditional probabilities of a category given tokens
are derived by applying Bayes's rule to invert the
probability calculation:
|,/
|∗/
Since Naïve Bayes assumes that tokens are
independent of each other (this is the "naive" step):
|0|∗...∗
.1|
.
|
Then, using the marginalization the marginal
distribution of tokens has been computed as follows:
′,′
′|′∗′
In addition, maximum a posterior (MAP) estimate of
the multinomial distributions also calculated
for over the set of categories, and for each
category, the multinomial
distribution
|
over the set of tokens.
Further, it has been employed the Dirichlet
conjugate prior for multinomials, which is
straightforward to compute by adding a fixed "prior
count" to each count in the training data. This lends
the traditional name "additive smoothing". After
building the Naïve Bayes classifier, extracted
features with the respective categories are passed as
the input to build the classification model.
TF-IDF:
This classifier is based on the relevance feedback
algorithm originally proposed by Rocchio(Rocchio
1971) for the vector space retrieval model (Salton &
McGill 1986). In TF-IDF we considered the app
ICSOFT2014-DoctoralConsortium
8

description of each app as the input document which
can be classified into many IAB categories. In other
words TF-IDF classifier was adopted to find the best
matching category for the given app description.
Thus TF-IDF approach captures the relevancy
among words, text documents and particular
categories. TF-IDF for a given word extracted in the
Step 1 was computed using the following formula:
||
,
where || is total number of documents in the
corpus and
is number of times word
appears in a given document . This word weighting
heuristic says that a word
is an important
indexing term for document if it occurs frequently
in it (i.e. the term frequency is high). On the other
hand, words which occur in many documents are
rated less important indexing terms due to their low
inverse document frequency. Training the classifier
is achieved by combining document vectors into a
prototype vector
→for each class
. First, both the
normalized document vectors of the set of app
description for a class (i.e. positive examples) as
well as those of the other app descriptions for the
other classes (i.e. negative examples) are summed
up. The prototype vector is then calculated as a
weighted difference of each.
→
1
|
|
→
||
→||
→
1
→
→
→
(1)
and are the parameters that adjust the relative
impact of positive and negative training examples.
is the set of training documents assigned to class
and ||
→|| denotes the Euclidian length of a vector
→.
Learned model for each class is represented by
resulting set of prototype vectors (see equation 1).
This model can be used to classify a new document
. Again the new document can be represented as a
vector
→
using the scheme described above. To classify
the
cosines of the prototype vectors
with
→
are calculated. Finally class for the document
would be assigned based on the highest document
vector cosine score.
cos
→,
→
In this way, TF-IDF classifier has been trained using
the training data of 9205 apps. Then the trained
model is used to predict the class for the rest of the
apps.
Support Vector Machine:
Support Vector Machine (SVM) is a supervised
learning algorithm developed over the past decade
by Vapnik and others (Joachims, 1998; Vapnik,
1999). The algorithm addresses the general problem
of learning to discriminate between positive and
negative members of a given class of n-dimensional
vectors. The SVM algorithm operates by mapping
the given training set into a possibly high-
dimensional feature space and attempting to locate
in that space a plane that separates the positive from
the negative examples. SVM Multiclass library
(Joachims, 2008) has been used to train the SVM
classifier which uses the multi-class formulation
described in (Crammer and Singer, 2002). This
formula has been optimized with an algorithm which
is more scalable in the linear case. SVM Multiclass
library expects the training and testing data in the
following format.
<line> .=. <target> <feature>:<value> <feature>:<value>
... <feature>:<value> # <info>
<target> .=. <integer>
<feature> .=. <integer>
<value> .=. <float>
<info> .=. <string>
Here target and feature should be represented by
integer. Thus all the 371 categories have been given
a unique identifier from 1-371 and each unique
feature is assigned a unique number across training
and testing data.
The target value and each of the feature/value
pairs are separated by a space character.
Feature/value pairs are ordered by increasing feature
number. Features with value zero are skipped in
building the model. The target value denotes the
class of the example via a positive (non-zero)
integer. So, for example, the line
6 1:0.42 3:0.34 9284:0.2 # angry birds
specifies an example of class 6 which is for game for
which feature number 1 has the value 0.42, feature
number 3 has the value 0.34, feature number 9284
has the value 0.2, and all the other features have
value 0. In addition, the app name “angry birds” is
stored with the vector, which can serve as a way of
providing additional information when adding user
defined kernels. All the features are represented by
respective tf-idf values for each category.
As mentioned above, all three classifiers are
trained using the same training data with the
different representation.
"NoMoreSprayandPrayAudienceTargetinginMobileWorld"-IABbasedClassificationApproachforMobileApp
AudienceMeasurement
9

In the following section it describes audience
measurement process using the output of
classification process.
5.2.3 Audience Measurement
Once an app has been classified using the previously
described approach, this section describes how it is
assigned the demographic to each app. Assume an
app A is classified into set of categories c
,c
,….c
with their respective classification scores
,
,….
. Then their respective weighted average
scores are calculated (
,
,…,
). These
weighted average scores are required, since chosen
classifiers return score values in different ranges and
more importance should be given to the category
which has returned the highest score. If we assume
⋯
then the
could be calculated
using Proportional Fuzzy Linguistic Quantifier
(PFLQ) technique proposed by Yager (1988) as
follows;
∑
where
∞,∞
After calculating weighted average scores for each
category, the overall demographics of app A is
estimated as, here
is the consolidated
demographics for the category
. Further
is a
1∗matrix and n is number of different
demographic dimensions. Using this approach
“age”, “education” and “has kid” demographics is
calculated.
∗
5.2.4 Gender Prediction
Estimating the Gender distribution of mobile app
users using the above mentioned classification
approach did not yield better accuracy compared to
other matrices such as “Age”, “Education” and “Has
Kids.” It has been observed that IAB Tier-2
categories cannot be used to estimate the relevant
gender distribution of an app which belongs to more
than a category. Thus text mining and machine
learning based approaches have been employed to
predict the gender distribution of mobile apps. For
this purpose 9185 apps have been manually and
independently labeled for its gender distribution by 2
professional lexicographers. In this process,
lexicographers have been instructed to label the
gender distribution on the scale of 1-7.
Meanings of these different label ids have been
shown in Table 5. Descriptions of each app have
been given as the source to judge its gender
distribution. For example, the android games app
“Blackjack Vegas” (MobileMediaCom 2014) would
be played mostly by male users than the female
users. Thus it has been labeled as “1” by the
professional lexicographers.
Table 5: Gender Distribution Labels.
Label ID Meaning
1 80 % Male & 20% Female
2 70 % Male & 30% Female
3 60 % Male & 40% Female
4 50 % Male & 50% Female
5 40 % Male & 60% Female
6 30 % Male & 70% Female
7 20 % Male & 80% Female
To assess the reliability and validity of the rating,
inter-judge raw agreement and Hit ratio were
calculated. Inter-judge raw agreement was
calculated by counting the number of items both
judges labeled the same, divided by the total number
of items (Moore & Benbasat, 1991). Hit ratio is the
“overall frequency with which judges place items
within intended labels” (Moore & Benbasat, 1991).
Results show that there are no major concerns with
the labeling validity and reliability of these labels.
Inter-rater raw agreement score, which averaged
0.89, exceeds the acceptable levels of 0.65 (Moore
& Benbasat, 1991). The overall hit ratio of items
was 0.90.
Once lexicographer finished labeling of all 9185
apps, data set is divided in to 2 sets for the training
and testing purposes. For training and testing, 6170
and 3015 apps have been used respectively. Training
instances are made containing fairly equal amounts
of apps in each category (i.e. 1-7). For example,
category 1 and category 2 are allocated with 337 and
391 apps respectively. This way it has been made
sure the over fitting issues did not occur during the
training process.
Further, by using the 9185 apps corpus is built
with the respective tf-idf score of each token. When
building the corpus the, app descriptions were
subjected to same preprocessing mechanism which
was described in Step 2 of App Classification sub
section. Corpus is created by using the Apache
Lucene Indexer. Once the corpus is created, training
model is built using the apps which have been
identified for training purposes. Step by step
procedure of this approach is detailed below. In this
approach different feature selection methodologies
such as Information Gain, Chi-Square, Top 15
Unigrams and Top 10 Unigrams are used and its
accuracy is evaluated. Below it has been detailed the
ICSOFT2014-DoctoralConsortium
10

steps taken using Top 10 Unigram approach.
1. Each app description is fetched and subjected to
preprocessing as discussed earlier (stemming,
lemmatization and stop word removal)
2. For each app, top 10 descriptive tokens are
identified using the relevant tf-idf scores and then
the master feature set is built. Altogether 20184
features have been identified for master feature set
using the training data set apps.
3. Each app is then represented by these top 10
features. Respective feature’s tf-idf scores have
been used as the numerical representational value.
4. Each app’s gender label (1-7) has been used as the
class variable and rest of all the features have been
used as the predictor variables.
5. Support Vector Machine Regression (Joachims
1998) with Gaussian Radial Basis Function (RBF)
kernel has been used to learn the patterns to
predict the gender. For this purpose statistical tool
R has been used as and the package “e1071” has
been adopted as the relevant package. Then the
training model is built.
6. Test data set apps also subjected to preprocessing
and numerical vector transformation procedure as
described for training data set apps.
7. Then the test data set apps have been feed in to R
with the trained model and relevant gender is
predicted.
In the following section experiment results of the
proposed solutions are discussed.
5.3 Preliminary Experiment
Having estimated the audience for each app using a
hybrid methodology, efficacy of the proposed
solution is analyzed in three steps. First, it has been
analyzed the accuracy of different classifiers used
for predicting the relevant categories of an app.
Secondly, accuracy of audience measurement using
classification approach has been analyzed (“Age”,
“Education” and “Has Children”). Finally, the
efficacy of gender prediction is analyzed. Details of
the experiment procedures are described below.
To measure the accuracy of different classification
approaches used, a test data was built using 372
randomly chosen apps from popular categories such
as Business, Entertainment, Education, Finance,
Game and Style & Fashion. For the identified 372
apps, input data was built using the feature
extraction procedure described above. Then it was
subjected to different classification approaches
discussed above (Naïve Bayes, TF-IDF & SVM).
Based on the classification, the top 5 predicated
classes for each app were chosen and the classes
were validated by the 3 professional lexicographers
for appropriateness. To assess the reliability and
validity of the rating, inter-judge raw agreement and
Hit ratio were calculated. Inter-rater raw agreement
score, which averaged 0.73, exceeds the acceptable
levels of 0.65 (Moore & Benbasat, 1991). The
overall hit ratio of items was 0.82.
Table 6, illustrates the accuracy of different
classifiers across different categories. Overall TF-
IDF achieved highest accuracy of 78% compared to
the other two classifiers. Thus, TF-IDF classifier has
been chosen to estimating the audience.
After validating the accuracy of classifiers, it
proceeds to evaluate accuracy of app audience
estimation specifically the Age, Education and Has
Children matrices. For this purpose, the same test
data (i.e. 372 randomly chosen apps) that were used
in measuring the accuracy of app classification.
Following steps were carried out. First, professional
lexicographers have been employed to manually
estimate the audience of given apps using the
relevant app store URL (e.g.
https://itunes.apple.com/us/app/abc-sight-words-
writing-free/id379874412?mt=8). Then the
automated audience estimation process was carried
out. The efficacy of audience estimation was carried
out by comparing the automated audience estimation
(demographic) values with manually assigned
demographic values using the well-known root-
mean-square-error (RMSE) metric. For N (372
randomly chosen) apps if we obtain
,
,…,
as
the estimated demographic values using our
approach and
,
,…,
as the manually
assigned demographic values by professional
lexicographers, then, the RMSE is computed as
follows,
∑
..
.
In this way, demographic dimensions such as “Age”,
“Education” and “Has Kids” achieved 85.5%,
80.9%, and 80.07% accuracies respectively.
As the 3rd step efficacy of proposed gender
prediction mechanism is evaluated. For this purpose
3015 apps and their respective descriptions are used
as the source to build the test data. All the app
descriptions were subjected to same steps as
discussed for training dataset apps (stemming,
lemmatization and stop word removal). After this
step different feature selection approaches such as
Information Gain, Chi-Square, Top 15 bigrams and
"NoMoreSprayandPrayAudienceTargetinginMobileWorld"-IABbasedClassificationApproachforMobileApp
AudienceMeasurement
11

1-gram tokens and top 10 unigram tokens are used.
Table 7, shows the number of features chosen while
using different feature selection mechanism and
their precision, recall and overall accuracy values. It
can be observed that when using Top-10 unigrams
higher accuracy is produced for predicting the
gender of mobile applications. Thus it has been
identified that prediction accuracy increases when
the matrix size is large. In this case it is
3015*20647.
6 EXPECTED OUTCOME
In this study, it has been identified that important
constituents of app ecosystem face numerous
hurdles in estimating the right audience for mobile
apps. In order to solve this problem, it has been
proposed a dynamic approach which can effectively
measure the audience demographics for the millions
of existing apps as well as the new incoming apps.
Experiment results of the approach yield satisfactory
results. This study has several important
implications. Firstly, by using this audience
estimation method both mobile advertisers and app
developers can greatly benefit by precisely targeting
consumers. Since most of the ad-requests do not
contain relevant audience information, this approach
can be used to plug this data as the third party
platforms to the ad-requests. Secondly, the app
platform owners (e.g. Apple and Android) can use
both classification and audience measurement
methods to effectively classify and estimate the
audience for millions of existing apps and incoming
new apps, and hence reach more consumers. Finally,
this audience estimation can also help mobile app
users in identifying the most suitable app that can
fulfill their needs and wants. Given the popularity
and usefulness of mobile apps, studies of this nature
can greatly help many constituents of app eco
system and has a rich potential to extend the
research of the e-business. Next stage of this
research has been already discussed in the current
stage of the research section of this paper.
Table 6: Classification Accuracy across Categories.
IAB
Categories
Accuracy
Multinomial
Naïve Bayes
TF-IDF SVM
Business 62.50% 69.75% 71%
Style &
Fashion
67.2% 79.6 % 68%
Arts &
Entertainmen
t
71.00% 83.00% 72%
News 68.14% 74.28% 67%
Health and
Fitness
77.50% 93.75% 84.25%
Personal
Finance
74.00% 80.00% 82%
Sports 74.00% 81.60% 78%
Education 68.00% 74.75% 67%
Hobbies &
Interests
76.00% 73.00% 69.8%
Travel 74% 70% 76.5%
Overall : 71.234% 77.97% 73.56%
Table 7: Accuracy across different feature selection
methods.
Feature
Selection
Method
Total
number of
Features
Precision Recall
Overall
Accuracy
Information
Gain
965 0.715 0.64 85%
Chi-Square 847 0.69 0.58 84.23%
Top-15 bi-
grams &
Unigrams
11370 0.81 0.72 87%
Top-10
Unigrams
20647 0.84 0.76 88.73%
REFERENCES
Adar, E. A. R. C., 2007. User Profile Classification by
Web Usage Analysis.
Alexa, 2012. Alexa the Web Information Company.
Available at: http://www.alexa.com.
Ebbert, J., 2012. Define It - What Is Programmatic
Buying? Available at: http://www.adexchanger.com/
online-advertising/define-programmatic-buying/.
Farago, P., 2012. App Engagement: The Matrix Reloaded.
Flurry.
Hu, J. et al., 2007. Demographic prediction based on
user’s browsing behavior. In Proceedings of the 16th
international conference on World Wide Web. pp.
151–160.
IAB, 2011. Networks & Exchanges Quality Assurance
ICSOFT2014-DoctoralConsortium
12

Guidelines, Available at: http://www.iab.net/media/
file/IAB-NE-QA-Guidelines-v1.5-November-2011-
FINAL.pdf.
IAB, 2013. Programmatic and RTB.
Joachims, T., 1998. Text Categorization with Support
Vector Machines: Learning with Many Relevant
Features. In ECML ’98 Proceedings of the 10th
European Conference on Machine Learning. Springer-
Verlag London, UK, pp. 137–142.
Kabbur, S., Han, E. & Karypis, G., 2010. Content-based
methods for predicting web-site demographic
attributes. In Proceedings of IEEE 10th International
Conference on Data Mining (ICDM). pp. 863–868.
Mary, E. G., 2013a. The Screen Bowl: Mobile Apps Take
On TV. Flurry. Available at: http://www.flurry.com/
bid/93898/The-Screen-Bowl-Mobile-Apps-Take-On-
TV#.U6FSAPm1bz0 [Accessed May 20, 2014].
Mary, E. G., 2013b. There’s An App Audience for That,
But It’s Fragmented. Available at: http://
blog.flurry.com/bid/96368/There-s-An-App-Audience-
for-That-But-It-s-Fragmented.
Mayer-Schönberger, V., 1998. The Internet and Privacy
Legislation: Cookies for a Treat? Computer Law &
Security Review, 14(3), pp.166–174.
MobileMediaCom, 2014. Blackjack Vegas. Google Play.
Murray, D. & Durrell, K., 2000. Inferring demographic
attributes of anonymous internet users. In Web Usage
Analysis and User Profiling. Springer, pp. 7–20.
Quantcast, 2013. May Mobile OS Share North America.
Available at: https://www.quantcast.com.
Rocchio, J., 1971. Relevance Feedback in Information
Retrieval. In The SMART Retrieval System -
Experiments in Automatic Document Processing,
Prentice-Hall.
Salton, G. & McGill, M. J., 1986. Introduction to Modern
Information Retrieval, New York, NY, USA:
McGraw-Hill, Inc.
Simon, K., 2013. The Rise of the App & Mortar Economy.
Toutanova, K. et al., 2003. Feature-rich part-of-speech
tagging with a cyclic dependency network. In
Proceedings of the 2003 Conference of the North
American Chapter of the Association for
Computational Linguistics on Human Language
Technology - Volume 1. Association for
Computational Linguistics, pp. 173–180.
Yager, R. R., 1988. On ordered weighted averaging
aggregation operators in multicriteria decisionmaking.
Systems, Man and Cybernetics, IEEE Transactions on,
18, pp.183–190.
Zhang, B. et al., 2006. Predicting demographic attributes
based on online behavior.
"NoMoreSprayandPrayAudienceTargetinginMobileWorld"-IABbasedClassificationApproachforMobileApp
AudienceMeasurement
13
