
A Hybrid Model for the Analysis of a Surgical Pathway
Roberto Aringhieri and Davide Duma
Department of Computer Science, Universit
`
a degli Studi di Torino, Corso Svizzera 185, 10149, Torino, Italy
Keywords:
Surgical Pathway, Operating Room Management, Bed Management, Simulation, Optimization.
Abstract:
In this paper we focus our attention on the analysis of a surgical pathway from a patient-centred point of view.
The main concern of this work is the introduction of some optimization modules in the management of the
most critical resources in a surgical pathway, that is the stay beds and the operating rooms, and to evaluate
their impact with respect to a set of patient– and facility– centred indices. We propose a hybrid simulation
and optimization model: simulation is used in order to generate a real situation with respect to the inherent
stochasticity of the problem while optimization is used to take the best decisions in different points of the
surgical pathway.
1 INTRODUCTION
The current development of the health care systems
is aimed to recognize the central role of the patient as
opposed to the one of the health care providers. In this
context, Clinical Pathways (CPs) shift the attention
from a single health benefit to the health care chain
that starts to resolve the illness episode. They can be
defined as “health-care structured multidisciplinary
plans that describe spatial and temporal sequences of
activities to be performed, based on the scientific and
technical knowledge and the organizational, profes-
sional and technological available resources” (Camp-
bell et al., 1998).
The aim of a care pathway is to enhance the qual-
ity of care by improving patient outcomes, promot-
ing patient safety, increasing patient satisfaction, and
optimizing the use of resources as stated by the Eu-
ropean Pathway Association. Moreover, while many
papers show that, appropriately implemented, CPs
have the potential to increase patient outcome, reduce
patient length of stay and limit variability in care,
thereby yielding cost savings (Rotter et al., 2010), lit-
tle attention has been dedicated to study how CP can
optimize the use of resources.
In this paper we focus our attention on the analy-
sis of a surgical pathway from a patient-centred point
of view. The main concern of this work is the intro-
duction of some optimization modules in the manage-
ment of the most critical resources in a surgical path-
way, that is the stay beds and the operating rooms,
and to evaluate their impact with respect to a set of
patient- and facility- centred indices.
Our approach is a hybrid simulation and optimiza-
tion model. Simulation is used in order to generate a
real situation with respect to the inherent stochasticity
of the problem while optimization is used to take the
best decisions in different points of the surgical path-
way. Accordingly to (Magerlein and Martin, 1978),
we consider the operative decisions concerning the
advanced scheduling and allocation scheduling of pa-
tients. Furthermore we consider the real time man-
agement of the operating room planning.
The aims are to reduce the waiting list according
to a prioritized admission system, to operate patients
within a given time limit depending on their level of
urgency, to improve the utilization of the above crit-
ical resources and to minimize the number of can-
cellations. The results show an evident improvement
of the patient-centred indicators without deteriorating
the facility-centred ones.
The paper is organized as follow. Section 2 briefly
review the literature regarding the problem under con-
sideration. The problem is depicted in Section 3 while
the integrated simulation and optimization model is
discussed in Section 4. Model validation and its main
results are discussed in Section 5 and Section 6, re-
spectively. Section 7 closes the paper.
2 LITERATURE REVIEW
A CP can be conceived as an algorithm based on a
flow chart that details all decisions, treatments, and
889
Aringhieri R. and Duma D..
A Hybrid Model for the Analysis of a Surgical Pathway.
DOI: 10.5220/0005148408890900
In Proceedings of the 4th International Conference on Simulation and Modeling Methodologies, Technologies and Applications (HA-2014), pages
889-900
ISBN: 978-989-758-038-3
Copyright
c
2014 SCITEPRESS (Science and Technology Publications, Lda.)

reports related to a patient with a given pathology,
with a logic based on sequential stages (De Bleser
et al., 2006). A CP is therefore ”the path” that a pa-
tient suffering from a disease walks in the National
Health System. This pathway can be analysed at
a single, local level of care (a single hospital, or a
single region) or globally, taking into account every
level of health-care from education and prevention, to
diagnosis of diseases, treatment and recovery. CPs
are specifically tailored to stimulate continuity and
coordination among the treatments given to the pa-
tient through different disciplines and clinical envi-
ronments. For this reason, they can be considered an
operational tool in the clinical treatment of diseases,
from a patient-focused point of view (Panella et al.,
2003).
As already discussed in the introduction, little at-
tention has been dedicated to study how CP can op-
timize the use of resources. The few papers deal-
ing with the CP resource optimization are reviewed
in (Aringhieri et al., 2012) to which the reader can
refer to deepen this topic. In the remaining of the
section, we briefly report the literature concerning the
optimization solutions applied to the operating room
planning.
In the international literature there is a large num-
ber of papers dealing with the OR planning problem.
(Cardoen et al., 2010; Guerriero and Guido, 2011)
have recently published exhaustive literature reviews
on the operating room planning and scheduling prob-
lem classes, analysing in detail multiple fields related
to the problem settings and summarizing significant
trends in research areas of future interest.
Problems arising in the OR planning and schedul-
ing are usually classified into three phases corre-
sponding to three decision levels, that is strategic
(long term), tactical (medium term) and operational
(short term) (Testi et al., 2007). Here, we take into
account the last phase – “surgery process scheduling”
– which is generally separated into two sub-problems
referred to as “advanced scheduling” and “allocation
scheduling” (Magerlein and Martin, 1978). The first
sub-problem consists in assigning a specific surgery
and OR time block to each patient over the plan-
ning horizon, which can range from one week to
one month (Ozkarahan, 2000; Guinet and Chaabane,
2003; Lamiri et al., 2008; Fei et al., 2008; Hans
et al., 2008; Marques et al., 2012; Rizk and Arnaout,
2012). Given this advanced schedule, the second sub-
problem then determines the precise sequence of sur-
gical procedures and the allocation of resources for
each OR time block and day combination (Pham and
Klinkert, 2008; Cardoen et al., 2009; Roland et al.,
2010; Riise and Burke, 2011; Herring and Herrmann,
2012; Meskens et al., 2013) in order to implement
it as efficiently as possible. Approaches dealing with
more than one planning level simultaneously are quite
rare (Jebali et al., 2006; Testi et al., 2007; T
`
anfani and
Testi, 2010).
When dealing with uncertainty, literature usu-
ally considers three main issues, that is the arrival
of patients (see, e.g.,(Lamiri et al., 2008; M et al.,
2009)), the variability of patient length of stays (see,
e.g., (Beli
¨
en and Demeulemeester, 2007; Adan et al.,
2011; Herring and Herrmann, 2011)) and the variabil-
ity of patient operating times (see, e.g., (Hans et al.,
2008; Min and Yih, 2010; T
`
anfani et al., 2010; Batun
et al., 2011; Shylo et al., 2013)). Methodologies
adopted ranges from montecarlo simulation to sample
average approximation, from probabilistic and chance
constraints programming to stochastic programming
with recourse. Some authors use simulation to com-
pare different scheduling and sequencing strategies
and test the solution robustness against the random-
ness of surgery duration (Testi et al., 2007; Persson
and Persson, 2010; Sobolev et al., 2011).
3 PROBLEM STATEMENT
We consider the problem of managing a single sur-
gical pathway taking into account the optimization
problems arising when dealing with the decision
levels concerning the advanced and the allocation
scheduling. In order to guarantee the execution of
such decisions, we deal with the real time manage-
ment of an operating room planning. It consists in
a sort of centralized surveillance system whose main
task is to supervise the execution of the planning and,
in the case of delays, to take a decision regarding the
patient cancellation or the overtime assignment.
The definition of the surgical pathway is inspired
to that presented and analysed in (Ozcan et al., 2011)
for the thyroid surgical treatment. The reader can re-
fer to this paper for further details. From a manage-
ment point of view, a surgical pathway can be seen as
made up of three phases.
The first phase concerns the pre-admission phase
and it is related to all the activities regarding the pa-
tients before the admission as depicted in Figure 1.
A Diagnosis Related Groups (DRG) defines a gen-
eral time limit before which the patient should be op-
erated on. In our context, a Urgency Related Group
(URG) is assigned to each patient belonging to the
same DRG: the URG states a more accurate time
limit. In other word, URG allows to define a partition
of the patients in such a way to prioritize their surgical
intervention. The optimization problem arising in this
SIMULTECH2014-4thInternationalConferenceonSimulationandModelingMethodologies,Technologiesand
Applications
890

Process
Decision
Data
Predefined Process
Internal Storage
Document
Multidocument
Preparation
Manual Input
Manual Operation
Connector
Off-page Connector
Terminator
Card
Punched Tape
Summing Junction
Or
Collate
Sort
Extract
Merge
Stored Data
Delay
Sequential Access
Storage
Magnetic Disk
Direct Access
Storage
Display
Booking
Center
queue
no
Arrival
Process
yes
Exit
Booking
Center
Ambulatory
visit queue
Ambulatory
visit queue
Need a
surgery?
Pre-operative
exams queue
Pre-operative
exams
Check list
Need
additional
exams?
Pre-admission
visit queue
Pre-admission
visit
Wait for
scheduling
Has been
successfull
scheduled?
Wait for
admission date
Hospital phase
yes
yes
yes
no
no
no
A
B
C
D
E
Figure 1: Pre-admission phase flowchart.
phase – the advanced scheduling problem – is that of
selecting patients from the (usually long) waiting list
and to assign them to an OR session (i.e., an operating
room on a given day) in such a way to satisfy several
operative constraints (number of beds available dur-
ing the patient stay, total time available for the OR
session, and so on). Our objective is to maximize the
utilization of the operating rooms in each day in such
a way to guarantee that each patient is operated within
the time limit defined by the URG. This problem is
well known in literature as Surgical Case Assignment
Problem (SCAP) (T
`
anfani and Testi, 2010).
The hospital phase is concerned with all the ac-
tivities involving the admitted patient stay except for
those related to the operating theatre as depicted in
Figure 2. The relevant information in this phase is the
Length Of Stay (LOS) of each patient, that is the num-
ber of days required before the discharge. The opti-
mization problem arising in this phase – the allocation
scheduling problem – is that of finding a sequence of
patients to decide the order in which they are operated
on. The objective is to minimize the risk of cancel-
lation according to their assigned position in the se-
quence taking into account a patient-centred point of
view (considering waiting time, class of urgency, pos-
sible previous referrals) with respect to the available
operating time.
Figure 3 depicts the operating theatre phase
which is a component of the hospital phase – as high-
lighted in Figure 2. Due to its importance in a surgical
pathway, it requires to be treated separately. Patients
assigned to a given OR session will be operated on
following the sequence previously defined unless de-
lays imposes to define a new sequence. Patient not op-
erated on will be rescheduled. The optimization prob-
lem arising in this phase is the real time management
of the operating room planning. When the Estimated
Operating Time (EOT) differs from the Real Oper-
ating Time (ROT), we could have a delays. If such
delays become significant, that is exceeding the to-
tal operating time allowed, the real time management
should deal with the following possible decision to be
taken every time a patient finish its intervention:
• to use some overtime reducing the total amount
weekly available;
• to cancel 1 or more patients and to re-schedule
them, if possible;
• to change the sequence of the remaining patients
in order to minimize the number of cancellations.
The first two choices are generally non-trivial and
alternatives requiring to consider several aspects.
For instance, the decision of postponing a patient
could violate the so called Maximum Time Before
Treatment (MTBT) determined by its URG. Further,
it determines an increased patient stay lowering the
patient satisfaction and, by consequence, the qual-
ity of the service. These decisions have to take into
account the inherent uncertainty. On the other side,
overtime is a scarce resource. So, it seems crucial to
establish some criteria driving the decisions of using
it to avoid cancellations.
Process
Alternative Process
Decision Data Predefined Process
Internal Storage
Document
Multidocument
Preparation Manual Input Manual Operation
Connector
Off-page Connector
Terminator
Card
Punched Tape Summing Junction
Or
Collate Sort Extract Merge Stored Data
Delay
Sequential Access
Storage
Magnetic Disk
Direct Access
Storage
Display
Area
sì
no
Alternative Process
no
Degenza
pre-
operatoria
Fase
pre-ammissione
Coda per
l’ammissione
Sono
disponibili
dei posti
letto?
Attesa per la
liberazione di un
posto letto
Ammissione nel
reparto
Fase del
teatro operativo
È stato
operato?
Degenza post-
operatoria
Dimissione
Uscita
sì
no
Pre-admission
phase
Admission
queue
There is an
empty bed?
Wait for the
release of a
bed
Admission to
the ward
Pre-operation
hospital stay
Operating
theatre phase
yes
no
Was
operated?
no
Post-operation
hospital stay
yes
Discharge
Exit
F
G
H
I
Figure 2: Hospital phase flowchart.
AHybridModelfortheAnalysisofaSurgicalPathway
891

Process
Alternative Process
Decision Data Predefined Process
Internal Storage
Document
Multidocument
Preparation Manual Input Manual Operation
Connector
Off-page Connector
Terminator
Card
Punched Tape Summing Junction Or
Collate Sort Extract Merge Stored Data
Delay
Sequential Access
Storage
Magnetic Disk
Direct Access
Storage
Display
Area
no
Alternative Process
Hospital phase
Wait for
operating
room release
Is the
session
open?
no
yes
Is the next
surgery?
Surgery
Hospital phase
no
yes
J
Figure 3: Operating theatre phase flowchart.
3.1 Notation
Let us introduce the notation of the problem used
hereafter in the paper.
N: number of OR sessions,
S
j
: duration of j-th OR session,
d
j
: day of the week (from Monday to Friday) of the
j-th OR session,
B
k
: number of beds available the k-th day of the week
(k = 1, ..., 7 such that k = 1 is Monday, k = 5 is
Friday, k = 7 is Sunday),
I: set of patients in the pre-admission waiting list,
L: set of scheduled patients,
L
( j)
: set of patients scheduled into the j-th OR ses-
sion,
t
i
: waiting time of the i-th patient,
M
i
: MTBT of patient i,
e
i
: EOT of patient i,
r
i
: ROT of patient i,
`
i
: LOS of patient i,
Ω: weekly overtime available.
4 THE HYBRID MODEL
This section discusses the hybrid simulation opti-
mization model proposed in this paper. Simulation
allows to deal with the inherent stochasticity of the
problem while optimization allows to deal with the
three problems arising in the three phases depicted
in Section 3. In the following, we will briefly de-
scribe the hybrid model through the description of its
main components, that is the Discrete Event Simula-
tion (DES) simulation framework and the three opti-
mization modules.
Note that the hybrid model is implemented using
AnyLogic 6.9 (Borshchev, 2013). The Enterprise Li-
brary is exploited for the implementation of the DES
simulation framework whilst the optimization mod-
ules are implemented from scratch using Java exploit-
ing the fact that AnyLogic is build on the top of an
Eclipse platform.
4.1 The Simulation Framework
The simulation framework is based on a DES method-
ology. It is a straightforward implementation of the
surgical pathway depicted in Figures 1, 2 and 3. The
main parameters of the simulation model and their
distribution are depicted in the Appendix.
4.2 The Advanced Scheduling Problem
As reported in Section 2, several approaches have
been proposed. Here, we proposed a simple meta-
heuristic based on a greedy construction of an initial
solution and then a local search to improve that solu-
tion. Note that we should take into account the fact
that the resources available can be reduced since pa-
tients admitted the previous week are already in the
hospital phase, usually waiting for the discharge but
also for their surgical intervention.
4.2.1 Constructive Greedy Algorithm
The algorithm associates to each patient i ∈I the fol-
lowing values
w
i
=
t
i
+ min
1≤j≤N
d
j
M
i
, (1)
˜w
i
=
t
i
+ min
1≤j≤N
d
j
+ 7
M
i
= w
i
+
7
M
i
. (2)
w
i
measures the ratio of the time elapsed before the
surgical intervention and the MTBT associated to the
URG of the patient i ∈I whilst ˜w
i
is the same meaning
but referred to the next week.
Patients are ordered by decreasing value of w
i
in
such a way to promote the scheduling of those pa-
tients which are close to their MTBT. Then, each pa-
tient is considered for the scheduling. A patient will
be inserted in the current schedule if there exist an
OR session available with enough free operating time
in such a way to satisfy the operative constraints re-
garding the bed occupation and the operating time S
j
.
Among different possible OR sessions, the algo-
rithm tries to schedule the patient first in a day k such
that k + `
i
≤5. If it is not possible, the algorithm tries
the insertion in a day k such that k + `
i
> 5. The ratio-
nale here is to avoid the use of the weekend stay beds
which are usually a limited resource. This rule can be
overridden when ˜w
i
≥ 1 assigning the patient to the
first day k = 1, if possible, or to the second day k = 2,
and so on. In this case, we would like to reduce the
probability to do not satisfy the URG requirements in
case of cancellation.
SIMULTECH2014-4thInternationalConferenceonSimulationandModelingMethodologies,Technologiesand
Applications
892

Finally, if a patient cannot be scheduled, the al-
gorithm will consider the next patient. The algorithm
terminates when all patient are considered for the in-
sertion in the schedule.
4.2.2 Improvement Local Search Algorithm
The Local Search tries to improve the solution com-
puted by the greedy exchanging pairs of patients al-
ready scheduled in such a way to cluster them in a
reduced number of OR sessions and, by consequence,
to allow the insertion of new patients previously not
scheduled. Le us consider the OR session j
∗
having
the maximum operating time yet available, that is the
one having the minimal utilization. The Local Search
algorithm follows these criteria to select a new solu-
tion when exploring the neighbourhood:
• the new solution will be that providing the maxi-
mal increase of the time yet available of j
∗
;
• otherwise, if the two schedules are equivalent in
j
∗
, the algorithm will considers the second one
less utilized OR session, and so on;
• otherwise, if the two schedules are equivalent in
all OR sessions, the algorithm selects those solu-
tions having OR sessions less utilized at the end
of the week.
4.3 The Allocation Scheduling Problem
In our settings, the allocation scheduling problem
consists in establishing the order in which patients
i ∈L
( j)
will be operated on. For this reason, it is also
called sequencing problem. The main objective is to
minimize the inefficiency due to possible cancella-
tions. Note that the real time management – depicted
in Section 4.4 – will be devoted to the minimization
of the number of cancellations, that is to minimize the
number of patients re-scheduled due to a delay.
Considering a given schedule, there is a set of pa-
tients for which is better to avoid the cancellation of
their surgical intervention, that is those patients whose
˜w
i
is greater than or equal to 1 and those patients
whose their intervention was already postponed. To
deal with these special cases, let us introduce the fol-
lowing values:
W
i
=
(
˜w
i
if ˜w
i
> 1
0 otherwise
, (3)
and D
i
> 0 is the number of days elapsed after a can-
cellation, 0 otherwise. Finally, we define the value
s
i
= α
1
W
i
+ α
2
D
i
+ α
3
e
i
(4)
for each i ∈ L
( j)
where α are parameters. Setting
α
1
α
2
α
3
=
(
1 case (A)
0 case (B)
,
the sequencing of patients i ∈ L
( j)
is simply obtained
by ordering them by the decreasing order of the asso-
ciated s
i
.
The use of α imposes a three levels of priorities.
First we schedule patients whose intervention was
previously postponed, and then the others. Among
those postponed, first we schedule those close to their
MTBT and, in case of same value, those waiting for
more days after the previous cancellation. Finally.
when the first two components of s
i
, that is α
1
W
i
and
α
2
D
i
, yield to the same value for two different pa-
tients, we break ties by ordering them following a
LPT or a SPT policy (with respect to EOT) in the case
(A) and in the case (B), respectively.
4.4 Operating Room Real Time
Management
During the execution of the operating room plan,
it could be happen that the EOT differs from ROT.
When r
i
> e
i
, for a patient i ∈ L
( j)
, the whole plan
will be delayed. When the overall delay could de-
termine the exceeding of the jth OR session duration
S
j
, the operating room real time management should
deal with the problem of postponing an intervention
or to use a part of the available overtime. Such a de-
cision poses the problem of evaluating the impact of
consuming overtime or to have a cancellation.
Let us consider the jth OR session on day k = d
j
having duration S
j
and a list L
( j)
of scheduled and
sequenced patients. We suppose that m <
L
( j)
pa-
tients are already operated on. Let ρ
m
the effective
time elapsed to operate on the m patients, that is
ρ
m
=
∑
i=i
1
,...,i
m
r
i
. (5)
Setting ρ
m
= t, let us introduce the following param-
eter:
β
j
kt
=
1 +
N
k
N
−
Ω
j
kt
Ω
!
(6)
where N
k
is the number of OR sessions from the day
after k and Ω
j
kt
is the remaining overtime after the in-
tervention of patient i
m
.
The value β
j
kt
would like to measure the overtime
still available with respect to the number of OR ses-
sions to be still performed. Actually, β
j
kt
is closed to
1 when the overtime has been used proportionally; it
is between 0 and 1 or it is greater than 1 when it is
underused or overused, respectively. Because of N
k
is
equal to 0, we remark that the last day of the week it
is always less than or equal to 1 hence promoting the
use of overtime.
AHybridModelfortheAnalysisofaSurgicalPathway
893

The real time management is activated whenever
ρ
m
>
∑
i=i
1
,...,i
m
e
i
after operating the last patient. After checking the se-
quencing of the remaining patients, the decision of
postponing or assigning overtime could be taken.
The sequencing is checked in such a way to en-
sure that (i) all the remaining patients having ˜w
i
> 1
are scheduled prior to the other patients and (ii) those
having ˜w
i
> 1 are ordered by decreasing value of ˜w
i
.
Let i
m+1
be the next patient in the schedule. Then,
if
e
i
m+1
> S
j
−ρ
m
,
the patient i
m+1
could incur in a cancellation. There-
fore, the real time management algorithm checks if
β
j
d
j
,ρ
m
e
i
m+1
+ ρ
m
S
j
≤ 1 (7)
and if (7) is satisfied, the required overtime is assigned
to patient i
m+1
.
Finally, we implemented an algorithm that runs at
the end of the day and it is responsible to reschedule
the next day all the postponed surgical interventions.
The algorithm tries to insert an intervention with EOT
e
i
in the jth OR session planned in the next days in
such a way to minimize the difference between S
j
and
the sum of the EOTs of the already assigned patients
plus e
i
. If an insertion is not possible, the patient will
be scheduled next week.
5 MODEL VALIDATION
The validation of a simulation model requires a quite
complex analysis. In our case, we are interested in the
logical correctness of the simulation model represent-
ing the surgical pathway while we are not interested
in the replication of a real system.
To this purpose, we adapted our simulation model
to represent the inspiring case, that is that reported
in (Ozcan et al., 2011). In that paper, the proposed
model dealt with two patient flows having similar
EOT but different LOS. Note that the LOS of the sec-
ond flow is roughly the double of the first one while
the number of patients in the first flow is roughly the
double of the second flow. Since our model deals with
only one patient flow, we adapted our patient flow
generator in such a way to have, on average, the same
number of patients having the LOS of the first flow
which is the most numerous. Furthermore, we turn
off all the optimization during the three phases. The
other parameters are reported in the Appendix.
Let us introduce the following performance in-
dices: u
bed
is the bed utilization whilst u
OR
is the OR
session utilization. Table 1 reports the results of the
comparisons with respect to the measures
1
of the sys-
tem modelled in (Ozcan et al., 2011). Our results are
the average value over those obtained by running the
hybrid model 30 times with different starting condi-
tions. Each of these computational experiments runs
for a time horizon of 2 years but collecting data only
in the second year.
Table 1: Model validation: comparison with real measures.
u
bed
u
OR
Real measures 51.10% 77.33%
Simulation model 49.10% 80.82%
Difference 2.00% 3.49%
The differences in the two performance indices
can be accounted to the different composition of the
patient flow as depicted above. For instances, the gap
of 3.49% for u
OR
expressed in minutes corresponds
to the execution of an intervention having average du-
ration. On the basis of these considerations, the com-
parison is satisfactory with respect to our objective,
that is the validation of the logical correctness of our
simulation model.
6 IMPACT OF THE
OPTIMIZATION
In this Section we would like to evaluate the impact of
the optimization modules integrated in the simulation
model. To this purpose, we need to define a baseline
configuration with respect to the three phases as fol-
lows:
Phase 1: advanced scheduling performed by a first-
fit algorithm, that is (i) consider patients by de-
creasing order of w
i
, (ii) place a patient in the first
OR session available from Monday to Friday;
Phase 2: patients are sequenced in a random order;
Phase 3: overtime is assigned a priori uniformly to
all OR sessions;
Phase 3: interventions rescheduled only at the end of
the day using a first-fit algorithm.
The simulation parameters are depicted in the Ap-
pendix.
1
Taken from the presentation made by the authors at the
ORAHS 2012 conference.
SIMULTECH2014-4thInternationalConferenceonSimulationandModelingMethodologies,Technologiesand
Applications
894

Table 2: Performance indices for each test configurations.
Option(s) Performance indices
id 1 2 3 seq. A B C f
MTBT
I
avg
t
avg
U
bed
U
OR
w
avg
w
max
(0) baseline configuration 234 (2348) 32.63% 338 55 63.61% 89.88% 1.17 4.05
(1)
√
235 (2347) 31.85% 346 56 60.20% 89.78% 1.11 3.29
(2)
√ √
226 (2340) 25.97% 360 58 60.57% 89.32% 1.16 3.27
(3)
√
252 (2346) 35.95% 324 52 60.35% 89.60% 1.12 3.61
(4)
√ √
246 (2349) 35.34% 330 53 60.26% 89.78% 1.06 3.41
(5)
√ √ √
230 (2338) 27.17% 355 58 60.79% 89.55% 1.17 3.10
(6) LPT 236 (2367) 47.85% 292 48 60.52% 90.76% 1.03 3.79
(7) SPT 240 (2261) 12.14% 452 72 58.57% 86.35% 1.51 4.91
(8)
√
197 (2384) 74.62% 213 35 59.26% 91.34% 0.80 2.64
(9)
√
236 (2315) 30.70% 339 55 72.56% 88.79% 1.18 3.79
(10)
√ √
222 (2372) 72.97% 223 37 64.16% 90.65% 0.83 2.68
(11)
√
LPT
√
239 (2389) 79.91% 192 32 60.27% 91.75% 0.73 2.62
(12)
√ √
LPT
√
248 (2390) 85.53% 207 34 60.58% 91.78% 0.71 1.87
6.1 Test Configurations and
Performance Indices
Here we define the various configurations we used to
evaluate the impact of the optimization tools. Each
configuration is defined with respect to the baseline
configuration previously defined.
• Phase 1:
option 1: computing w
i
w.r.t Monday instead of
the previous Friday;
option 2: adopting the greedy depicted in Sec-
tion 4.2.1 (instead of the first-fit algorithm);
option 3: adopting the Local Search depicted in
Section 4.2.2;
• Phase 2:
LPT/SPT: use LPT or SPT rules in sequencing
(case (A) or (B) in Section 4.3);
• Phase 3:
option A: adopting real time management after
each interventions;
option B: adopting the algorithm depicted in
Section 4.4 for rescheduling patients at the end
of the day (instead of the first-fit algorithm).
Finally, we introduce all the performance indices used
in the following analysis, that is the patient-centred
indices:
C: number of cancellations,
f
MTBT
: percentage of patients operated within the
MTBT,
I
avg
: average length (number of patients) of the wait-
ing list,
t
avg
: average waiting time spent in the waiting list,
w
avg
: average value of patient’s w
i
at the time of their
surgery,
w
max
: maximum value of patient’s w
i
at the time of
their surgery,
and the facility-centred indices:
u
bed
: bed utilization,
u
OR
: OR session utilization.
It is quite evident that different indices can affect each
other. For instance, the increase of the number of
cancellations can affect the bed utilization and, in its
turn, can reduce the percentage of patients operated
within the MTBT. Our aim is to identify a test con-
figuration which increases the patient-centred indices
without deteriorating the facility-centred ones.
6.2 Quantitative Analysis
As reported for the model validation, the reported re-
sults are the average value among those obtained by
running the hybrid model 30 times on a given config-
uration and, each time, starting from a different initial
condition.
First, the impact of each optimization modules is
evaluated through the quantitative analysis. Based on
these results, two further configurations are studied.
The results of such analysis are summarized in Ta-
ble 2 which reports the value of the performance in-
dices for each test configurations denoted by the value
in the first column “id”. Note that the column report-
ing the number of cancellations also reports in brack-
ets the total number of patients operated on. All the
analysis are compared with the baseline configura-
tion.
Regarding the impact of the advanced scheduling
optimization module, we can observe a lower wait-
ing time in the waiting list and an improvement of the
performance indices related to MTBT in test config-
urations (3) and (4). On the other side, the minimal
number of cancellations is obtained with configura-
tion (2) but, at the same time, the percentage of pa-
tients operated on before their MTBT decreases con-
sistently. Note that the use of Local Search allows
to insert more patients determining the improvement
measured in (3) and (4).
AHybridModelfortheAnalysisofaSurgicalPathway
895
0 20 40
60
80 100 120 140
160
180 200 220 240
260
280 300 320 340
360
0
200
400
baseline
LPT
SPT
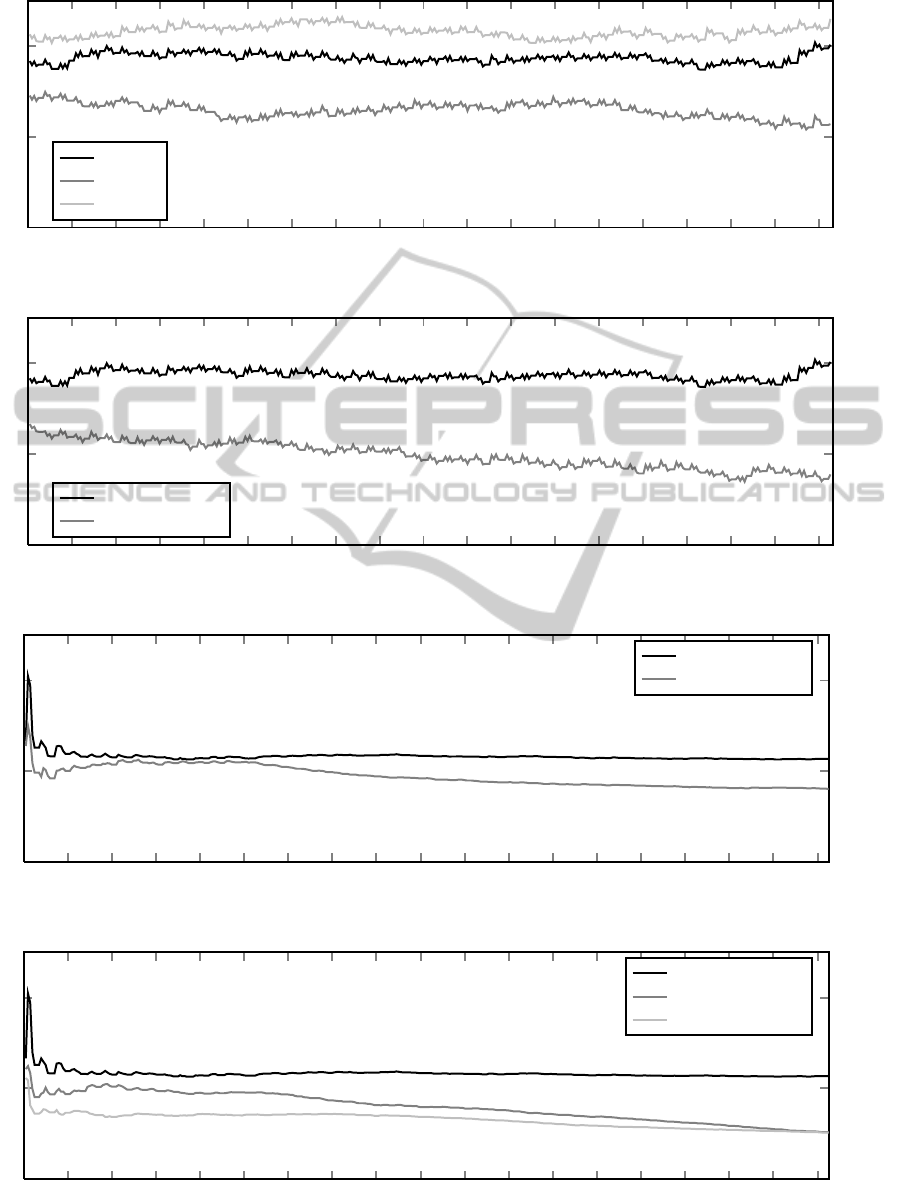
Figure 4: Trend of I
avg
(data referred to the 2nd year, days on x-axis, patients on y-axis).
0 20 40
60
80 100 120 140
160
180 200 220 240
260
280 300 320 340
360
0
200
400
baseline
configuration (8)
Figure 5: Trend of I
avg
(data referred to the 2nd year, days on x-axis, patients on y-axis).
0 20 40
60
80 100 120 140
160
180 200 220 240
260
280 300 320 340
360
0.5
1
1.5
baseline
configuration (8)
Figure 6: Trend of w
avg
(data referred to the 2nd year, days on x-axis, patients on y-axis).
0 20 40
60
80 100 120 140
160
180 200 220 240
260
280 300 320 340
360
0.5
1
1.5
baseline
configuration (11)
configuration (12)
Figure 7: Trend of w
avg
(data referred to the 2nd year, days on x-axis, patients on y-axis).
SIMULTECH2014-4thInternationalConferenceonSimulationandModelingMethodologies,Technologiesand
Applications
896

Regarding the impact of the allocation schedule
optimization module, we can observe a significant
better performances when LPT policy is adopted. Fig-
ure 4 shows the trend of I
avg
under the baseline, (6)
and (7) configurations.
Regarding the impact of the operating room real
time management module, we observe a remarkable
improvement of all the performance indices (see con-
figurations (8) and in particular f
MTBT
). On the other
side, we observe the negligible impact of the algo-
rithm for the rescheduling postponed patients at the
end of the day (see configurations (9) and (10)). Fig-
ure 5 and 6 show respectively the trend of I
avg
and
w
avg
under the baseline and (8) configurations. Note
that it is positive when w
avg
< 1 which means that, on
average, all the patients are operated on before their
MTBT.
Finally, configurations (11) and (12) report about
the combination of the different options. We note a
further improvement of the performance indices ex-
cept for that related to the number of cancellations if
compared with configuration (8). This is due to the
fact that Local Search allows to insert more patients
in the advanced scheduling thus reducing the wait-
ing time in the waiting list but increasing the proba-
bility of incurring in a cancellation. Figure 7 shows
the trend of w
avg
under the baseline, (11) and (12)
configurations. While baseline configuration shows
a value of w
avg
always greater than 1, we remark that
both configurations (11) and (12) tend to be less than
1. Further, configuration (12) seems more stable and
powerful in reducing this indices.
7 CONCLUSIONS
In this paper we proposed a hybrid simulation and op-
timization model for the analysis of a surgical path-
way from a patient-centred point of view: simulation
is used to generate a real situation with respect to
the inherent stochasticity of the problem while opti-
mization is used to take the best decisions in different
points of the surgical pathway.
The quantitative analysis discussed in Section 6
shown the positive impact of the optimization in the
management of the surgical pathway. In particular,
the most effective optimization module is the operat-
ing room real time management determining a general
improvement of all the performance indices with re-
spect to a baseline configuration of the surgical path-
way.
Comparing the baseline configuration with con-
figurations (11) and (12) we can observe a great im-
provement of the performance indices related to the
waiting list in terms of its length and the waiting
time. This allow to double (at least) the percent-
age of the patients operated on before their MTBT
time limit. These improvements can determine a gen-
eral improvement of the quality of service from a
patient-centred point of view without deteriorating the
facility-centred performance indices.
The quantitative analysis confirms the trade-off
between the number of cancellations and the number
of operated patients (or, equivalently, the OR session
utilization) as discussed in (Beaulieu et al., 2012).
From this point of view, the proposed hybrid model
could help the hospital management in the evaluation
of this trade-off.
ACKNOWLEDGEMENTS
Authors acknowledge support from the Italian Min-
istry of Education, University and Research (MIUR),
under the grant n. RBFR08IKSB, “Firb – Futuro in
Ricerca 2008”. Finally, the authors wish to thank the
anonymous referees for their comments which helped
in improving the paper.
REFERENCES
Adan, I., Bekkers, J., Dellaert, N., Jeunet, J., and Visserd, J.
(2011). Improving operational effectiveness of tactical
master plans for emergency and elective patients un-
der stochastic demand and capacitated resources. Eu-
ropean Journal of Operational Research, 213(1):290–
308.
Aringhieri, R., Addis, B., T
`
anfani, E., and Testi, A. (2012).
Clinical pathways: Insights from a multidisciplinary
literature survey. In Proceedings ORAHS 2012. ISBN
978-90-365-3396-6.
Batun, S., Denton, B., Huschka, T., and Schaefer, A. (2011).
Operating room pooling and parallel surgery process-
ing under uncertainty. INFORMS Journal of Comput-
ing, 23(2):220–237.
Beaulieu, I., Gendreau, M., and Soriano, P. (2012). Oper-
ating rooms scheduling under uncertainty. In T
`
anfani,
E. and Testi, A., editors, Advanced Decision Making
Methods Applied to Health Care, volume 173 of In-
ternational Series in Operations Research & Manage-
ment Science, pages 13–32. Springer Milan.
Beli
¨
en, J. and Demeulemeester, E. (2007). Building cyclic
master surgery schedules with leveled resulting bed
occupancy. European Journal of Operational Re-
search, 176:1185–1204.
Borshchev, A. (2013). The Big Book of Simulation Mod-
eling. Multimethod Modeling with AnyLogic 6. ISBN
978-0-9895731-7-7.
AHybridModelfortheAnalysisofaSurgicalPathway
897

Campbell, H., Bradshaw, N., and Porteous, M. (1998).
Integrated care pathways. British Medical Journal,
316(133-144).
Cardoen, B., Demeulemeester, E., and Beli
¨
en, J. (2009).
Sequencing surgical cases in a day-care environment:
An exact branch-and-price approach. Computers &
Operations Research, 36(9):2660–2669.
Cardoen, B., Demeulemeester, E., and Beli
¨
en, J. (2010).
Operating room planning and scheduling: A literature
review. European Journal of Operational Research,
201:921–932.
De Bleser, L., Depreitere, R., De Waele, K., Vanhaecht, K.,
Vlayen, J., and Sermeus, W. (2006). Defining path-
ways. Journal of Nursing Management, 14(553-563).
Fei, H., Chu, C., Meskens, N., and Artiba, A. (2008). Solv-
ing surgical cases assignment problem by a branch-
and-price approach. International Journal of Produc-
tion Economics, 112:96–108.
Guerriero, F. and Guido, R. (2011). Operational research
in the management of the operating theatre: a survey.
Health Care Management Science, 14:89–114.
Guinet, A. and Chaabane, S. (2003). Operating theatre plan-
ning. International Journal of Production Economics,
85:69–81.
Hans, E., Wullink, G., van Houdenhoven, M., and
Kamezier, G. (2008). Robust surgery loading. Eu-
ropean Journal of Operational Research, 185:1038–
1050.
Herring, W. and Herrmann, J. (2011). A stochastic dynamic
program for the single-day surgery scheduling prob-
lem. IIE Transactions on Healthcare Systems Engi-
neering, 4:213–225.
Herring, W. and Herrmann, J. (2012). The single-day
surgery scheduling problem: sequential decision-
making and threshold-based heuristics. OR Spectrum,
34:429–459.
Jebali, A., Alouane, A., Ladet, P., and Roland, C. (2006).
Operating rooms scheduling. International Journal of
Production Economics, 99:52–62.
Lamiri, M., Xie, X., Dolgui, A., and Grimaud, F. (2008).
A stochastic model for operating room planning with
elective and emergency demand for surgery. Journal
of Operational Research Society, 185:1026–1037.
M, L., X, X., A, D., and F, G. (2009). Optimization meth-
ods for a stochastic surgery planning problem. Inter-
national Journal of Production Economics, 120:400–
410.
Magerlein, J. and Martin, J. (1978). Surgical demand
scheduling: A review. Health Services Research,
13:418–433.
Marques, I., Captivo, M., and Pato, M. (2012). An integer
programming approach to elective surgery scheduling.
OR Spectrum, 34:407–427.
May, J., Strum, D., and Vargas, L. (2000). Fitting the log-
normal distribution to surgical procedure times. Deci-
sion Sciences, 31(1):129–148.
Meskens, N., Duvivier, D., and Hanset, A. (2013).
Multi-objective operating room scheduling consider-
ing desiderata of the surgical teams. Decision Support
Systems, 55:650–659.
Min, D. and Yih, Y. (2010). Scheduling elective surgery un-
der uncertainty and downstream capacity constraints.
European Journal of Operational Research, 206:642–
652.
Ozcan, Y., T
`
anfani, E., and Testi, A. (2011). A simulation-
based modeling framework to deal woth clinical path-
ways. In Jain, S., Creasey, R., Himmelspach, J.,
White, K., and Fu, M., editors, Proceedings of the
2011 Winter Simulation Conference, pages 1190–
1201.
Ozkarahan, I. (2000). Allocation of surgeries to operating
rooms using goal programming. Journal of Medical
Systems, 24(6):339–378.
Panella, M., Marchisio, S., and Stanislao, F. (2003). Re-
ducing clinical variations with clinical pathways: Do
pathways work? International Journal for Quality in
Health Care, 15:509–521.
Persson, M. and Persson, J. (2010). Analysing management
policies for operating room planning using simulation.
Health Care Management Science, 13:182–191.
Pham, D. and Klinkert, A. (2008). Surgical case scheduling
as a generalized job shop scheduling problem. Eu-
ropean Journal of Operational Research, 185:1011–
1025.
Riise, A. and Burke, E. (2011). Local search for the surgery
admission planning problem. Journal of Heuristics,
17(4):389–414.
Rizk, C. and Arnaout, J. (2012). Aco for the surgical cases
assignment problem. Journal of Medical Systems,
36:1191–1199.
Roland, B., Martinelly, C., Riane, F., and Pochet, Y. (2010).
Scheduling an operating theatre under human resource
constraints. Computers & Industrial Engineering,
58:212–220.
Rotter, T., Kinsman, L., James, E., Machotta, A., Gothe,
H., Willis, J., Snow, P., and Kugler, J. (2010). Clini-
cal pathways: effects on professional practice, patient
outcomes, length of stay and hospital costs (review).
The Cochrane Library, 7.
Shylo, O., Prokopyev, O., and Schaefer, A. (2013). Stochas-
tic operating room scheduling for high-volume spe-
cialties under block booking. INFORMS Journal of
Computing, 25(4):682–692.
Sobolev, B., Sanchez, V., and Vasilakis, C. (2011). System-
atic review of the use of computer simulation model-
ing of patient flow in surgical care. Journal of Medical
Systems, 35:1–16.
Spangler, W., Strum, D., Vargas, L., and Jerrold, H. (2004).
Estimating procedure times for surgeries by deter-
mining location parameters for the lognormal model.
Health Care Management Science, 7:97–104.
Strum, D., May, J., and Vargas, L. (2000). Modeling the
uncertainty of surgical procedure times: Comparison
of lognormal and normal models. Anesthesiology,
92(4):1160–1167.
T
`
anfani, E. and Testi, A. (2010). A pre-assignment heuris-
tic algorithm for the master surgical schedule problem
(mssp). Annals of Operations Research, 178(1):105–
119.
SIMULTECH2014-4thInternationalConferenceonSimulationandModelingMethodologies,Technologiesand
Applications
898

T
`
anfani, E., Testi, A., and Alvarez, R. (2010). Operating
room planning considering stochastic surgery dura-
tions. International Journal of Health Management
and Information, 1(2):167–183.
Testi, A., T
`
anfani, E., and Torre, G. (2007). A three-phase
approach for operating theatre schedules. Health Care
Management Science, 10:163–172.
APPENDIX
In this appendix, we report the parameters of the
simulation framework and their setting for the model
validation (Section 5) and for the quantitative analysis
(Section 6). In brackets, the unit of measure.
Flow and patient characteristics:
r
0
: patient interarrival rate [patients/minutes],
R
0
: initial length of the pre-admission waiting list
[patients],
p
1
: patient probability to require a surgical treat-
ment during the ambulatory visit (see Fig. 1),
p
2
: patient probability to do not require a surgi-
cal treatment but requiring further exams dur-
ing the ambulatory visit (see Fig. 1),
p
A
,. .. , p
G
: patient probability to belong into the
urgency class A,. . .,G.
Duration of activities:
T
min,avg,mod
A,...,F,I
: minimum, average and modal time
for the execution of A,. . .,F,I [minutes] (see
Figures 1–3),
`
min, max, mod; A,.. .,G
: minimum, maximum and
modal LOS for patients belonging to the ur-
gency class A,...,G [days],
¯
ε
A,...,G
: average EOT for the surgical interven-
tion of a patient belonging to the urgency class
A,.. .,G [minutes],
e
max
: maximum duration of a surgery [minutes],
σ
A,...,G
: EOT standard deviation [minutes],
σ: ROT standard deviation for each patient [min-
utes],
τ: tolerance time within which the surgical team
operates a patient at the end of OR session with-
out resorting to the overtime [minutes].
Table 3 shows the distributions used to generate
the required time for the execution of the activities
A,.. .,J. Table 4 reports the values assigned to the pa-
rameters for the model validation and for the quanti-
tative analysis.
The parameters k and ϑ for the Gamma distribu-
tions (see Table 3) were obtained from the empirical
data reported (Ozcan et al., 2011), requiring that the
expected and the modal values of these distributions
coincide with the empirical values reported in that pa-
per. Further, we compute the value of the survival
function on the maximum time for the execution of
activities (always reported in the paper), obtaining a
value less than 10%.
The choice to use a lognormal distribution derives
from the literature (see, e.g., (Strum et al., 2000; May
et al., 2000; Spangler et al., 2004)).
AHybridModelfortheAnalysisofaSurgicalPathway
899

Table 3: Distribution of the activity durations.
Activities Durations Parameters
A,.. ., F, I T
A,.. .,F,I
min
+ T, k = T
A,...,F,I
avg
−T
A,...,F,I
mod
,
T ∼Gamma(k,ϑ) ϑ =
T
A,...,F,I
avg
−T
A,...,F,I
min
T
A,...,F,I
avg
−T
A,...,F,I
mod
H (LOS) bTriangular(l
min; A,.. .,G
,l
max; A,.. .,G
,l
mod; A,.. .,G
) +
1
2
c
J (EOT) min
max
b
T
u
+
1
2
cu,0
,e
max
, µ = log ε
A,. . . ,G
−
1
2
log
σ
2
A,...,G
ε
2
A,...,G
+ 1
,
T ∼Lognormal(µ, s
2
) s =
s
log
σ
2
A,...,G
ε
2
A,...,G
+ 1
J (ROT) min
{
max
{
0,T
}
,e
max
}
,
T ∼Gaussian(EOT, σ
2
)
Table 4: Parameters used in the simulation framework.
Parameters unit of measure Validation Quantitative analysis
r
0
patients/minutes 5.8 ·10
−3
2.0 ·10
−2
R
0
patients 140 420
p
1
, p
2
0.2, 0.1 0.2, 0.1
p
A
,. .. , p
G
0.0245,0.1401, 0.4136,0.1785 0.0245, 0.1401,0.4136, 0.1785
0.1140,0.0749, 0.0544 0.1140,0.0749, 0.0544
T
A,...,F,I
min
minutes 5,25,25, 25, 40, 25, 35 5,25, 25,25, 40,25, 35
T
A,...,F,I
avg
minutes 7.5,31.5, 31,28, 62.5,32, 41 7.5,31.5, 31,28, 62.5,32, 41
T
A,...,F,I
mod
minutes 6,30,26, 25, 50, 30, 40 6,30, 26,25, 50,30, 40
`
min; A,.. .,G
days 2,1, 1,1, 1,1, 1 2,1, 1,1, 1,1, 1
`
max; A,.. .,G
days 29,16, 7,9, 5,5, 5 29,16, 7,9, 5,5, 5
`
mod; A,.. .,G
days 3,2, 2,2, 2,2, 2 3,2, 2,2, 2,2, 2
e
max
minutes 360 420
¯
ε
A,...,G
minutes 145,171, 149,153, 171,164, 166 145,171, 149,153, 171,164, 166
σ
A,...,G
minutes 85,85, 66,60, 61,51, 60 85,85, 66,60, 61,51, 60
σ minutes 0 30
τ minutes 30 10
Ω minutes 0 300
u minutes 30 30
N 7 21
S
1
,. .. ,S
N
minutes 360,360, 360,360, 360,360, 360 300,360, 420,420, 420,300, 360
420,420, 300,360, 420,300, 360
420,420, 420,300, 360,420, 420
d
1
,. .. ,d
N
2,2, 3,3, 4,4, 5 1,1, 1,1, 1,2, 2,2, 2,3, 3,3
4,4, 4,4, 4,5, 5,5, 5
B
1
,. .. ,B
7
beds 18,18, 18,18, 18,18, 18 50,50, 50,50, 50,35, 35
M
URG A,...,URG G
days 8,15, 30,60, 90,120, 180 8,15, 30,60, 90,120, 180
SIMULTECH2014-4thInternationalConferenceonSimulationandModelingMethodologies,Technologiesand
Applications
900
