
Overall Equipment Effectiveness and Overall Line Efficiency
Measurement using Fuzzy Inference Systems
Hasan Moradizadeh and Rene V. Mayorga
Faculty of Engineering, University of Regina, Regina, Canada
Keywords: Intelligent Systems, Fuzzy Inference Systems, Overall Equipment Effectiveness, Overall Line Efficiency,
Six Major Losses in Industry.
Abstract: Increasingly, Intelligent Systems (IS) techniques are being used to solve both complex problems and
industrial problems with uncertainty. They also can implement the operator’s knowledge (experience) into
the system. This Paper aims to improve and compute the well-known manufacturing metrics: the Overall
Equipment Effectiveness (OEE), and Overall Line Efficiency (OLE), using IS techniques. The proposed
methodologies to improve the OEE and OLE weakness are based on Fuzzy Inference Systems. These
techniques result in an effective way to measure OEE and OLE considering different weight of losses and
also the difference in machine’s weight factors. Moreover, they allow the operator’s knowledge to be taken
into account in the measurement using uncertain input and output with implementation of linguistic terms.
1 INTRODUCTION
In the existing intense competitive economic
environment, manufacturing plants intend to reduce
their manufacturing costs as well as maintaining the
quality of their products. Total Productive
Maintenance (TPM) is normally implemented to
optimize the manufacturing equipment effectiveness
and improve their reliability as a result of
eliminating six major losses in industry (I.P.S. Ahuja
and J.S. Khamba, 2008). These losses include
breakdown, adjustment losses, idle times and small
stops, start up and yield, and defect and rework.
Overall Equipment Effectiveness (OEE) is one of
the most important TPM’s key performance
indicators that has been increasingly used in industry
not only for controlling and monitoring the
productivity of production equipment but also as an
indicator and driver of process and performance
improvements (Jose Arturo Garza-Reyes et al.,
2010). Overall Line Efficiency (OLE) is also being
used to show how well a manufacturing line is
running compared to how well it could be running.
This metric take into account each of the machine’s
OEE.
Recent studies (D. Kotze, 1993; M. Lesshammar,
1999; R. Wudhikarn and W. Manopiniwes, 2010)
been done and major improvements have been
achieved to measure OEE; however this metric has
some flaws. First, for continuous flow processes
such as oil refinery, metal smelting and power
stations calculating the performance rate is more
difficult due to lack of cycle time of their products.
Also weighting of each OEE element is different in
different industries or processes. For example
quality losses may have a different contribution in
OEE in processes where the material is expensive
and the product cannot be reworked rather than in
manufacturing line with short cycle time and cheap
raw material. Also operator/user knowledge can be
implementing in measuring OEE using linguistic
term in Fuzzy Inference Systems. Furthermore, OLE
cannot be measured easily in complex
manufacturing lines where each machine has a
different weight factor. As an example, an
unbalanced manufacturing line is assumed. A
machine that is the bottleneck has a more effect on
the line efficiency rather than a machine that barely
operates.
This study aims to improve and calculate the
OEE and OLE weaknesses by implementing
Intelligent Systems (IS) techniques. To do so, the
proposed methodology is presented and its
experimental results are analyzed.
199
Moradizadeh H. and Mayorga R..
Overall Equipment Effectiveness and Overall Line Efficiency Measurement using Fuzzy Inference Systems.
DOI: 10.5220/0005155101990204
In Proceedings of the International Conference on Fuzzy Computation Theory and Applications (FCTA-2014), pages 199-204
ISBN: 978-989-758-053-6
Copyright
c
2014 SCITEPRESS (Science and Technology Publications, Lda.)

2 OEE & OLE
Overall Equipment Effectiveness (OEE) can be
implemented to benchmark, analyze and improve a
production process by measuring inefficiencies and
groups them in different categories (B. Dal et al.,
2000). The most common inefficiency causes in
industry are those called “six big losses.” These
losses can be categorized in downtime losses, speed
losses, and quality losses. To find a way to monitor
and improve a manufacturing process, six big losses
are addressed as follows.
(1) Downtime losses: Downtime is the most
important loss for equipment effectiveness
improvement since other metrics cannot be
addressed if the manufacturing process is down.
Tooling failures, unplanned maintenance, equipment
breakdowns are some examples of downtime losses.
(2) Setup and Adjustment: This loss is the time
between the last acceptable part produced before
setup to the first consistent acceptable parts
produced after setup and adjustment. This is often a
set of adjustments to machines and/or equipment in
order to produce a product that meets the standard
requirements.Warm up time and changeovers can be
represented as setup and adjustment losses in a
manufacturing process. These losses are considered
in calculation of the availability factor.
(3) Small Stops: These stoppages occur when the
machine stops due to a temporary problem such as
an activated sensor that shuts the machine down
automatically. These minor stoppages are usually
less than 10 minutes and can be dealt with by the
operator and generally there is no need to call a
maintenance team.
(4) Reduced Speed: Knowing the ideal cycle time
of a machine and comparing it with the actual cycle
time, it will be possible to monitor low running or
reduced speed losses. Machines may run at the speed
less than the ideal run rate for various reasons.
Training level of operators, and worn equipment can
be categorized as the aforementioned reasons. Small
stops and reduced speed are known as speed losses
and are taken into account in performance factor
calculation.
(5) Start up Rejects: Startup losses occur in the
initial start of a machine up to the stabilization of its
products quality. A root cause analysis can be done
to pinpoint the potential causes of rejects and to
prevent similar losses from occurring in the future. It
is necessary to note that reworks, scraps and
incorrect assembly, all are considered as rejects in
the production processes.
(6) Production Rejects: This loss occurs in a
steady-state production and is not attributed to start
up. Damage, scraps, and reworks, are some
examples of production reject losses.
The last two losses are considered quality losses
and affect the quality factor of OEE.
The traditional method of OEE calculation
considers availably, performance, and quality
factors as follows:
Availability: Availability is the ratio of actual
production time that a machine is working divided
by the time the machine is planned to work.
A=
Operation time
Planned production time
Performance: Performance of a machine is the
percentage of total number of parts on that machine
to its production rate. In simple words, performance
measures the ratio of actual operating speed of the
equipment and the ideal speed (M. Lesshammar,
1999).
P =
Ideal cycle time
Operation time
Total pieces
Quality: To gain insight into the quality aspect of
a production process the quality portion of OEE is
defined. The Quality metric represents good
(acceptable) units produced by machine divided by
the total units produced by that machine in the
production time.
Q=
Acceptable Pieces
Total Pieces
Given the above, the OEE is normally calculated as
follows:
OEE = A × P × Q
Therefore OEE takes into account the six major
losses. Significant improvement can be achieved
within a short period by eliminating these losses in
industry as a result of enhanced maintenance
activities and equipment management (M. Maran et
al., 2012).
In a situation where a manufacturing line
consists of unbalanced/decoupled machines OEE
alone is not sufficient (Braglia et al., 2009). Also
OEE is measured for an isolated individual
equipment and controlling a single tool does not
seem to be effective (Richard Oechsner et al., 2002).
OLE evaluates the line Efficiency in the production
phase and takes into account of effectiveness (OEE)
FCTA2014-InternationalConferenceonFuzzyComputationTheoryandApplications
200

of machines in a manufacturing line. For a
manufacturing line with n machines where all
machines have same weight factors OLE is
computed as:
OLE =
OEE
1
+ OEE
2
+… + OEE
n
n
However, in a case where machines have
different weight factors and cycle times, OLE
calculation is more complex. This study also aims to
improve accuracy of the OLE measurement by
implementing user/expert knowledge into the system
using IS techniques.
3 METHODOLOGY
Implementing Fuzzy Inference Systems in OEE and
OLE measurement as proposed in this Paper it is a
truly novel methodology and offers several
advantages over traditional methods. First,
measurement can be done for all production
processes in different industries regardless of their
products. Moreover, different weight factors can be
allocated to OEE factors involved in the
measurement depending on the process. Also, OLE
can be measured for factories with a variety of
production lines and machines with various weight
factors. In this Paper the Mamdani and Sugeno
Fuzzy Inference Systems are used to improve the
OEE weaknesses and also to take advantage of the
operator’s knowledge of the process. Also Mamdani
FIS is used to measure OLE in unbalanced
manufacturing line where machines have different
contribution in the line efficiency.
3.1 OEE Measurement using Mamdani
FIS:
In this method, availability, performance, and
quality, are calculated based on their associated
losses involved in an equipment effectiveness
reduction. Here Matlab Fuzzy Toolbox is used to
examine the accuracy of the proposed methodology.
In order to complete the OEE measurement, the six
main losses in industry are considered as inputs of
the FIS. As mentioned earlier; breakdowns, and
setup and adjustment are two losses associated with
the availability factor. Small stops and reduced
speed cause inefficiency and performance reduction.
Finally start-up and process rejects are quality losses
that are involved in overall equipment effectiveness.
Given the six losses as inputs, the OEE of the
machine is the sole output of Mamdani FIS System.
Once inputs and output of the system are
determined, the next step for the system to reach its
goal is to set antecedent-consequent (if-then) rules.
Like determining inputs and outputs, operator
experience/knowledge plays an important role in this
step by applying weight factors to each input into the
system. Setting inaccurate rules has a big negative
impact on results. Using linguistic terms [low,
average, high] for input parameters helps to measure
OEE when inputs cannot be measured accurately.
Note that the number of membership functions of
each input is not limited and may be varied depend
on the process and possibility of measuring inputs.
Here 3 Generalized bell-shaped membership
functions [low, average, high] are assigned to each
input and 5 Generalized bell-shaped membership
functions [very low, low, average, high, very high]
are output, here OEE, qualifiers. Center of area
(COA) diffuzification method is used to convert the
fuzzy output to crisp output. Also, 729 if-then rules
are set to represent the real system more accurately.
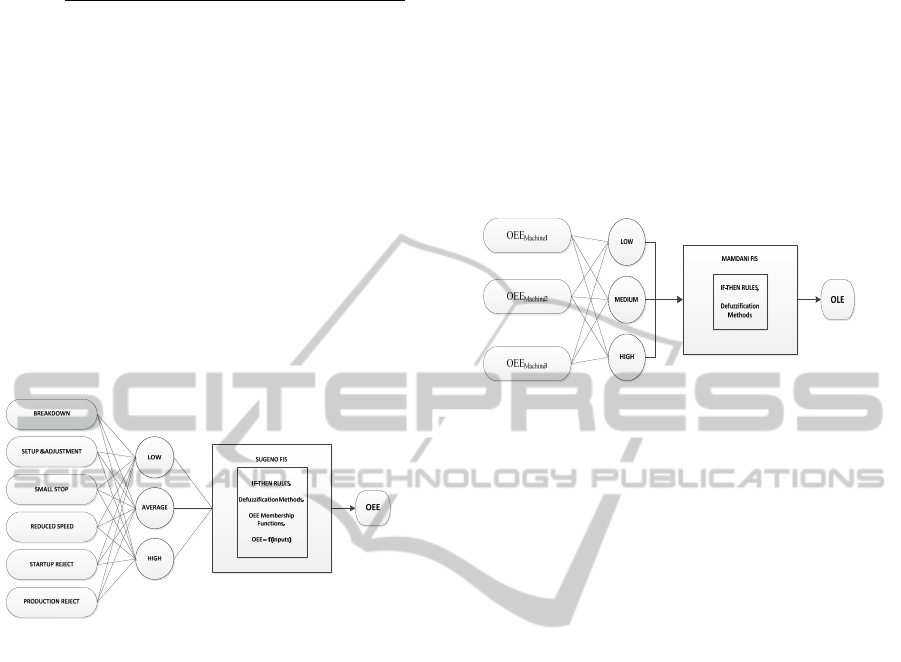
Figure 1: OEE measurement using Mamdani FIS.
3.2 OEE Measurement using Sugeno
FIS:
The Sugeno FIS is also implemented to measure
OEE in processes that weight factor of inputs can be
described in coefficients of an equation. For instance
if all associated inputs of OEE measurement (six big
losses) have the same weight factor, the OEE can be
presented as follows:
OEE=
Brk+Stad+Sml+Red+Str+Prr
6
This can be modeled as a first order Sugeno
fuzzy model. In a case where the quality factor has a
severe impact on OEE; the Sugeno fuzzy Inference
System can be modeled with more concentration on
quality losses as follows:
OverallEquipmentEffectivenessandOverallLineEfficiencyMeasurementusingFuzzyInferenceSystems
201
OEE=
Brk+Stad+Sml+Red+(2xStr)+(4xPrr )
10
Like the Mamdani FIS, Matlab Fuzzy Toolbox is
used here. After determining the inputs and their
weight factors in OEE measurement and also outputs
of the Sugeno FIS; the operator knowledge of the
manufacturing process can be applied to the system
by setting fuzzy if-then rules. This system can be
implemented in the processes where six major losses
(inputs) cannot be measured accurately, however
each input can get a weight factor depends on the
contribution in OEE measurement. In this case 3
generalized bell-shaped membership functions [low,
average, high] are assigned to each input and 3
outputs are considered as functions of inputs and
their weight factors. Also 3 if then rules are set to
represent the real system.
Figure 2: OEE measurement using Sugeno FIS.
3.3 OLE Measurement using Mamdani
FIS:
The OLE can also be calculated, taking into account
each machine’s OEE in the manufacturing line. Due
to complexity of OLE calculation in manufacturing
lines with different types of machines, different
cycle times, and also different weigh factors; Fuzzy
Inference Systems are also proposed here to measure
the Overall Line Efficiency. This method, the
effectiveness (OEE) of every single machine in the
manufacturing line is an input of the FIS. Inputs can
get linguistic terms [low, average, high] that are
presented as Generalized bell membership functions.
Also, OLE is the output of the Mamdani FIS that is
resulted in Fuzzy linguistic terms [low, average,
high] and is diffuzified in crisp output using COA
method. The operator’s knowledge of the system can
be best applied into the FIS with setting accurate if-
then rules that represent the real life system. The
weight factor of each machine in the manufacturing
line can be taken into account in rule setting. For
instance, if we assume a manufacturing line with 3
machines where machine 2 is the bottleneck in this
process, and its cycle time is noticeably higher in
comparison to machine 1 and machine 3, the
following rule can be set to assure that machine 2
has a bigger impact on this line efficiency.
If OEE
Machine2
is low then OLE is low
(regardless of OEE
Machine1
and OEE
Machine3
)
Here 29 rules are set to represent the production
process in the real system.
Figure 3: OLE measurement using Mamdani FIS.
4 EXPERIMENTAL RESULTS
First, common situations in industry are considered
and values of inputs are given to the system and the
OEE and OLE are obtained. Also, the considered
scenarios are compared to demonstrate the accuracy
of the proposed methodologies (M. Moradizadeh,
2014). Here, a brief explanation of each scenario
along with a table of inputs and results is presented.
Please note that these methodologies can be
implemented for general and diverse production
systems (M. Moradizadeh, 2014), regardless of
manufacturing process and variation and vagueness
of the inputs.
4.1 OEE Measurement using Mamdani
FIS
Here a typical (but general) industrial scenario is
presented. Some other industrial scenarios are also
presented in (M. Moradizadeh, 2014). A machine in
a manufacturing plant has been selected and its OEE
is to be measured. Assume there are qualitative
losses associated with this machine in the past
month; however, its performance rate is average and
also the machine was available to operate properly
(no major downtime) in this period. Therefore the
following assumptions are considered:
Although a minor breakdown occurred in this
period; the machine was running continually
and its operator considers the value of
breakdown loss as low.
FCTA2014-InternationalConferenceonFuzzyComputationTheoryandApplications
202
There were not setup and adjustment losses
involved with the machine, and these losses are
considered to be low.
Within the last month small stops occurred
during running time and have been fixed by the
operator so small stops loss is considered
average for this machine.
Machines’ ideal cycle time for pressing the
metal part is 12 seconds however its actual
cycle time is measured as 15 seconds and
reduced speed loss has considered average by
operator.
There was not a considerable amount of startup
rejects and this loss considered low in this
period.
Qualitative issues have been observed and
noticeable number of non-conforming parts has
been produced by this machine within last
month. Therefore the process reject loss is
considered to be high is this period.
In this manufacturing plant the availability
factor has a higher weight factor rather than
performance and quality due to the short cycle
time and inexpensive material. Also, the Total
Productive Maintenance (TPM) and Single
Minute Exchange of Die (SMED) are being
implemented to increase the running time of
machines and reduce the setup and adjustment
time.
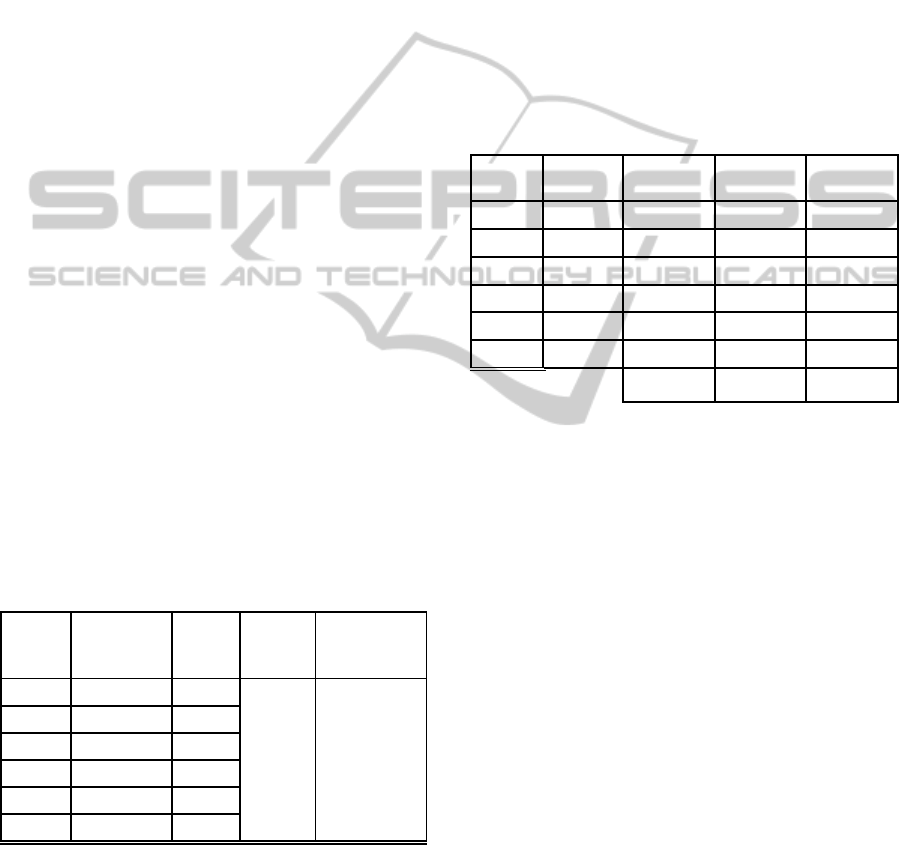
The following Table presents the results considering
the aforementioned parameters as inputs of
Mamdani FIS to measure OEE:
Table 1: OEE measurement using Mamdani FIS,
Experimental results.
Inputs
Linguistic
Term
Input
Value
Output
Deffuzified
Output
Value
Brk Low 15
OEE 74.8
Stad Low 10
Sml Average 38
Red Average 36
Str Low 18
Prr High 65
Note that, in traditional methods of OEE
calculation, the result, which is the average of
inputs, is 69.67%.
4.2 OEE Measurement using Sugeno
FIS
Three pneumatic presses (scenarios) are assumed in
a manufacturing plant and their OEE are to be
measured using a Sugeno FIS.
Following assumptions are considered as inputs
to the Sugeno FIS system:
Due to its material price, quality losses must be
identified and reduced in this manufacturing
plant.
Qualitative loss costs are drastically more than
other losses associated with OEE.
Table 2: OEE measurement using Sugeno FIS,
Experimental results.
Inputs
Weight
Facto
r
Scenario
1
Scenario
2
Scenario
3
Brk 2 14 32 8
Stad 1 8 4 6
Sml 1 31 28 31
Red 1 17 11 21
Str 3 9 26 6
Prr 4 77 12 8
OEE 65.08% 80.58% 89.67%
In order to measure the OEE more accurately
this company decided to assign different weight
factors to inputs. The Table above shows the weight
factor for each input, the value of each input for
these scenarios, and also the obtained OEE for each
scenario.
4.3 OLE Measurement using Mamdani
FIS
A manufacturing line is assumed with three different
machines. Each machine contributes in Overall Line
Efficiency; however, the machine 2 is the bottleneck
on this line and plays a more important role in the
OLE measurement. Therefore, the operator uses
his/her knowledge to set rules in the Mamdani FIS in
order to measure the OLE more efficiently. Also it is
necessary to note that this technique can be used for
any type of manufacturing line with a variety of
machines to measure its efficiency.
The following Table provides experimental
results obtained for different scenarios (represented
each by a row) from the Mamdani FIS:
OverallEquipmentEffectivenessandOverallLineEfficiencyMeasurementusingFuzzyInferenceSystems
203

Table 3: OLE measurement using Mamdani FIS,
Experimental results.
Scenario OEE
1
OEE
2
OEE
3
OLE
1 0.68 0.75 0.69 0.639
2 0.97 0.84 0.76 0.749
3 0.81 0.62 0.69 0.656
4 0.81 0.77 0.7 0.68
5 0.89 0.53 0.76 0.656
6 0.85 0.85 0.56 0.703
7 0.74 0.81 0.74 0.676
8 0.79 0.84 0.61 0.692
5 CONCLUSIONS
This Paper presents truly novel Intelligent Systems
(IS), in particular Fuzzy Inference Systems,
approaches and methodologies to measure the
commonly used indicators in many industries:
Overall Equipment Effectiveness and Overall Line
Efficiency. The proposed techniques can be easily
implemented to improve the accuracy and reduce the
limitations of the OEE and the OLE measurements.
These IS techniques, in particular the Fuzzy
Inference Systems (FIS) offer valuable and
significant new ways to measure the OEE and the
OLE in industry. Dealing with uncertainty and
vague data, taking advantage of user’s knowledge of
the system, and also the ability of adding weight
factors of inputs to the system, are some of the great
advantages of applying FIS in the OEE and the OLE
measurement.
REFERENCES
I. P. S. Ahuja, J. S. Khamba, "Total productive
maintenance: literature review and directions",
International Journal of Quality & Reliability
Management, Vol. 25 Iss: 7, (2008) 709 – 756.
Jose Arturo Garza-Reyes, Steve Eldridge, Kevin D.
Barber, Horacio Soriano-Meier, "Overall equipment
effectiveness (OEE) and process capability (PC)
measures: A relationship analysis", International
Journal of Quality & Reliability Management, Vol. 27
Iss: 1, (2010), 48 – 62.
D. Kotze, “Consistency, accuracy lead to maximum OEE
benefits”, TPM Newsletter, vol. 4, no. 2, 1993.
M. Lesshammar, “Evaluation and improvement of
manufacturing performance measurement systems –
the role of OEE”, International Journal of Operations
and Production Management, vol. 19, no. 1, pp. 55-
78, (1999).
R. Wudhikarn and W. Manopiniwes, “Autonomous
maintenance using total productive maintenance
approach: A case study of synthetic wood plank
factory”, Technology Innovation & Industrial
Management Conference, TIIM2010, Pattaya,
Thailand, in press.
B. Dal, P. Tugwell and R. Greatbanks, “Overall
Equipment effectiveness as a measure of operational
Improvement”, International Journal of Operations &
Production Management, vol. 20, no. 12, (2000),
1488–1520.
M. Maran, G. Manikandan, K.Thiagarajan,
“Overall Equipment Effectiveness Measurement By
Weighted Approach Method”, International
Association of Engineers Vol. 2.,(2012).
M. Moradizadeh, “Overall Equipment Effectiveness and
Overall Line Efficiency Measurement Using
Intelligent Systems Techniques” M.A.Sc. Thesis,
Faculty of Engineering, University of Regina, Canada,
April, 2014.
Braglia, M., Frosolini, M., & Zammori, F., “Overall
equipment effectiveness of a manufacturing line
(OEEML)”. Journal of Manufacturing Technology
Management, Vol. 20 Iss: 1, (2009), 8 – 29.
Richard Oechsner, Markus Pfeffer, Lothar Pfitzner, Harald
Binder, Eckhard Müller, Thomas Vonderstrass, “
From overall equipment efficiency (OEE) to overall
Fab effectiveness (OFE)”, Materials Science in
Semiconductor Processing, Vol. 5, Iss 4–5, (2002),
333-339.
LIST OF ACRONYMS
IS Intelligent Systems
FIS Fuzzy Inference Systems
OEE Overall Equipment Effectiveness
OLE Overall Line Efficiency
Brk Breakdowns
Stad Setup & adjustment
Sml Small stops
Red Reduced speed
Str Start-up rejects
Prr Production rejects
Coa Center of area
FCTA2014-InternationalConferenceonFuzzyComputationTheoryandApplications
204
