
AM2O
An Efficient Approach for Managing Training in Enterprise
Fod´e Tour´e
1
, Esma A¨ımeur
1
and Kimiz Dalkir
2
1
Department of Computer Science and Operations Research, Universit´e de Montr´eal, Montreal, Canada
2
School of Information Studies, McGill University, Montreal, Canada
Keywords:
Training Evaluation, Organizational Learning, Knowledge Management, Business Analysis, Return on
Equity, Optimization.
Abstract:
The learning function has grown and matured considerably in recent years, and evolved into a strategic support
function. Companies continue to invest in organizational learning and development, but rarely possess data to
assess the results of this investment. Most companies use the Kirkpatrick/Phillips model to evaluate enterprise
training. However, it emerges from the literature that enterprises have difficulties in using this model.
In this paper, we propose an approach based on analysing and modelling the training needs to ensure the
alignment between training activities and enterprise business objectives. It allows training project monitoring
as well as the calculation of tangible and intangible benefits of training (without added cost). Furthermore, it
enables the production of a classification of training projects according to criteria relevant to the enterprise.
Our approach can be used to optimize the training yield by a series of simulations based on machine learning
algorithms.
1 INTRODUCTION
The training evaluation aims at verifying if the com-
mitted efforts are translated by the outcomes which
matched the aimed objectives. However, when it is
question of making the link between learning pro-
grams and business results, organizational learning
functions have a track record of limited success.
A 2009 ASTD study revealed that the five-level
Kirkpatrick/Phillips model of learning evaluation is
the most commonly used model in practice. How-
ever, few organizations feel they have mastered the
learning evaluation, and many admit to facing ongo-
ing challenges (ASTD, 2009). The barriers that pre-
vent companies from using all the evaluation levels
are:
◦ Difficulty in isolating learning as a factor that
has an impact on corporate results.
◦ Lack of a useful evaluation system within the
Learning Management System (LMS).
◦ Lack of standardized data to properly compare
across training functions.
This paper presents a method of training project man-
agement (AM2O method): going from design to op-
timization via the evaluation of the financial and non-
financial yield. It also introduces our Enterprise
Training Program Management System - ETREOSys.
In section 2, we present our approach (AM2O
method). Section 3 provides a brief presentation of
the Kirkpatrick/Phillips model for the evaluation of
training programs in organizations. In section 4, we
discuss our results and section 5 is reserved for the
conclusions.
2 AM2O: AN APPROACH FOR
ENTERPRISE TRAINING
PROGRAM MANAGEMENT
We propose a four-step approach of enterprise train-
ing program management. This approach consists of
analysing training needs, process modelling, monitor-
ing the progress of a project while guaranteeing ex-
pected objectives, and optimizing the yield by a series
of simulations. These four steps are shown in Figure
1.
2.1 Stage 1 - Analysis
A corporate training program consists of a series of
405
Touré F., Aïmeur E. and Dalkir K..
AM2O - An Efficient Approach for Managing Training in Enterprise.
DOI: 10.5220/0005158204050412
In Proceedings of the International Conference on Knowledge Management and Information Sharing (KMIS-2014), pages 405-412
ISBN: 978-989-758-050-5
Copyright
c
2014 SCITEPRESS (Science and Technology Publications, Lda.)

Figure 1: The stages of AM2O method.
specific actions intended to resolve an enterprise-
specific problem. According to Rivard and Lauzier
(2013), a need for training in an enterprise defines it-
self by the gap between what is (the current situation)
and what should be (the wished situation). It is thus
necessary to avoid launching too quickly a training
process before having well estimated the nature of the
problem raised in the enterprise.
The results of a study led by van Eerde et al.
(2008), with 96 companies, demonstrate that a rig-
orous analysis of needs leads to a greater perception
of the utility of training, what in return has a positive
effect on the efficiency of the organization. Hence,
the first stage of AM2O focuses on analysing the de-
mand for training and associating it with performance
elements of the enterprise. This stage requires a num-
ber of actions such as: consultations to explore de-
mand, definition of a changeplan, needs analysis, def-
initions of the objectives, and selection and definition
of performance indicators. Hence, we use a business
analysis process based on the International Institute
of Business Analysis (IIBA) guide.
IIBA maintains and publishes a repository con-
taining a description of the activities involved in busi-
ness analysis. The repository is published as a book
entitled ”A Guide to the Business Analysis Body of
Knowledge”(IIBA, 2009).
The development of systems and their compo-
nents is based on the description of needs. The de-
termination of the needs depends on the form and
the structure of the demand. The IIBA guide allows
us to answer several questions such as: Why would
you want to train employees? What needs have been
identified? What are the expectations? How will the
achievement (or not) of goals be assessed?
The analysis of the current situation produces a re-
port containing a structured presentation of harvested
information and details of the objectives, the means
and available resources, improvementproposals, risks
and potential impacts. Managers evaluate the orga-
nizational strengths, weaknesses, opportunities and
risks. A business process model is therefore based
on the identification of key elements in the conduct
of affairs such as endogenous and exogenous factors
directly acting on the fluctuations of the function-
ing mode of the enterprise. This reasoning solves
the problem of isolation of training impacts from the
overall performance of the organization. Indeed, we
can use the IIBA process to define the indicators re-
lated to the expected effects of the training and the
factors that may influence these effects. This means
that we also define the situations and indicators that
can produce the same effects as training.
In AM2O, the description of the intangible train-
ing yield is based on the values of qualitative indica-
tors. As these indicators are directly linked to specific
objectives, the successful achievement of these objec-
tives will be evaluated using the values of the corre-
sponding indicators. The same reasoning applies to
the calculation of the financial training yield.
This first stage of AM2O supplies the process
model, the information required to configure this
model, and the initial values of indicators. It ensures
the alignment of the training program with the growth
strategy of the enterprise. At this stage, we estimate
the Net Present Value (NPV) of the training invest-
ment before the beginning of the training program by
combining the NPV formula with the DuPont finan-
cial analysis method.
When a company or investor takes on a project or
investment, it is important to calculate an estimate of
how profitable the project or investment will be. NPV
is a formula used to determine the present value of an
investment from the discounted sum of all cash flows
received from the project. It compares the value of
a dollar today to the value of that same dollar in the
future, taking inflation and returns into account. The
formula for the discounted sum of all cash flows can
be rewritten as:
NPV =
T
∑
t=1
C
t
(1+ r)
t
−C
0
(1)
T is the number of years, C
t
is the cash flow at time t,
r is the discount rate (the rate of return that could be
KMIS2014-InternationalConferenceonKnowledgeManagementandInformationSharing
406

earned on an investment in the financial markets with
similar risk - it is the interest rate) and C
0
is the initial
investment.
The cash flow is the movement of money into or
out of a business, project, or financial product. It is
usually measured during a specified, finite period of
time. Measurement of cash flow can be used to calcu-
late other parameters that give information on a com-
pany’s value and situation. For example: to improve
the yield of its shipping department, a warehouse (En-
terprise X) organizes training sessions for its employ-
ees on the use of scanners.
The analysis of the need for training shows that
Enterprise X just wants to increase its return to in-
vestors. To increase this return, it has to reduce the
cost of ordering errors and increase the number of or-
ders treated per hour in the whole department (thus
by all employees). The analysis of the current situa-
tion of the enterprise provides the simplified financial
balance sheet shown in Table 1 below.
Table 1: Example of simplified financial balance sheet.
Net profit Sales Assets Equity
$ 1 000 000 $ 10 000 000 $ 8 000 000 $ 4 000 000
Order errors represent an average cost of $200 000
to the company. The cost of the training is $500 000.
Enterprise X estimates that training will reduce the
cost of ordering errors by at least 50%. Also, increas-
ing the number of orders treated per hour will have a
positive impact on sales and net profit. This increase
also saves the salary of seasonal workers, the cost of
their recruitment and their training (e.g. $ 150 000).
Such information can be used to estimate the NPV of
the investment in training before the program begins.
In the case of Enterprise X, assuming that the
training generates a constant income, for a constant
risk of 10%, we have the following NPV:
NPV =
100000+ 150000
1.1
+
250000
1.1
2
+ . . .
+
250000
1.1
T
− 500000 (2)
According to the previous calculation, we note that
the value of NPV will be positive only from the third
year onwards.
Normally, several aspects of financial statements
are affected by training which makes it more difficult
to estimate the impact on profit. Consequently, con-
trary to the previous example which was simple, in
more complex cases, the calculation of the NPV of an
investment in training is done in five steps (Figure 2).
Indeed, the use of the IIBA guide produces a set
of indicators (ratios) for assessing the success of the
training. These ratios can be used in the decomposi-
tion (first and second level) of the DuPont model in
order to calculate the cash flows associated with the
investment in training.
According to Soliman (2008) , the DuPont com-
ponents represent an incremental and viable form of
information about the operating characteristics of a
firm. With this method, assets are measured at their
gross book value rather than at net book value in order
to produce a higher return on equity (ROE). It is a ra-
tio analysis system that quickly allows us to determine
if a company is using all the means at its disposal to
reach its financial goal. The DuPont analysis helps
locate the part of the business that is underperforming
(if ROE is unsatisfactory). This analysis tells us that
the ROE is affected by three sub-ratios:
◦ Operating efficiency, which is measured by profit
margin.
◦ Asset use efficiency, which is measured by total
asset turnover.
◦ Financial leverage, which is measured by the eq-
uity multiplier.
ROE = Profit Margin∗ Total Asset Turnover
∗ Equity Multiplier (3)
Profil Margin =
Profit
Sales
TotalAsset Turnover =
Sales
Assets
Equity Multiplier =
Assets
Equity
ROE =
Profit
Equity
For example, by using Table 1, we obtain the follow-
ing ROE:
ROE =
10
6
10
7
∗
10
7
8∗ 10
6
∗
8∗ 10
6
4∗ 10
6
= 0.25
The result of the calculation of the ROE means that
every dollar invested in the company by the share-
holders generates 25% (25cent) of profit.
A better analysis of the training project would be
to associate indicators, supplied by the first stage of
our approach, with certain ratios of the DuPont de-
composition. This will help to pinpoint the exact im-
pact of training on the return on equity (specifically on
net profit). A comparative analysis with the scenario
without investment in training allows us to isolate the
relevant cash-flow to be used in the NPV formula.
Using the same example of Enterprise X, the re-
duction of the cost of ordering errors and the increase
AM2O-AnEfficientApproachforManagingTraininginEnterprise
407

Figure 2: Procedure for estimating the profitability of a training investment.
of the number of orders treated per hour will have
an impact on the net margin ratio and the total asset
turnover ratio. Thus, from the decomposition of the
DuPont model, if improvements due to training in-
creased the return on equity of β (i.e. the net profit of
β), then we can use the NPV formula to determine the
future earnings of investment in training according to
the following equation:
NPV =
T
∑
t=1
β∗ netprofit
(1+ r)
t
−C
0
(4)
Depending on the value of NPV, and whether it is
above or below a threshold set by the company, the
decision will then be to either fund or not fund the
training project.
2.2 Stage 2 - Modelling
This stage allows us to model a business process us-
ing graphic objects developed by the Workflow Man-
agement Coalition language. In this modelling lan-
guage, we use two object types: nodes and flows.
The nodes are classified into two categories: task and
choice (condition). A task, graphically represented by
a rectangle, represents the work to be done to achieve
some objectives. A choice, graphically represented
by a circle, is used to build conditional structures. A
flow links two nodes in graph and is graphically rep-
resented by an arrow.
For training project management, there are at least
two process models: the process model related to
the training plan and the process model related to
the stages of data collection and training performance
evaluation.
The training plan is a graphical representation of
the syllabus (course outline). To illustrate this con-
cept, let us take the example of an enterprise, which
would like to improve the performance of its cus-
tomers’ service department. The enterprise would
like employees to make a complex analysis of con-
sumer behaviour and communicate results to man-
agers and strategic advisors. This means that employ-
ees must be trained on consumer behaviour. Figure 3
shows a process model of the planning of this train-
ing.
In AM2O, the actors of each activity and their
roles, the description of incoming and outgoing data,
the temporal aspect and the performance indicators
Figure 3: A possible process model for a training plan for
consumer behaviour.
related to training are also added to the graph. Sam-
ple indicators may include: average emotional state
of learner, average emotional state of trainees during
training sessions, and satisfaction of the organization
with the training program, Employees’ satisfaction
can be measured with such indicators as satisfaction
with respect to the content, perceived relevancy and
usefulness of training.
The planning of the data collection and training
evaluation consists of collecting information before,
during and after the training (see Figure 4). In A2MO,
we define the means of data collection, dates, the ob-
jectives, the actors and the corresponding indicators
for each stage. All information is kept in ETREOSys
to facilitate the management of the training program.
Consequently, besides the already mentioned indica-
tors, we define other indicators that allow us to esti-
mate the achievement of the training objectives in the
enterprise. These indicators relate to the employees’
lives in the enterprise before and after the training.
Some examples would be: increase innovation level
of an employee, increase general level of innovation
in the enterprise, improve product quality, work cli-
mate, the number of committee meetings, customers
loyalty, and profit by employee.
We can also isolate the indicators which can in-
fluence those previously discussed (with or without
training program). For example: rate of staff turnover,
rate of employee absenteeism, number of absences
per employee, cause of absences, cost of the rotation,
cost engendered by absenteeism, cost of absence per
employee, degree of job satisfaction, degree of per-
sonal initiative, staff productivity, level of collabora-
tion between employees within the enterprise, level of
collaboration per employee and so on.
In the case of the training modelled in Figure 3, we
KMIS2014-InternationalConferenceonKnowledgeManagementandInformationSharing
408

Figure 4: A possible process model for training evaluation planning.
must take into account the influence of environmental
factors on consumer behaviour such as culture, refer-
ence groups, social class or family. Therefore, it is
necessary to define indicators in order to isolate the
influence of these external elements.
The evaluation process model (Figure 4) fixes pe-
riods of gathering information in order to proceed
with evaluations and simulations to predict result
trends. This information will allow us to make de-
cisions leading to the success of the training program.
The evaluation process model will allow us to react in
real time to avoid failure of training (non-realization
of the objectives). For this purpose, it is enough to
compare the initial values, the collected values and
the expectations of the enterprise.
The deployment of invalid processes can lead to
incoherent states and can even provoke very critical
breakdowns without the slightest possibility of recov-
ery. In other words, if a process is put in production
before being validated, it could fail during the exe-
cution stage and cause considerable loss to the en-
terprise. To check the syntactic validity, we analyse
the structure of the process model. For this, we use a
simplified and enhanced version of the Tour´e hybrid
algorithm (Tour´e et al., 2008). On the other hand, to
check the semantic validity, we need to analyse the
information treated by the tasks and the behaviour of
the latter (in the first stage of AM2O, see section 2.1,
caution must be taken in order to avoid semantic con-
flicts).
The first and second stages of AM2O are impor-
tant because they ensure a responsible management
of the training program and serve as the basis for the
success of the stages 3 and 4.
2.3 Stage 3: Monitoring
This stage of AM2O consists of controlling the
progress of the processes. A control system based
on relevant and precise indicators is needed in or-
der to have dashboards used to make good decisions
quickly. The training dashboard has to cover two di-
mensions: efficiency and efficacy. The training pro-
cess is said to be efficient if it gives maximum results
while consuming minimum resources and said to be
effective if it provides the expected results.
This stage allows us to calculate the tangible and
intangible training benefits (without additional costs)
by using the values of the indicators. To estimate the
impact of training on cost, we compare indicator val-
ues before training and after training. The calculation
of the return on training investment is explained by
the process shown in the Figure 5.
When we decide to calculate the financial yield
on training investment, we determine the gap between
the previous and current values of the quantitative in-
dicators (ratios). Furthermore, the intangible bene-
fits can be converted into tangible factors with a good
understanding of profit. For example: the improve-
ment of employee morale (intangible) can be con-
verted as follows: improving employee morale can
increase employee retention, which can be assessed as
the cost saving related to hiring and training new em-
ployees. Based on staff turnover last year, the human
resources department can provide concrete numbers
like ”Reducing employee turnover by 5% will save $
5,000 in recruitment costs.”
By using the DuPont model (see equation 3), we
estimate the impact of the variation in ROE indicators
on the ROE. This process allows us to calculate the
impact of training on the overall profitability of the
company.
2.4 Stage 4: Optimization
In this stage, we use machine learning algorithms (ex-
ample, logistic regression, neural networks or support
vector machines) to classify training activities accord-
ing to defined criteria (example, financial yield) and to
conduct simulations to increase the efficiency and ef-
fectiveness of training activities. To do that, we carry
out a pre-treatment on the indicator values to have a
data set for a learning algorithm (supervised, unsuper-
vised or semi-supervised). When the training evalua-
tion process is completed, the enterprise training pro-
grams will be classified into two categories: profitable
and unprofitable. Hence, we will have a dataset D
n
that can be used in the training of a machine learning
algorithm.
D
n
= {Z
1
, Z
2
, . . . , Z
n
}
∀i ∈ {1, 2, . . . , n}, Z
i
= (x
(i)
, t
(i)
) with x
(i)
∈ R
d
and t
(i)
∈ {0, 1}
Each Z
i
is associated with a particular training pro-
gram in the enterprise. The x
(i)
values are the indica-
tors (see 2.1 and 2.2) related to the training. Hence,
AM2O-AnEfficientApproachforManagingTraininginEnterprise
409
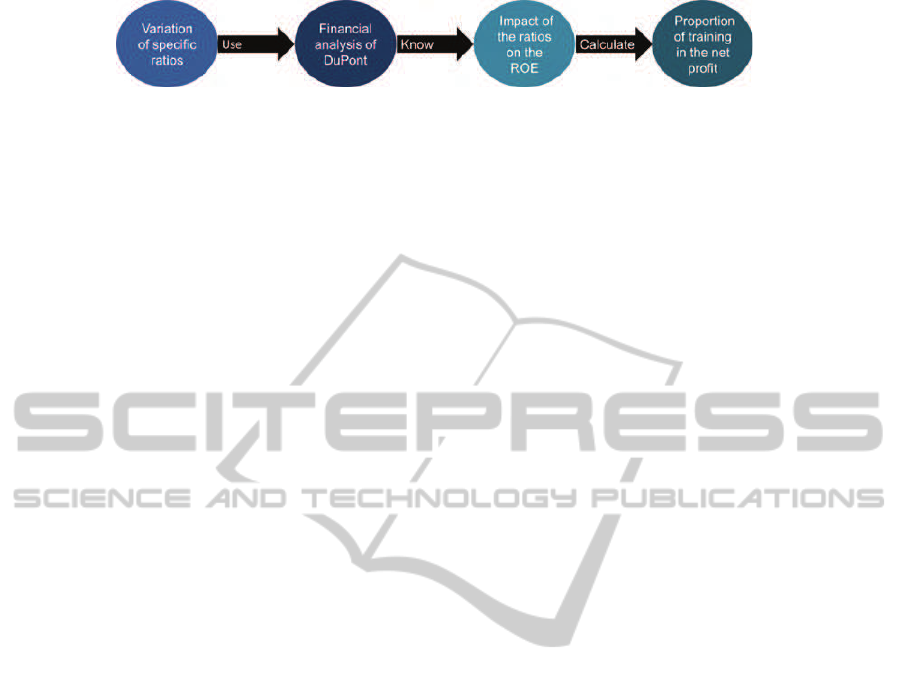
Figure 5: How to calculate the return on training investment.
we can have indicators which take numerical values
(for example, number of committee meetings) and
others that take categorical values (for example, ordi-
nal and nominal values). The t
(i)
values represent the
training class (profitable or unprofitable), where prof-
itable corresponds to 1 and unprofitable corresponds
to 0. The number of completed training program is n
and the number of indicators is d.
In our approach, the purpose of the classifica-
tion is to be able to predict the achievement or non-
achievement of the training objectives by observing
only the indicators behaviour. Furthermore, we must
be able to determine the indicators which have more
weight in the attainment of training objectives. That’s
why we may use a parametric machine learning al-
gorithm like logistic regression, neural networks or
support vector machines.
The optimization consists of a simulation that
guides the training process towards the achievement
of its objectives. To do this we may use semi-
supervised learning. The goal of a semi-supervised
learning is to understand how combining labelled and
unlabelled data may change the learning behaviour,
and design algorithms can be developed that take ad-
vantage of such a combination. For this, we need to
render the values of the indicators that we want to pre-
dict as discrete variables. This is a binary classifica-
tion process (the value is good or bad) based on the
recommendations of a human expert. For example,
the indicator number of absences per employee is 1 if
its value is below the threshold set by a human expert
(or according to the functioning of the enterprise) and
0 otherwise.
To facilitate the understanding and the use of
AM2O, we developed an enterprise learning man-
agement system named Enterprise TRaining program
Evaluation and Optimization System ETREOSys.
3 RELATED WORK
Work on Kirkpatrick’s model began in 1959, with a
series of four articles on the evaluation of training
programs in the journal ”Training and Development”.
These four articles defined the four levels of eval-
uation that would later have a significant influence
on corporate practices (Kirkpatrick and Kirkpatrick,
2006).
Level 1 - Students Reaction
How did the trainees react after the training? Did they
appreciate it? Were they satisfied? What did they
think and feel about the training?
Level 2 - Learning
What did they learn after the training? What knowl-
edge, skills and/or attitudes were acquired? Were ed-
ucational objectives been achieved? Was there a re-
sulting increase in knowledge or capability?
Level 3 - Behavior
Do trainees use what they learned in training at their
workplace? What new professional behaviours have
been adopted?
Level 4 - Results
What is the impact of the training on the results of
the company? For example: decrease in absenteeism
or occupational accidents, growth of asset turnover,
of productivity, or customer satisfaction, etc. The ef-
fects on the business or environment resulting from
improved trainee performance.
Although the Kirkpatricks’ four-levelmodel is widely
recognized and accepted, and although a significant
number of evaluation methods are based on it, many
researchers have argued that this method does not
provide adequate data required by today’s managers.
According to Phillips, training yield calculation
proceeds by stages, which supplies a detailed plan
for the collection and analysis of the data, which
includes the calculation of Return On Investment
(ROI). So Phillips suggested the inclusion of a fifth
level in 1996 (Phillips and Phillips, 2003).
Level 5 - Return on Investment
Comparison between the profit obtained from the
training and the training costs. Profits and/or savings
realized are they superior to the total cost of the
training (direct and indirect costs)? Did the training
generate a return on investment?
The ROI calculation process begins with planning for
training evaluation: where objectives are defined and
decisions are taken on the way the data will be col-
lected, treated, and analysed. Data collection is car-
ried out according to the training evaluation levels 1
to 4 of Kirkpatrick’s model.
However, in the literature, several criticisms have
KMIS2014-InternationalConferenceonKnowledgeManagementandInformationSharing
410

been raised with regard to the Kirkpatrick/Phillips
model. According to Mumma and Thatcher (2009)
, the entire notion of the Kirkpatrick/Phillips model
may not truly measure the impact of the learning func-
tion on the enterprise, even under the most optimistic
scenarios. It measures only the possible impact of iso-
lated training events. Nagle (2002) reports a series
of criticisms of the ROI calculation process such as:
difficulty to have a valid measure, expensive process,
complex process, process that can take up to one year,
and presence of other factors that influence the perfor-
mance of the organization. Concerning the method-
ological problems, McCain (2004) established a list
of biases that could have an impact on the observed
results which a training professional does not always
think of. These include bias of a sample (selection of
a non-representative sample or too small a sample),
bias in the interviews, and bias in the presentation of
questions.
4 DISCUSSION
Given that our objective is to respond to business
needs concerning the management of training pro-
grams, this demonstration will be supported through
comparison criteria based on the results of surveys
conducted in the workplace by ASTD ic4p (ASTD,
2009) and others such as Formaeva (Formaeva,
2011). The criteria and their definitions are:
Efficiency. It is the criterion associated with an
evaluation model, which refers to maximizing results
while consuming a minimum of resources. An
efficient model does not create any additional costs
when calculating the training yield.
Usability. This criterion refers to the ease and the
simplicity of using a model to evaluate a training
program. The complexity involved in using a model
is a barrier which can prevent companies from
effectively evaluating their training program.
Implementation. Surveys have revealed that one of
the barriers which can prevent companies from fully
exploiting the existing models is the lack of IT tools.
This assumes that a model which is implemented
through an IT tool is more likely to be used by the
companies and training professionals.
Diagnosis. This criterion refers to the ability of a
model to identify the causes of the success or the
failure of a training program. A model able to supply
a diagnosis of a training program is a powerful
decision-making tool.
Widespread. This criterion captures the fact that
many companies use a model or that it is better
known than another model.
The model of Kirkpatrick allows to evaluate the train-
ing at various levels of learnings integration. It also
enjoys great recognition with the professionals of the
training. Its main limitation is the fact that it does
not explain in what a training is effective or ineffec-
tive (Holton, 1996; Saks and Haccoun, 2013). From a
diagnostic standpoint, this evaluation model does not
either indicate how to improve the training strategy
used.
Besides, Saks and Burke (2012) were interested
in the evaluation process by using the model with
four levels of Kirkpatrick. Their research was con-
ducted among 150 members of a Canadian associa-
tion of training who work for organizations with be-
tween 500 and 1, 000 employees. The authors raise
the following paradox (which is consistent with pre-
vious research): enterprises measure more the reac-
tions and the learnings, while only the behaviors and
the results are positively related to a higher level of
learnings transfer.
The Kirkpatrick/Phillips model does not inte-
grate the business analysis component. This analy-
sis should be done before employees begin training.
This fact is one major handicap to the success of the
training evaluation and explains why enterprises can-
not correctly and easily apply the Kirkpatrick/Phillips
model (especially level 3). Indeed, the indicators used
at level 4 of the Kirkpatrick model should be known
during the management process, even before the first
level of this model (Kirkpatrick/Phillips). This obser-
vation confirms the fact that the Kirkpatrick/Phillips
model does not supply the required information for
an analysis and adequate evaluation of the training.
Given that level 5 (added by Phillips) uses the data
provided by level 4 of Kirkpatrick, it also inherits the
gaps and weaknesses of the latter. Indeed, Kirkpatrick
recommends using their model in hierarchical order
(1, 2, 3, and 4). Consequently, given that the supplied
data are not sufficient and (given the delay in cov-
erage of the training management), the ROI process
calculation (level 5 of Phillips) becomes complicated
and useless due to lack of adequate data. Table 2,
below, summarizes the comparison between our ap-
proach and the Kirkpatrick/Phillip model.
Finally, according to Rivard and Lauzier (2013),
it’s better to adopt a methodology which let you
quickly fix a training strategy which does not give the
wished results than ending up in a situation where we
demonstrate that a training given to all employees is
not ultimately effective. This point of view demon-
strates the usefulness of AM2O and ETREOSys.
AM2O-AnEfficientApproachforManagingTraininginEnterprise
411

Table 2: Comparison table of our model to the Kirkpatrick
/ Phillips model.
Efficiency
Usability
Implementation
Diagnosis
Widespread
Kirkpatrick/Phillips No No No No Yes
Our approach Yes Yes Yes Yes No
5 CONCLUSION
The advantages obtained through our approach can
be seen from two angles. In the domain of business
process management, we add a new category of busi-
ness process and we extend the business process man-
agement systems by adding training management and
evaluation functions (through ETREOSys).
Concerning the evaluation of enterprise training,
we propose a more comprehensive approach for train-
ing project management, one that facilitates decision-
making and the calculation of the tangible and intan-
gible profits.
Relating to the problems raised in the literature,
we reduce the biases and additional costs associ-
ated with training yield calculation. Indeed, we tie
the training objectives and strategies to the perfor-
mance wish list of the enterprise in the training de-
sign. Hence, from the beginning, the enterprise would
be able to connect the expected outcomes with certain
indicators used in the current functioning of the en-
terprise. When financial yield evaluation is required,
our approach enables companies, to supply data from
the quantitative indicators which will show the evolu-
tion of productivity and translate them into economic
value without incurring additional costs. They could
also use the qualitative indicators to demonstrate the
social yield of training.
Finally, our approach ensures that training activ-
ities are aligned with business needs and allows the
ROI (or ROE) calculation to be made without addi-
tional investment.
REFERENCES
ASTD (2009). The Value of Evaluation: Making Training
Evaluations More Effective. ASTD Press.
Formaeva (2011). Synth`ese d’´etude: Les pratiques
d’´evaluation des formations des entreprises franc¸aises
en 2011. Technical report, Formaeva. Formaeva:
´
Evaluer pour Mieux Former.
Holton, E. F. (1996). The flawed four-level evaluation
model. Human Resource Development Quarterly,
7(1):5–21.
IIBA (2009). A guide to the Business Analysis Body of
Knowledge (BABOK guide), version 2.0. International
Institute of Business Analysis.
Kirkpatrick, D. L. and Kirkpatrick, J. D. (2006). Evalu-
ating Training Programs: The Four Levels (3rd Edi-
tion). Berrett-Koehler Publishers, 3rd edition.
McCain, D. (2004). Evaluation basics. ASTD, 1st edition.
Mumma, S. and Thatcher, C. (2009). The learning profit
chain ”connecting learning investments to financial
performance”. Corporate University Xchange.
Nagle, B. (2002). Roi gives a way to roe. Candian HR
Reporter,, 15(13):7.
Phillips, J. J. and Phillips, P. P. (2003). Using action plans to
measure roi. Performance Improvement, 42(1):24–33.
Rivard, P. and Lauzier, M. (2013). La gestion de la for-
mation et du d´eveloppement des ressources humaines:
Pour pr´eserver et accroˆıtre le capital comp´etence de
l’organisation. 2e edition.
Saks, A. M. and Burke, L. A. (2012). An investigation into
the relationship between training evaluation and the
transfer of training. International Journal of Training
and Development, 16(2):118–127.
Saks, A. M. and Haccoun, R. R. (2013). Managing Per-
formance through Training and Development. Nelson
Education, 6th edition.
Soliman, M. (2008). The use of dupont analysis by market
participants. The Accounting Review, 83(3):823–853.
Tour´e, F., Ba¨ına, K., and Benali, K. (2008). An efficient
algorithm for workflow graph structural verification.
In Meersman, R. and Tari, Z., editors, OTM Confer-
ences (1), volume 5331 of Lecture Notes in Computer
Science, pages 392–408. Springer.
van Eerde, W., Simon Tang, K., and Talbot, G. (2008). The
mediating role of training utility in the relationship be-
tween training needs assessment and organizational
effectiveness. The International Journal of Human
Resource Management, 19(1):63–73.
KMIS2014-InternationalConferenceonKnowledgeManagementandInformationSharing
412
