
Handling Missing Data in a Tree Species Catalog Proposed for
Reforesting Mexico City
H
´
ector Javier V
´
azquez
1
and Mihaela Juganaru-Mathieu
2
1
Departamento de Sistemas, Universidad Autonoma Metropolitana, Unidad Azcapotzalco,
Avenida San Pablo 180, Mexico D.F., Mexico
2
Institut H. Fayol, Ecole Nationale Sup
´
erieure des Mines, 158, cours Fauriel, 42023, Saint Etienne, France
Keywords:
Data Mining, Handling Missing Attribute, Multiple Correspondence Analysis, Clustering.
Abstract:
In this paper we present an application of handling missing attribute values for some data about urban forest
in Mexico City. The missing attribute values are about pollution tolerance of the trees, around 42% of our
observations are incomplete. Classical methods are non applicable without introducing noise. Our proposal
is to use successive steps of multiple correspondance analysis. The estimations values are validated with a
clustering approach. The complete data can be used for a variety of future applications.
1 INTRODUCTION
Trees are a vital component of the human
environment and city landscape. Because of
the many functions and benefits trees provide,
it is impossible to imagine urban life without
them (Burden, 2008). Even though trees have been
a part of urban environments since cities began to
develop, the study of urban trees is recent, and our
knowledge about this important asset is limited. It
wasn’t until the second half of the 20th century,
as urbanization increased, that city trees began
to receive special attention, as evidenced by the
emergence of such disciplines as urban forestry and
arboriculture. The last comprehensive review of
scientific literature about urban tree planting was in
1997 (Watson, 2011). Since that time, researchers
have begun to focus on how to apply knowledge about
plant biology, soil structure, and soil composition
to improve tree survival in urban environments. In
spite of those advances, our knowledge about urban
trees remains incomplete and many questions stay
unanswered (Carter, 1993).
Considering the importance of these valuable
assets, many cities have adopted policies and
strategic plans and initiated various programs for tree
maintenance and planting. Highly populated Mexico
City (Federal District and its metropolitan suburban
area), long one of the most polluted regions of the
world, is no exception. Mexico City’s weather and
geographic location offer ideal conditions for the
growth and adaptation of a great diversity of tree
species. However, the characteristics of the city and
its huge population are obstacles to tree survival. As is
true in many cities, trees in Mexico City are located in
both private and public spaces. In public spaces, they
are planted along or in sidewalks, in road medians,
and in gardens, parks, sport fields, and cemeteries.
Unfortunately, it is common for urban trees to
suffer severe injuries and diseases originated from
their environment: air, soil and water pollution,
insects, parasites, lack of water, impediments to
growth, such as cabling, planting pits and soil
compaction, and damage from vandalism. Because
trees provide many benefits, one of the goals of
authorities in charge of tree resources and green
areas is to increase tree survival rates and improve
conditions adequate for growth. Educating urban
green areas’ administrators, home owners and the
general public about the benefits of trees and
providing information about tree planting and care
are among the ways to accomplish the goal – for
example, the local secretary of the environment
has published several technical manuals for the
integral management of urban green areas (SMA,
2000). In particular, two of these manuals (one for
pruning, felling, transplanting and an other to assess
species’ tolerance to pollution) include a catalog of
species recommended for planting in the Federal
District. For each species it is included information
about appropriate planting sites and environmental
conditions for growth, but they do not provide
457
Vázquez H. and Juganaru-Mathieu M..
Handling Missing Data in a Tree Species Catalog Proposed for Reforesting Mexico City.
DOI: 10.5220/0005158404570464
In Proceedings of the International Conference on Knowledge Discovery and Information Retrieval (KDIR-2014), pages 457-464
ISBN: 978-989-758-048-2
Copyright
c
2014 SCITEPRESS (Science and Technology Publications, Lda.)

comprehensive information about species’ response
to air pollution. Accordingly, the goal of the current
study was to explore a method to replace missing data
concerning species’ response to air pollution through
the use of multiple correspondence analysis (MCA).
It is important to obtain these data because species
tolerance to pollution might be a key factor for tree
survival (EPA, 2010) in a city like Mexico City –
where pollution levels vary depending on season,
urban area, or even time of day.
Section 2 presents our data along with a brief
description of various methods to replace missing
values. Section 3 proposes an imputation-approach
based on the MCA. The results of this method are
detailed in section 4. Finally, conclusions and future
work plans are presented in section 5.
2 TREE’S SPECIES DATA SET
The data set is generated from the fusion of attributes
of recommended species included in two technical
manuals. However, some attributes related to species’
response to air pollution are missing. In this section
data is described and briefly analyzed, followed by
a short presentation of methods for handling missing
values.
2.1 Tree’s Species Data Set
The data set is generated from the information
contained in two technical manuals published by the
local secretary of the environment of Mexico City:
• The first manual gives guidelines for pruning,
felling and transplanting trees and shrubs (SMA,
2000). It includes relevant information about 134
species with key features such as:
– Group 1: nominal characteristics (species
name, genus, origin)
– Group 2: basic characteristics (tree, shrub,
palm, fruit, evergreen)
– Group 3: tolerance to some general
environmental conditions (to cold (tcold),
to dryness (tdry), to mistreatment (tmiss) and
to soil salinity (tsal))
– Group 4: a recommended list of planting
sites (streets and middle-roads (s street), urban
recreational parks (s urbrp), parking lots
(s parlot), beneath electric lines (s beleclin),
cemeteries (s cem), sport fields (s sport f ),
urban forest (s urb f or))
• The second manual (SMA, 2001) offers
information about environment and pollution
in M
´
exico city and it includes information, about
species’ response to pollution (sensitivity = 1,
tolerance = 2, resistance = 3, and adaptation = 4)
to four levels of air pollution. Unfortunately this
manual includes information for only 77 species
of the 134 species listed in the first. Pollution
levels are classified by primary component (SO
2
= sulphur dioxide, NO
x
= nitrogen dioxides, CO
= carbon monoxide and PST = total suspended
particles) in metric tonnes per year. The four
pollution levels form the following variables in
Group 5:
– veryhighpollution = (SO
2
> 500, NO
x
> 2000,
CO > 3000, PST > 2000)
– highpollution = (251 < SO
2
< 500, 500 <
NO
x
< 2000, 500 < CO < 3000, 500 < PST <
2000)
– mild pollution = (101 < SO
2
< 250, 100 <
NO
x
< 500, 100 < CO < 500, 100 < PST <
500)
– lowpollution = (SO
2
< 100, 10 < NO
x
<
100, 10 < CO < 100, 10 < PST < 100).
From these two sources a database resulted with
134 species, each of which has 4 columns (nominal
variables) to account for general characteristics of
group 1, 15 columns with 1 indicating presence and
0 indicated absence of the related characteristics of
groups 2, 3 and 4, and four more columns to indicate
response to one of the four pollution levels. Some
codes names are based on the characteristics, for easy
reference. These characteristics are not exclusive: the
same species may have more than one characteristic
of the same group (for example, a species that is both
a shrub and fruit). In the case of species’ response
to pollution, a given species might have the same
response to one or more pollution levels. Among
responses to different pollution levels, there is an
implicit order, this is to say, that if a given species
is resistant to high pollution, it can be also resistant
or adapted to lower levels of pollution, but it can’t be
tolerant or sensible to lower pollution levels. Given
that all species are recommended for the urban forest
(s urb f or) and are adapted to low pollution levels
(lowpollution), these variables are not included in the
analysis. Data can be obtained from the following
address http://www.emse.fr/∼mathieu/data/trees/.
The 134 species are from 65 genera. Of those
genera, 72.39% are trees, 50% are shrubs, 4.48%
are palms, 11.94% are fruit, 66.42% are evergreen,
82.84% resist cold, 49.25% resist dryness, 32.09%
tolerate soil salinity, and 29.10% are tolerant to
mistreatment. With regard to planting site, 52.99% of
the genera are proposed for planting along, 97.01%
KDIR2014-InternationalConferenceonKnowledgeDiscoveryandInformationRetrieval
458
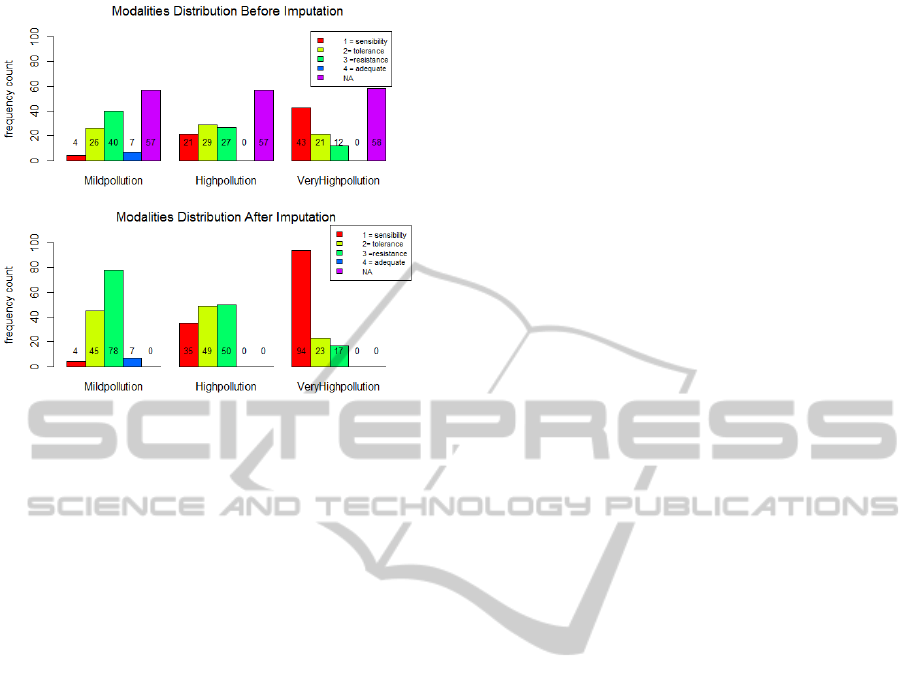
Figure 1: Distribution of modalities and missing values for
variables related to pollution (the percentage of the 134
species is shown in parentheses).
in urban recreational sites, 54.48% beneath electrical
lines, 86.57% in cemeteries, 78.36% in parking lots,
and 89.55% at sport fields.
Figure 1 shows the distribution of modalities
concerning species’ response to the three different
levels of pollution considered.
2.2 Classical Handling Missing Values
In the literature (Han and Kamber, 2006) different
non exclusive options to handle missing values are
proposed:
1. to ignore the values or the whole n-tuple
2. to replace missing values with a global value
3. to assign a value considering a statistical measure
like: the tendency, the most probable value
or the values generated, by simulating a given
distribution
4. to establish relationships, models or groups
obtained between non missing attributes of the
data set and values of variables, where missing
data is present. The use of statistical or
data mining techniques might be applied to
establish relationships and to obtain one or several
estimations of the missing value.
The results obtained are then used to replace
missing data. More details about all these methods
can be found in (Grzymala-Busse and Grzymala-
Busse, 2005).
Most of these methods are related to handle
missing numerical information and suppose that
information is missing due to error. Some of them
may delete information or add dummy information to
account for missing values.
In the case of the trees species data set work,
missing information is categorical and it is not due
to error. As shown in Figure 1 there are 57 missing
values (coded NA) on variables mild pollution and
highpollution; and 58 missing values on variable
veryhighpollution.
The simplest way to solve the problem of missing
values is to delete the corresponding observations or
the pollution variables (group 5) that have missing
values (method 1). However, that information is
an important factor, and eliminating it would result
in 42.45% of observations deleted, or 20% of the
pollution variables.
Another option is to assign missing modalities
according to frequency (method 3). The variable
lowpollution has just one modality (adequate), so
it would be assigned to all species. For the
other three variables in group 5, assigning the most
frequent modality means defining all the trees as
sensitive to very high pollution, tolerant of high
pollution, and adequate in tolerance to mild pollution.
The drawback to eliminating the missing values is
homogenization of the variables. Furthermore, if
random assignment of modalities is performed (even
according to frequency distribution), it could result in
instances, with not logic (without taking into account
the implicit order discussed before), for example a
tree may be categorized as sensitive to mild levels
pollution and adapted to high levels. These drawback
might be solved by considering just the distribution of
the triplets (of the three pollution levels) observed in
the instances with non missing values.
Finally a relationship might be established
between one or all variables of the groups 1 to 4, and
the three variables (group 5) related to pollution. The
use of multiple correspondence analysis as a mean
to find multiple relationships and to estimate missing
data is an example of this approach.
3 HANDLING MISSING VALUES
BY MULTIPLE
CORRESPONDENCE
ANALYSIS
Multiple correspondence analysis (MCA) is one
of the most widespread methods for analyzing
categorical multivariate data tables with I individuals
in rows and J variables (with at least two modalities)
in columns. Using the χ
2
distance helps to identify
the primary sources of variability and to examine
HandlingMissingDatainaTreeSpeciesCatalogProposedforReforestingMexicoCity
459
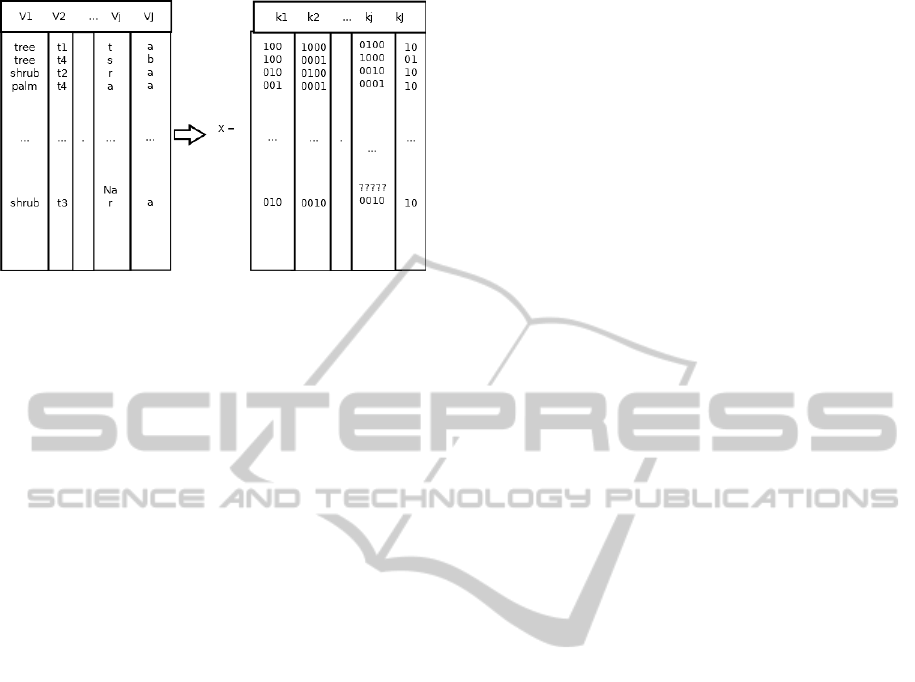
Figure 2: Indicator matrix generated from data.
and describe information contained in the original
categorical data using a reduced number of variables
(referred to as main factorial axes or components).
Each individual observation, variable or modality
can be represented by its coordinates relative to the
factorial axes. Categorical information is thereby
transformed through MCA into numerical form.
If k
1
, k
2
, k
3
, . . . k
j
, . . . , k
J
are are the number of
modalities for each respective variable, then an
indicator matrix X with I lines and K columns can
be constructed, where K =
J
∑
j=1
k
j
. For this, each
variable j in one column is decomposed in a group
of k
j
columns formed with k
j
− 1 zeroes and one to
indicate the presence of the modality. See figure 2
indicating this decomposition.
From X a Burt matrix B = X
t
× X is
constructed a contingency table from which classical
correspondence analysis (CA) can be applied to find
the factorial components (Lebart et al., 2006).
With non-missing data, it is possible to
reconstitute 100% of the original data from the
coordinates relative to the factorial components.
However, as the number of components used to
reconstitute original data is reduced, the error
increases.
To better understand this approach to handling
missing values, suppose that an individual species
has no value (coded NA) for a given modality of
a categorical variable with four modalities (s, t, r, a).
For the sake of simplicity, we assume that there is
not other more missing information. It then becomes
possible, based on the proportion of each modality,
to assign a missing value. Say, for example, that the
guess is [s = 0.3,t = 0.2, r = 0.1, a = 0.3]. MCA
is applied, and a number of S < K components is
retained to reconstitute the X matrix. To use MCA,
it is necessary to fulfill certain conditions, such as
having the same sum for all lines of the indicator
matrix; therefore, some corrections should be made
on the run. Suppose that, after several iterations, the
results are [0.5, 0.1, 0.1, 0.2]; NA is then substituted
by the modality s.
The algorithm, based on the work of (Josse et al.,
2012), is:
1.- Initialization:
l ← 0 imputation of missing modalities on
the indicator matrix X
(0)
(i.e., with proportions);
Verify conditions to apply MCA
2.- Iteration step for l
a) Estimation:
Perform MCA on the indicator matrix X
(l−1)
;
Obtain factorial components and retain S < K
components;
Get
ˆ
U
(l)
, size J × S, and coordinates
ˆ
F
(l)
, size
I × S;
Estimate missing values with
ˆ
X
(l)
←
ˆ
F
(l)
×
(
ˆ
U
(l)
)
t
;
b) Imputation:
Get the new indicator matrix X
(l)
by adding
the new values to the X:
X
(l)
← W × X + (1 − W ) ×
ˆ
X
(l)
;
with w
i j
= 0, if x
i j
is missing, and w
i j
= 1, if
it is not missing;
Update proportions and verify conditions to
apply MCA;
3.- Repeat step 2 until convergence, that is to
minimize
C =
W × X
(l)
−
ˆ
F ×
ˆ
U
t
2
S is chosen a priori, F are the coordinates, U are the
factorial axes and W the weights
This algorithm is extended to multiple imputations
to take data variability into account and to regularize
eigenvalues to avoid overfitting. Further details about
these modifications, validation tests with different
percentages for missing values, and applications to
other domains can be found in (Husson and Josse,
2013; Josse et al., 2012).
Once the indicator matrix is fully reconstituted
and there are no more missing modalities, MCA
is applied to examine and describe information,
as discussed earlier, on a reduced number of
components. The primary MCA results are a set
of factorial axes (or components) that represent an
important percentage of inertia and the coordinates
for individuals, variables, and modalities with respect
to those components. Data are examined by
visualizing the distribution of projections on the
coordinate plans generated by the factorial axes
and are confirmed using indicators such as the
contribution (individual, variable, or modality) to the
axes, the quality of representation, and correlation.
KDIR2014-InternationalConferenceonKnowledgeDiscoveryandInformationRetrieval
460
Significant values are selected based on the t.values.
Validation is performed by applying an algorithm
such as agglomerative hierarchical clustering (AHC)
to the retained coordinates. Algorithms to perform
multiple imputation, MCA and AHC are, respectively
in R libraries MissMDA and FactoMineR (R Core
Team, 2014).
4 RESULTS
MCA is applied directly to the Tree species data
set to assess the importance of missing values in
terms of inertia, their variability and the degree of
distinction from the individuals and variables without
missing values. Then the algorithm described above
is applied to estimate and to impute missing values.
Finally MCA is applied to imputed data and the
description of variables (as well as modalities) and
species distribution is realized in function of the main
components retained. AHC is used to define and to
identify groups of species.
4.1 Before Handling Missing Values
To evaluate the importance of missing values, an
MCA data exploration was performed for all 134
species and the 18 associated categorical variables:
tree, shrub, palm, fruitful, evergreen, tcold, tdry,
tmiss, tsal, s street, s urbrp, s parlot, s beleclin,
s cem, s sportf, veryhighpollution, highpollution and
mildpollution. Given that all species are proposed
for urban forest (s urbfor) and are adapted to low
pollution levels (lowpollution), these variables are
not included in the analysis. Direct application of
MCA with missing values requires addition of a new
variable to code missing values. The primary results
are as follows:
• The first three components represent, respectively
25.58%, 25.46% and 13.40% of total inertie, for
an accumulated inertia of of 64.44%.
• All 18 variables can be identified on the first
two components, although the pollution variables
appear to be outliers because they clearly separate
from the group
• Contributions, of each group of variables, to the
formation of the first there components are:
– C1.- Group 2: 28.56%, Group 3: 7.05%, Group
4: 36.16% and Group 5: 28.22%.
– C2.- Group 2: 2.53%, Group 3: 10.09%, Group
4: 18.19% and Group 5: 69.18%.
– C3.- Group 2: 27.97%, Group 3: 40.68%,
Group 4: 14.42% and Group 5: 16.91%.
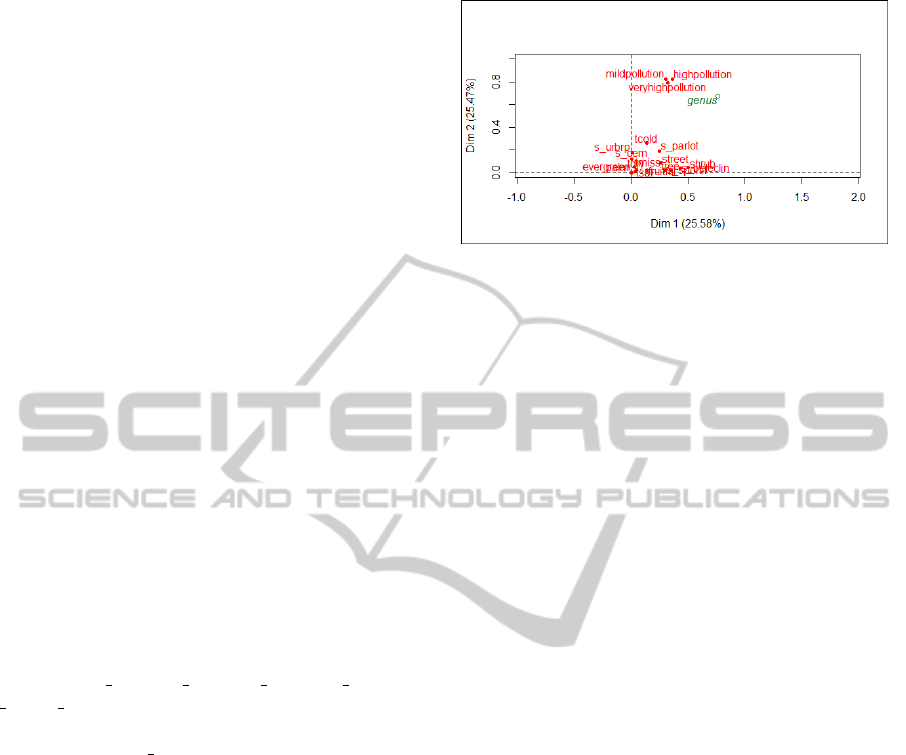
Figure 3: Results of MCA using initial data.
• The variables veryhighpollution, highpollution
and mildpollution represent an important
percentage of the inertie for each component.
• The missing modalities’ contribution of the
variables veryhighpollution, highpollution and
mildpollution are respectively: 12.20%, 12.78%
and 12.77%.
• Missing modalities are high correlated and very
well represented by the second axis; the quality of
representation values are close to 1 ( 0.87, 0.87 y
0.86).
• The contribution of species with missing values
to the formation of the first two components is
respectively: 34.17 and 48.29.
• Almost all specie with missing values, except one,
form a very well defined cluster.
The major contribution of the missing values
makes it difficult to analyze information with non-
missing information, but the fact that all individuals
comprise one cluster allows the possibility for
handling them with the same approach. Figure 3
depicts the first application of MCA to the initial data
with missing values.
Variable’s projections on the first two MCA
components show the pollution variables as outiliers,
which is the result of the high contribution of missing
values.
4.2 MCA Handling Approach for
Missing Values
The results of ”cross validation” and ”leave one out”
tests suggest retaining five components to reconstruct
the indicator matrix. From these components missing
data are estimated and used to reconstruct the
indicator matrix. Multiple correspondence analysis is
then applied to reconstructed data, again for all 134
species and the 18 categorical associated variables.
The distribution of modalities after MCA application
HandlingMissingDatainaTreeSpeciesCatalogProposedforReforestingMexicoCity
461
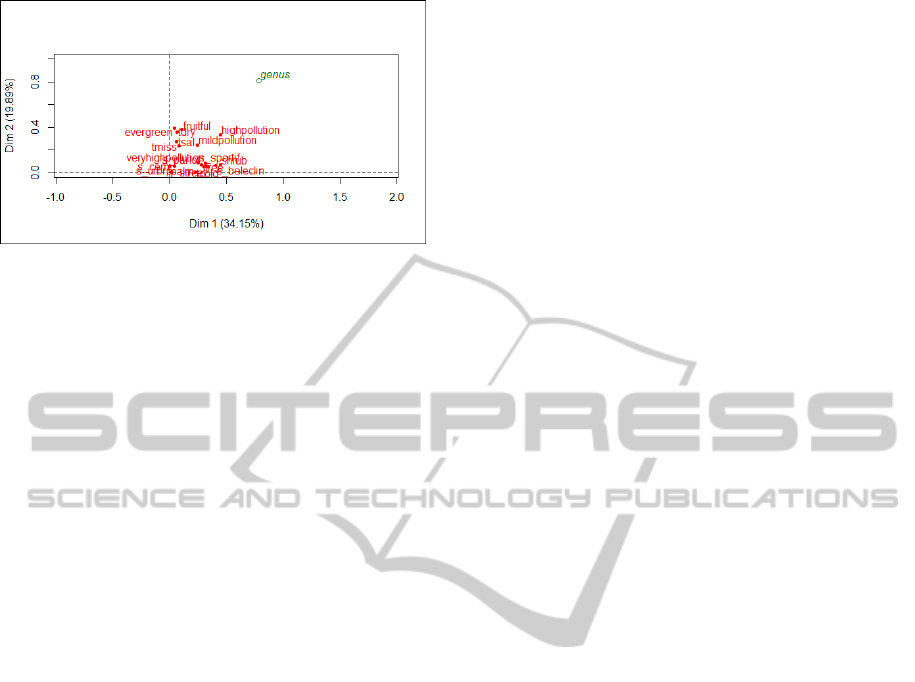
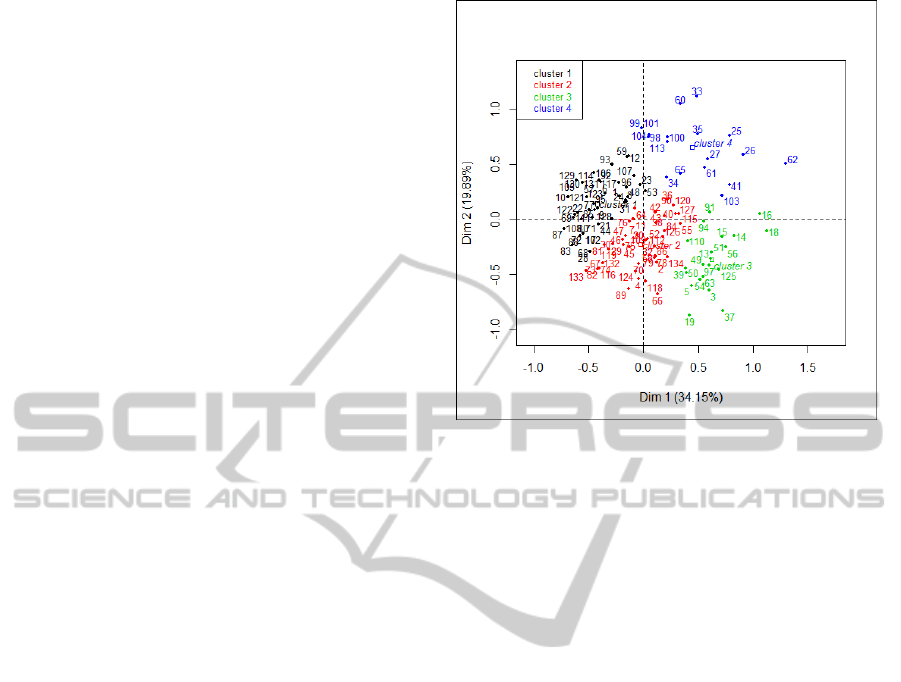
Figure 4: Results of MCA after handling missing values.
is presented in Figure 1. The primary MCA results
are as follows:
• The first three components represent, respectively,
34.15%, 19.89% and 12.97% of total inertia, for
an accumulated inertia of 67.01%. This is almost
the same as the one obtained before handling
missing values, but there is a slight increase in the
first component with a corresponding decrease in
the second.
• All 18 variables can be identified on the first
two components, although pollution variables no
longer appear to be outliers.
• Contributions of the groups of variables to the
formation of the first there components are:
– C1.- Group 2: 24.46%, Group 3: 11.86%, Group 4:
36.29% and Group 5: 27.38%.
– C2.- Group 2: 33.81%, Group 3: 31.02%,Group 4:
11.92% and Group 5: 23.23%.
– C3.- Group 2: 12.95%, Group 3: 14.59%,Group 4:
60.76% and Group 5: 11.69%
• The contribution of the variables
veryhighpollution, highpollution and
mildpollution has been reduced. No modalities
were created to handle missing values.
• The contribution of species that had missing
values to the formation of the first two
components is 43.49 and 48.17, respectively. This
means that no information was missing; therefore,
the contribution to both axes was balanced.
• No particular cluster for species that had missing
values was observed.
• No important change was observed when
modalities with low percentages were removed.
Figure 4 displays the pollution variables mixed
with the other variables.
These findings allow the components to be
described, as presented in the following section.
4.3 Data Exploration with MCA and
AHC
Description is based on variables correlation
(p.value < 0.05) with each of the first three
components (C1, C2 and C3) generated by MCA.
Variables correlation is indicated between parenthesis
and species are described according to the significant
variables modalities (t.value > 1.96) on each side
(positive or negative) of the specific component:
• Component 1: shrub (0.44), high pollution
(0.44), below electric lines (0.40), streets and
middle roads (0.33), tree (0.30), very high
pollution (0.31), parking lots (0.28), sport fields
(0.25), tolerance to cold (0.22) and genus (.79).
– Positive side: Species that are shrubs but
not trees; recommended for planting below
electric lines; not recommended for planting
in streets/medians, parking lots, and sport
fields; tolerant to high pollution and very high
pollution levels; not tolerant to cold.
– Negative side: Species that are trees but
not shrubs; recommended for planting in
streets/medians, parking lots, and sport fields;
not recommended for planting below electric
lines; sensitive to high and very high pollution
levels; tolerant to cold.
• Component 2: evergreen (0.39), fruitful (0.37),
tolerance to dryness (0.35), high pollution
(0.32),tolerance to soil salinity (0.27), genus
(0.80), tolerance of mistreatment (0.23), tolerant
of mild pollution levels (0.24)
– Positive side : not evergreen; not fruit;
not tolerant of dryness, soil salinity, and
mistreatment; tolerant to mild and high
pollution levels.
– Negative side : evergreen; not fruit; tolerant
to dryness, soil salinity, and mistreatment;
resistant to mild pollution.
• Component 3: recreational parks (0.37),
cemeteries (0.34), below electric lines (0.26),
parking lots (0.24), tolerance to cold (0.18), very
high pollution (0.19), shrubs (0.15), trees (0.11),
tolerance of dry conditions (0.11), genus (0.69).
– Positive side : not recommended for planting
in recreational parks, cemeteries, and parking
lots; not recommended for planting under
electric lines.
– Negative side : Species with characteristics
opposite the positive characteristics.
Species identification is easier if cluster analysis,
such as Agglomerative Clustering Analysis
KDIR2014-InternationalConferenceonKnowledgeDiscoveryandInformationRetrieval
462
(AHC) (Jain and Dubes, 1998; Grabmeier and
Rudolph, 2002) is applied to the species coordinates
generated by MCA. For example, AHC with the Ward
method and Euclidean distance, pre-establishing four
clusters (to identify observations on the four
quadrants obtained with components C1 and C2),
gives the results shown in Figure 4. For each cluster,
1 through 4, the following description can be made
regarding genera:
• Cluster 1 - Located on the second and third
cuadrants : Abies, Alnus, Pseudotsuga, Quercus,
Arbutus, Salix, Toxodium, Ulmus, Calocedrus,
Cedrus, Celtis, Chamaecyparis, Chirantoendrom,
Cupressus, Fraxinus, Junglans, Legerstroemia,
Liquidambar, Magnolia, Acer, Pinus, Alnus,
Platanus, Podocarpus, Populus.
• Cluster 2 - Centered and spread through the
first, third, and fourth quadrants: Quercus,
Araucaria, Robinia, Rosa, Schinus, Tamarix,
Thuja, Washingtonia, Yucca, Acacia, Cedrus,
Cupressus, Erythrina, Eucalyptus, Acacia,
Ficus, Ginkgo, Grevillea, Jacaranda, Juniperus,
Ligustrum, Magnolia, Olea, Phoenix, Acer,
Pinus, Pittosporum.
• Cluster 3 - In the fourth quadrant: Quercus,
Schinus, Beaucarnea, Buddleia, Buxus,
Calistemon, Cassia, Casuarina, Acacia,
Eucalyptus, Juniperus, Acacia, Ligustrum,
Nerium, Pittosporum, Populus, Prosopis.
• Cluster 4 - In the first quadrant: Prunus, Citrus,
Crataegus, Cydonia, Elaeagnus, Eryobotria,
Ficus, Malus, Morus, Musa and Persea.
These results provide insight into the validity of
the approach presented in this work. For example,
fruit species are found in Cluster 4. Cluster 1
primarily includes large trees appropriate for planting
along streets and in medians and that are tolerant of
high levels of pollution. Cluster 3 includes evergreen
species (not fruit) that can tolerate dryness, soil
salinity and mistreatment.
These results open the way for deeper data
explorations. For example, it would be interesting to
separate Cluster 2 into a group of trees and palms
and to evaluate the differences between species in
Cluster 1 and Cluster 2 because they are the same
genera. However, such an evaluation should be done
with care, considering the diverse characteristics of
Quercus and Pinus presented in this study.
Figure 5: Application of hierarchical clustering with Ward
method and euclidean distance, for 4 clusters.
5 CONCLUSIONS
After considering different options for handling
missing values pertaining to trees species tolerance
of and sensitivity to air pollution in Mexico City and
given that it is not currently possible to obtain reliable
information from official sources, this paper presents
an option for estimating and imputing missing values
of pollution related variables based on MCA.
The proposed approach has important advantages
because MCA is an adequate and well proven
technique for treating categorical variables. The
approach to estimate missing information does not
require to delete information, and it does not add
spurious information to account for missing values.
In theory basic data structure is not modified with
this approach, for example, in terms of importance
or possible associations between individuals and
variables with non-missing information. However it
would be worthwhile to apply other approaches to
estimate missing information and to explore changes
in data structure.
Further explorations with imputed missing values
should be undertaken, changing the number of
clusters generated, including the possibility of
evaluating the results with the assistance of an expert
in arboriculture in analysis of species similarities
within a genus. Nevertheless, the exploratory
results presented in this study agree with associated
variables such as genus and some important species
characteristics. These interpretations are, for the most
part, validated by the clustering results.
HandlingMissingDatainaTreeSpeciesCatalogProposedforReforestingMexicoCity
463

ACKNOWLEDGEMENTS
H
´
ector Javier V
´
azquez acknowledges the Universidad
Aut
´
onoma Metropolitana (Azcapotzalco) and
the Mexican National Council for Science and
Technology (CONACYT) for the Grant (Proposal
No. 208133-2013, Multidisciplinary Area 8).
Authors acknowledge Peggy Currid for her advice in
copyediting.
REFERENCES
Burden, D. (2008). 22 benefits of urban street trees. http://
km.fao.org/uploads/media/streettrees22benefits.pdf.
Carter, E. J. (1993). The potential of urban forestry
in developing countries: a concept paper. http://
www.fao.org/docrep/005/t1680e/T1680E01.htm.
EPA (2010). Air pollution. http://www.epa.gov/airtrends/
2010/report/airpollution.pdf.
Grabmeier, J. and Rudolph, A. (2002). Techniques of
cluster algorithms in data mining. Data Mining and
Knowledge Discovery, 6(4):303–360.
Grzymala-Busse, J. W. and Grzymala-Busse, W. J. (2005).
Handling missing attribute values. In Maimon, O. Z.
and Rokach, L., editors, Data mining and knowledge
discovery handbook, volume 1. Springer.
Han, J. and Kamber, M. (2006). Data Mining : Concepts
and Techniques. Morgan Kaufmann.
Husson, F. and Josse, J. (2013). Handling missing values in
multiple factor analysis, food quality and preference.
Food Quality and Preference, 30:77–85.
Jain, A. K. and Dubes, R. C. (1998). Algorithms for
Clustering Data. Prentice Hall.
Josse, J., Chavent, M., Liquet, B., and Husson, F.
(2012). Handling missing values with regularized
iterative multiple correspondence analysis. Journal of
Classification, 29:91–116.
Lebart, L., Morineau, A., and Piron, M. (2006). Statistique
Exploratoire Multidimensionnelle. Dunod.
R Core Team (2014). A language and environment for
statistical computing. http://cran.r-project.org/web/
packages/missMDA/missMDA.pdf and http://cran.
r-project.org/web/packages/FactoMineR/
FactoMineR.pdf.
SMA (2000). Manual T
´
ecnico para la Poda, Derribo y
Transplante de
´
Arboles y Arbustos de la Ciudad de
M
´
exico, Secretar
´
ıa del Medio Ambiente del Distrito
Federal. Secretar
´
ıa del Medio Ambiente del Distrito
Federal, M
´
exico, D.F. http://www.sma.df.gob.mx/
drupc/ capacitacion/ manual tecnico poda derribo
trasplante arboles.pdf.
SMA (2001). Manual T
´
ecnico para el Establecimiento
y Manejo Integral de la
´
Areas Verdes Urbanas
del Distrito Federal. Folleto Pr
´
actico. Secretara
del Medio Ambiente del Distrito Federal, M
´
exico,
D.F. http://www.paot.org.mx/centro/ceidoc/archivos/
pdf/manual manejo areas verdes folleto practico.pdf.
Watson, G. (2011). Fifteen years of urban tree planting
and establishment research, trees, people and the built
environment. In Proceedings of the Urban Trees
Research Conference, pages 63–72.
KDIR2014-InternationalConferenceonKnowledgeDiscoveryandInformationRetrieval
464
