
Combining Clustering and Classification Approaches for Reducing the
Effort of Automatic Tweets Classification
Elias de Oliveira
1
, Henrique Gomes Basoni
1
, Marcos Rodrigues Sa´ude
1
and Patrick Marques Ciarelli
2
1
Programa de P´os-Graduac¸ ˜ao em Inform´atica, Universidade Federal do Esp´ırito Santo, Vit´oria, Brazil
2
Programa de P´os-Graduac¸ ˜ao em Engenharia El´etrica, Universidade Federal do Esp´ırito Santo, Vit´oria, Brazil
Keywords:
Text Classification, Social Network, Textmining.
Abstract:
The classification problem has got a new importance dimension with the growing aggregated value which has
been given to the Social Media such as Twitter. The huge number of small documents to be organized into
subjects is challenging the previous resources and techniques that have been using so far. Futhermore, today
more than ever, personalization is the most important feature that a system needs to exhibit. The goal of many
online systems, which are available in many areas, is to address the needs or desires of each individual user. To
achieve this goal, these systems need to be more flexible and faster in order to adapt to the user’s needs. In this
work, we explore a variety of techniques with the aim of better classify a large Twitter data set accordingly to a
user goal. We propose a methodology where we cascade an unsupervised following by supervised technique.
For the unsupervised technique we use standard clustering algorithms, and for the supervised technique we
propose the use of a kNN algorithm and a Centroid Based Classifier to perform the experiments. The results
are promising because we reduced the amount of work to be done by the specialists and, in addition, we were
able to mimic the human assessment decisions 0.7907 of the time, according to the F1-measure.
1 INTRODUCTION
Social Media is presenting us with a lot of
users’ information worthwhile for market analysis,
event planing, product monitoring and many more.
However, the challenging is still to deal with all this
information at once and unveil its hidden semantic
layers.
Twitter may be one of the social network most
currently studied. The most common approach to
work with Twitter data is to collect a number of
tweets from Twitter’s API based on some given
keywords or previously known hashtags (Bruns and
Liang, 2012; Gundecha and Liu, 2012). We choose
the hashtags, or keywords, which encompass the
subjects we have interest in study. Nevertheless,
using solely these tools to find and understand the
messages conveyed by the goal masses is not good
enough due to hashtags hijacking actions (Hadgu
et al., 2013), variety of viewpoints within community,
among other problems. Hence, traditional subject
text classification plays an important role in the
organization of this type of short documents. In fact,
the huge number of small documents to be organized
into subjects is challenging the previousresources and
techniques that have been using so far (Sebastiani,
2002; Berry, 2003).
In addition, tweets differ from traditional
documents in the point that users are forming
their own linguistic tribes (Bryden et al., 2013).
Sometimes no clear formal rule is applied while
people express themselves through these languages.
Usually, in these cases, the meaning is grasped by
association, by human inference from the context, or
only by individuals within the communities. This is
one of the major problems when dealing with tweets
documents if we are interested in having the message
processed, and understood, by machines.
As a consequence, some researches are still
struggling with great manual effort for the
classification of their data sets, when they are
interested in more realistic meaning of the messages
being analyzed.
In this work, we introduce a combination of two
strategies usually used separated. We propose the
use of clustering and re-clustering process over the
entire a data set so that a user can have a quick over
view of the content within this data. By given an
overview of the data structure space, the user can
make easier decisions on the classes which s/he wants
465
de Oliveira E., Gomes Basoni H., Rodrigues Saúde M. and Marques Ciarelli P..
Combining Clustering and Classification Approaches for Reducing the Effort of Automatic Tweets Classification.
DOI: 10.5220/0005159304650472
In Proceedings of the International Conference on Knowledge Discovery and Information Retrieval (KDIR-2014), pages 465-472
ISBN: 978-989-758-048-2
Copyright
c
2014 SCITEPRESS (Science and Technology Publications, Lda.)

to closely observe from that point on in time. At
this point this user can further structured the data set
by assigning labels to sample. The assigning labels
process is guided by our proposed procedure and it
tries to minimize the build of good training sample
for the classification process that follows.
This work is organized as follows. We present
the general problem and its context in Section 2. In
Section 3, some related works are briefly reviewed.
In Section 4, we describe how the experiments
were performed and the results obtained by a group
of strategies we used to achieve the high level of
accuracy in our results. The conclusions are then
presented in Section 5.
2 THE PROBLEM DESCRIPTION
In order to mining what people are effectively saying
within an event mediated by Social Media, many
researchers have come to the task of manually
classifying their data sets according to some subjects.
This was the case when we have decided to analyze a
Brazilian national discussion data set regarding to the
Marco Civil for the internet.
The discussion of a Marco Civil for the internet
by the Brazilian parliament begun in October 27th
of 2009, together with the creation of the hashtag
#MarcoCivil
and the
@MarcoCivil
Twitter profile.
The discussion was in a very slow pace since
the beginning of the discussion. The leak by
Edward Snowden
1
that the U.S. government had
obtained unauthorized confidential information about
some international governments, has triggered the
motivation for the Brazilian politicians to intensify
the discussion about the implementation of rules for
the use of internet in Brazil. Due to especially this
event the number of comments on the Social Media
has greatly increased. Many people started expressing
their opinions via twitter, for instance. In the light of
that, we collected a data set of messages within the
period from August of 2012 to December of 2013. We
sought the twitter data stream via the keyword
"marco
civil"
and any hashtag which contains the sub-string
marcocivil
.
There are several opinions about this theme.
In order to better address the social problem, the
government and politicians need to understand each
class of demands to work on a social consensus.
Considering that a good sample of the society were
using the Twitter social media to express their truly
1
Edward Snowden is a former employee of the National
Security Agency
opinion, this media can be used as a good sample
of the population opinions. Nevertheless, we still
need to read and manually label some of these
opinions according to our own understanding so that
the machine can later imitate our way of organizing
the information. Note that each group of analysis
can have their own objectives and, therefore, can
label differently the same data set. We argue that
although one can use predefined classes to classify
tweet messages (Sriram et al., 2010), such strategies
are not always accurate with regard to the user’s
needs.
The problem we are interested in solving is that
given a set Ω ⊂ D of unlabeled data set, work with
the specialist sample by sample of this data set, asking
them to label these samples. The goal at this point
is to minimize the number of steps to gather a set
of good labeled examples in order to provide the
user with some as precised as possible suggestions
for the classification of what is left in the data set.
Figure 1 depicts our combined model to minimize the
necessary amount of work when one want to organize
a data set according to the user’s subjects within it.
Figure 1: Clustering-Classification combined model for
minimizing the effort of classifying a large data set of
tweets.
The general idea is that we initially have D,
the domain of documents. From this domain we
are going to work with S
l
, a subset of D. Every
document d
i
∈ S
l
are prepossessed and represented as
a vector of features, therefore S
l
= {d
1
,. .., d
|S
l
|
} is
our given sample data set. The process is such that the
user is going to assign labels to each {S
1
,S
2
,. ..,S
p
}
until the user feels satisfied with the homogeneous
characteristics within each cluster. At this point,
S
p
i=1
S
i
= Ω, where i = 1,2, ... ,l, ... , p, p ≤ n, and
we expect to have |Ω| ≪ |D|.
We present each part of this model in the
following subsections.
KDIR2014-InternationalConferenceonKnowledgeDiscoveryandInformationRetrieval
466

2.1 Text Clustering
The Text Clustering Problem is usually defined as
a task of identifying natural groupings of texts, or
documents d
i
. This process is usually carried out on
the basis of their extracted features (Jain et al., 1999;
Everitt et al., 2011). In other words, given a finite
set of documents, this multidimensional problem is to
cluster similar objects together. Due to the difficulty
to define what a good clustering is (Kleinberg, 2002),
we consider putting the user in the loop of our
clustering process, as shown in Figure 1. Thereby,
the user will decide how many groups are necessary
to represent their needs.
After the first step of clustering D, a sample S
i
will
be given to the user to assign labels of their interest.
Now, with this new input our system can improve its
clustering result by taking into account what the user
wants as grouping result. During this process, thus,
different similarity measures can be tested in order to
be more coherent with what the user intends. Hence,
a new clustering step can be carried out until the user
is satisfied with the groupings (Vens et al., 2013).
The loop between the building of each sample S
i
and the decision of another re-clustering – this is a
user decision, aims for turning each cluster as much
homogeneous as intended by the user. Therefore, this
is a continuous process of convergence guided by the
expert based on the level of their interest and quality.
2.2 Text Classification
The Text Classification Problem is usually defined as
a task of assigning labels from a predefined set of
classes to unclassified documents (Baeza-Yates and
Ribeiro-Neto, 2011; Sebastiani, 2002).
Let D be the domain of documents, C =
{c
1
,. ..,c
|C |
} a set of pre-defined classes, and
Ω = { d
1
,. ..,d
|Ω|
} an initial corpus of documents
previously classified manually by a domain expert
into subsets of categories of C . In the machine
learning process, the training(-and-validation) set
TV = {d
1
,. ..,d
|TV|
} contains documents, each
associated with its respective label c
i
∈ C . TV
is used to train and validate (i.e., to tune eventual
parameters of) a classification system that associates
the appropriate combination of classes with the
characteristics of each document in the TV. The
test set Te = {d
|TV|+1
,. ..,d
|Ω|
}, conversely, contains
documents for which the categories are unknown to
the classification system. After being (tunned and)
trained with TV, the classification system is used to
predict the set of classes of each document in Te.
To statistically validate the experiments, we
apply the k-fold validation tests. We divide the
|Ω|-documents into at least k parts, and we used
one part as Te for each experimental run, and the
other k − 1 parts are used as TV. k experiments are
performed, where each experiment uses a diferent
part as Te.
There are many ways to evaluate a text classifier
system. The classical approach is to take a binary
function F : D × C → {0, 1} that assigns a value of 1
when the document d
i
belongs to the class c
j
, where
[d
i
,c
j
] ∈ {D × C }; and 0 otherwise.
3 RELATED WORKS
Usually the strategies which have been used to
collect and analyze social media events, in particular
from Twitter social media, are based on a careful
selection decision about the number of hashtags and
keywords that should be chosen in advance (Bruns
and Liang, 2012; Makazhanov et al., 2014) in order
for monitoringthe movimentswhich we are interested
in to follow. This methodology has shown to be, in
certain cases, not good enough to capture the depth
of what actually happens within the social moviments
(Hadgu et al., 2013). Thereby, it is presented in
(Sriram et al., 2010) a strategy to deal with the
problem of mining this social media by actually
classifying the short messages passed on by users
through tweets.
In (Sriram et al., 2010) is proposed an approach to
classify incoming tweets into a predefined category.
They consider the following categories: News,
Events, Opinions, Deals, and Private Messages.
To achieve their goal, they used only 8 types of
features within the tweets. The first feature was the
1) authorship. They claim by empirical results that
authorship plays a crucial role in classification. In
fact, it is a reasonable assumption to think authors
identify themselves with a few specific subjects. The
other features were 2) presence of shortening of
words and slangs, 3) time-event phrases, 4) opinioned
words, 5) emphasis on words, 6) currency and
percentage signs, 7) @username at the beginning
of the tweet, and 8) @username within the tweet.
They show experimentaly an enhanced outcoming
of accuracy and their approach outperformed the
traditional Bag-Of-Words strategy. Their results
showed 32.1% of improvement on average over
Bag-Of-Words.
The work presented in (Kyriakopoulou and
Kalamboukis, 2007) is the basis for our work.
Theirs goal is to explore intrinsic information
unveiled by the first clustering process phase when
CombiningClusteringandClassificationApproachesforReducingtheEffortofAutomaticTweetsClassification
467

applied over the whole data set, both training and
testing examples, to improve the second phase of
classification. Their experiment results in fact showed
that for all the collections which they tested, their
clustering approach combined with two versions of
a SVM-classifier outperformed the standard SVM
classifier without the clustering phase. They reported
an improvement in performance by the combined
approach on all cases studied. The best improvement
reported was on average by 6.6% when the SVM
classifier is used with clustering and by 3.2% when
the transductive SVM classifier is used accordingly.
Although we can observe improvements on the
classification accuracy in our experiments, our main
goal is differently to apply our combined approach to
build a good and still reduced labeled sample for the
training data set.
In the next section, we show some of the results
of our strategy over a Brazilian tweets data set.
We discuss the results firstly without the use of the
clustering phase, and later with the clustering phase
as a process to form a training set for the following
classification phase using the kNN and the CBC
algorithms.
4 EXPERIMENTS AND RESULTS
We collected the tweets from August of 2012 until
December of 2013, gathering a total of 21000 in 2012,
and 110000 in 2013 tweets. For doing so, we sought
for any hashtags with the sub-string
marcocivil
.
After removing all the identical tweets and some other
unreadable tweets due to some problems during the
collecting process, we ended up with 2080 tweets.
Each tweet was manually classified in 2 meta
categories far before we carried out the experiments
discussed in this work. The first meta-class was
named Political Positioning, which aims for assigning
a tweet message into one of its 3 classes: Neutral,
Progressive, and Conservative comments. Tweets
which messages are not clear enough with regarding
to the political positioning were assigned to the
Neutral class. For those which messages were
clearly in favor of the broadening and deepening
of the discussions we assigned to the Progressive
class. To Conservative class were assigned all the
messages which were against any change of the
current legislation. The results of this meta facet of
the data set is presented under the name Marco Civil
I.
Under the name of Marco Civil II we refer
to the second meta-class, Opinion. The goal is
now to assign a tweet message to one of its 9
classes: Alert, Antagonism, Support, Compliance,
Explanation, Indignation, Information, Mobilization,
and Note. Alert is a class to aggregate all the tweets
which draw people attention to the evolution of the
discussion within the parliament. For instance, this
user is pointing out that the politicians are trying to
include a nonsense subject – Copyright Rights – into
the core of the Marco Civil project, a strategy usually
used to postpone the main point of a discussion:
@penas – V˜ao usar o Marco Civil da
Internet para defender o copyright. E querem
votar hoje! Nem pensar, esse assunto precisa
sair fora!
The Antagonism class gathers the messages in
opposition of the approval of the Marco Civil project.
In the following example, the user says we do not
need the government saying what we can or cannot
do on the Internet:
@RobertoElleryJr – Eu apoio a
campan[h]a contra o marco civil na internet.
n˜ao precisamos do governo nos dizendo o que
fazer
Differently from the previous class, the Support
class represents those tweets in favor of both
discussion and approval of the Marco Civil project.
Although the Compliance class has messages
showing sympathy towards the project, they do not
show openly support to a official legislation of
the matter. Some people posted messages mainly
for commenting and analyzing the evolution of the
discussions about the project. We assigned these
messages to the class Note. Although very similar
to the previous class, the class Information aims
at gathering those tweets which share with the
community some sort of news about the project, not
a personal opinion. All tweets which explain what
Marco Civil project is, the legislation proposals and
their consequences were grouped within the class
Explanation. The Indignation class stands for those
users who are against the news press attitude, the way
the deputies postponed the voting in the parliament,
and essentially the lack of any kind of legislation
about the use of internet in Brazil. Finally, the class
Mobilization gathers those messages which try to
bring people to participation, to engagement into the
movement. The following is a tweet calling people
to send message to their deputies in the Marco Civil
Especial Committee in the parliament:
@idec – Envie uma mensagem agora aos
deputados da Comiss˜ao Especial do Marco
Civil! http://t.co/kslJpTOh
In Table 1, we show the characterization of both
two points of view of the same Marco Civil data
KDIR2014-InternationalConferenceonKnowledgeDiscoveryandInformationRetrieval
468

Table 1: Characterization of the data sets used in the experiments.
Data set ASDC (x) ASCC ASPC (y) Ratio (y/x)
Marco Civil (I) 0.561809 0.989217 0.967745 1.722553
Marco Civil (II) 0.568465 0.962814 0.918002 1.614879
set. ASDC is the Average Similarity between every
Documents of a class and their respective centroids.
On one hand, the values in Table 1 show that the
tweets of the same class are spatially well separated
due to the lowASDC value. On the other hand, ASCC
is the Average Similarity between the centroids of
each class and the main centroid, and the ASCC value
is high, close to the maximum value. Hence, we can
say that the centroids of the classes are very close to
the main centroid. ASPC is the Average Similarity
between Pairs of centroids. The high value of ASPC
indicates that the classes are overlapping, causing
high rates of y/x. One can, therefore, conclude that
the tweets of any categories are spatially quite mixed,
which complicates the classification of the tweets
within this data set.
4.1 Clustering Experiments
The objective of the clustering phase is to help the
user with labeling their data set with as minimal
steps as possible. At this phase the user sets up a
threshold ρ for the average similarities between pairs
of elements within each cluster.
We adopted a very naive strategy but very
effective for our problem. We used the CLUTO
TM
Clustering Toolkit (Karypis, 2002) with a divisive
clustering algorithm with repeated bisections. Our
strategy is such that for each yielded cluster,
according to the setting up ρ value, we asked
the user to assign labels to the most dissimilarity
pair of elements. Should an identical label is
given to both elements, we assign this label to the
remaining elements of the cluster, forming a S
i
subset.
Otherwise, we put this cluster apart and recursively
treat it as if it was a new data set itself.
Applying this strategy, we carried out some
experiments. In Table 2, we show some values for
ρ and its impact on the amount of work passed on
to the user, the average number of clusters generated,
avgNC, on each step of our strategy. Note that for
each generated cluster we ask the user to assign a pair
of labels, that is to say that, given that was necessary
30 Steps to cover the whole data set when ρ is 0.8, for
Marco Civil I, this user is asked to assign 2× 7× 30=
420 labels plus a number 1,111 of labels which could
not be aggregated into any cluster. This and other
Table 2: Clustering process phase results.
ρ avgNC Steps Error(%)
Marco Civil I
0.6 5 29 12.21
0.75 7 37 16.39
0.8 7 30 15.71
0.9 6 17 2.84
0.95 4 11 0.04
Marco Civil II
0.6 6 46 39.25
0.75 8 31 20.44
0.8 9 25 19.32
0.9 6 38 17.53
0.95 5 29 8.59
results are depicted in Figure 4. In this case, our Error
is on average of 15.71%, in other words there are less
than 327 tweets within the data set which received an
incorrect label. In the second case, even if we relax
value of ρ down to 0.6 for the average similarities
among the elements within each cluster, the error did
not change significantly.
On the Marco Civil II data set, the avgNC number
of clusters varied from 29 (ρ = 0.95) to 46 (ρ = 0.6).
Although we can see a great impact on the number of
steps for ρ= 0.6 showing that the recursive part of the
process was more demanded in this case, the amount
of work carried out by the user was still reduced when
comparing with that of having to assign labels to the
whole data set.
From these results we can also imply that should
one adopt a value of ρ = 0.95 as the number of
assigned labels, the error of mislabeling do not
increase much more than that of the other values, on
the contrary the error is greatly reduced.
4.2 Classification Experiments
Although each tweet is classified concurrently in
both of these 2 meta categories, which could then
be treated as a multi-label classification problem
(Ciarelli et al., 2013), in this work we tackled this
problem as an one-label classification problem in each
one of our 2 meta categories: Marco Civil I and II.
CombiningClusteringandClassificationApproachesforReducingtheEffortofAutomaticTweetsClassification
469

The data set Marco Civil was pre-processed by
removing some stopwords. Each word was turn into
their stem form by the use of the algorithm Reducer
Suffixes in Portuguese Language (RSLP) proposed in
(Orengo and Huyck, 2001). This algorithm considers
the extraction of stem of words through eight steps,
consisting of the removal of the plural form, feminine
form of the word, adverbial form, augmentative or
diminutive form, verb endings, removing vowels and
accents. A major advantage of using this process
of stem extraction under Portuguese Language is the
use of an external and editable dictionary of rules.
This dictionary contains about 32,000 words, with
rules for their proper stemming, allowing relocate its
content or even improving extraction by inserting new
exception rules within its configuration. In addition,
we applied a set of feature selection techniques during
the training phase with the goal of eliminating noising
terms and to keep as much as possible just the
terms which could contributepositivelyfor the correct
classification results.
We have chosen to use two well known
algorithms. The choice of these algorithms was
based on the aim at comparison with the results we
can find in the literature. To this end, kNN (Soucy
and Mineau, 2001) is a well known classifier widely
used in experiments involving information retrieval,
and it has been shown to yield good results in vary
situations. It measures the distance between every
documents within the training subset of the data set
and tested document, and then their distances are
ranked. The most common class in the k nearest
documents is chosen to be the class for the tested
document.
Another classifier used in our experiments is the
CBC (Centroid-Based Classifier) (Han and Karypis,
2000), which classifies each tested document based
on its proximity to a given category’s centroid of the
data set. The choice of this approach is also because
of its implementation simplicity and for being fast
both for training and for testing a large number of
documents within our data set.
For both classifiers, we are using the cosine of
the angle between any two documents and their
class centroids to measure their similarities. The
metrics Recall (Equation 1), Precision (Equation 2)
and F1-measure (Equation 3) were adopted in this
work to evaluate the classification results, as shown
below:
Recall(C
p
) =
TP(C
p
)
TP(C
p
) + FN(C
p
)
(1)
Precision(C
p
) =
TP(C
p
)
TP(C
p
) + FP(C
p
)
(2)
F1-measure(C
p
) =
2Precision(C
p
) × Recall(C
p
)
(Precision(C
p
) + Recall(C
p
))
(3)
where TP is the number of documents correctly
assigned to class C
p
by automatic classifier, FP is
the number of documents incorrectly assigned to the
class C
p
by automatic classifier and FN is the number
of documents belonging to class C
p
and incorrectly
classified by the automated classifier as belonging to
another class.
The experimental results were obtained applying
k-fold cross validation and calculated the average
values for Precision, Recall and F1-measure. In
order to optimize the parameters of the techniques,
9 folds were used for training and another fold was
used for validation. The elements to form each fold
were randomly chosen so that each fold has balanced
number of elements for each class. We repeated this
process 50 times to calculate some statistics out of
these experiments.
4.3 Analysis the Results
We tested many k values for the kNN algorithm in
order to increase the F1-measure metric. So, the value
of k which achievedthe highest F1-measure was k = 1
for both version of the data set, thus we chose this
value to carry out the rest of our experiments. Figure
2 displays a comparison chart of this calibration, the
selected k (horizontal axis) against the F1-measure
metric (vertical axis) for the data set Marco Civil I.
Figure 3 for the data set Marco Civil II.
0 10 20 30 40 50 60
0.4 0.6 0.8
Neighborhood Size
F1 − Measure
Figure 2: The kNN best k for Marco Civil I.
0 10 20 30 40 50 60
0.0 0.2 0.4 0.6
Neighborhood Size
F1 − Measure
Figure 3: The kNN best k for Marco Civil II.
KDIR2014-InternationalConferenceonKnowledgeDiscoveryandInformationRetrieval
470
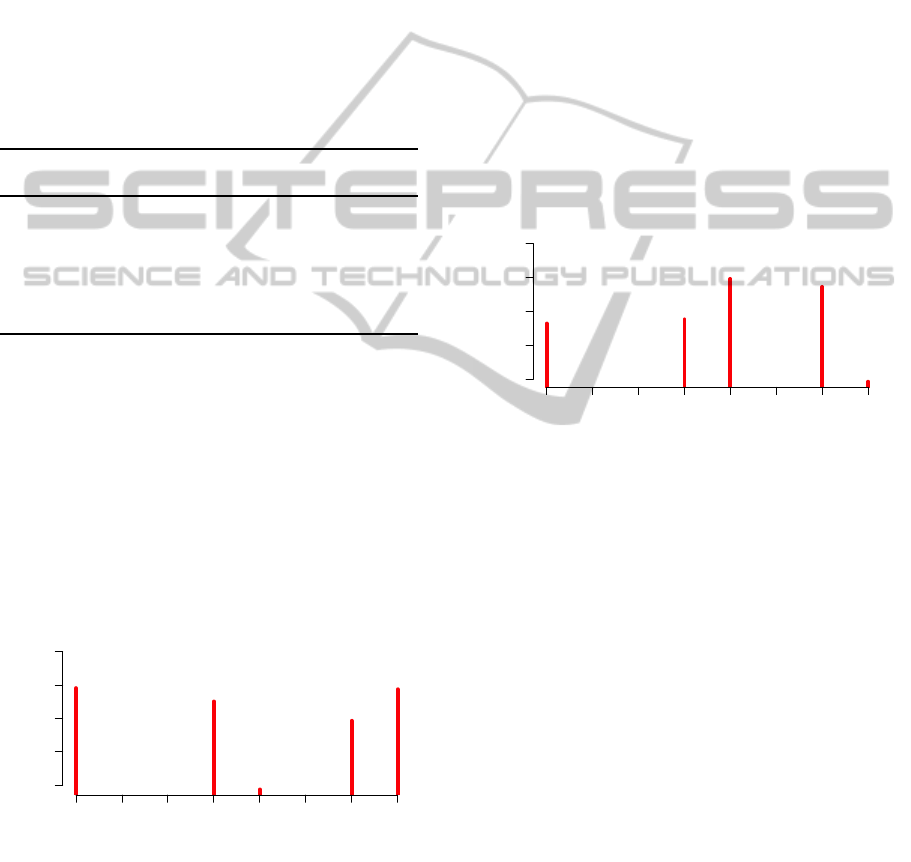
The calibration of a kNN consists in finding its
best value for k. When k = 1 it means that we are
using the very one nearest neighbor for deciding a
class for the testing new document. Differently, the
CBC uses the centroid of the training class for finding
this class for the same testing new document. Hence,
the latter approach uses more neighbor documents to
make a decision. The result of these two approaches
are shown in Table 3.
We performed an experiment with the initial status
of the data set, considering a pure classification
problem. Hence we prepossessed the 2080 registers
according to what is described in Section 4.2. The
results are shown in Table 3.
Table 3: The results of kNN & CBC classification.
Data
Set Classifier Recall Precision F1
I
kNN 0.4858 0.4955 0.4853
CBC 0.4941 0.4920 0.4884
II
kNN 0.5042 0.6079 0.5381
CBC 0.5667 0.6146 0.5253
The results show us that the CBC approach is
slightly better than the kNN with respect to the
F1-metric in Marco Civil I, but slightly worse Marco
Civil II. With this data set the CBC is functioning on
average as a good classifier for the testing documents.
An interesting result is that the CBC algorithm is
better in the Recall metric in both cases. The results
also show that the centroid of a class gives a better
memory of the class position than a single document.
In this experiments, the simple nearest neighbor is
slightly better on the Precision metric for Marco Civil
I.
0.60 0.65 0.70 0.75 0.80 0.85 0.90 0.95
0.5 0.7 0.9
ρ
F1 − Measure
327
1178
1531
1723
1888
Figure 4: Performance of the kNN classifier used after
clustering process – Marco Civil I.
Another experiment we carried out is that of
considering first the clustering process described in
Section 4.1. In this process the user is asked to assign
a number of labels during this clustering phase. As
mentioned before, we claim that this clustering phase
can spare the user from a lot of work on assigning
labels for the classification problem. In Figure 4,
we show the results for each value of ρ, the number
of labels assigned by the user and the quality of the
classification afterwards.
These results show us that even when the
clustering phase is very tight, ρ = 0.95, the number
of assigned labels was only 1888 elements of the data
set, whereas for value of ρ = 0.60 the number of
assigned labels came down to 327. Note that even
for ρ = 0.60 the value of F1-metric is better than
that when yielded by the classification problem in
the beginning of this section. This is to show that,
applying a clustering process as a starting point for a
problem as this one discussed here can in fact spare
the user from a lot of work. The only case where the
F1-metric results of classification has been worsened
by the clustering phase is that when we chose ρ = 0.8.
0.60 0.65 0.70 0.75 0.80 0.85 0.90 0.95
0.3 0.5 0.7
ρ
F1 − Measure
538
1227
1471
1883
2000
Figure 5: Performance of the kNN classifier used after
clustering process – Marco Civil II.
Marco Civil II is a version of the data set where
we seek to assign 9 different labels/class, whereas
in the first case was three. This is a possible cause
for the poor results in this version, as we are dealing
with the same set of texts. We managed to improve
the F1-metric when choosing ρ = 0.80 and ρ = 0.90,
F1-metric=0.59 and 0.57, respectively. The other
results were worsened the F1-metric when compared
with the results yielded in Table 3. Nevertheless, in all
the cases the number of assigned labels was reduced.
5 CONCLUSIONS
In this paper, we propose a strategy to reduce the
user’s effort on classifying a large data set of tweets
by introducing a clustering phase as a first step of
the whole process. The ultimate goal is to have a
good, flexible and fast algorithm to help an expert
with the semi-automatically classification process of
large tweets’ data sets.
CombiningClusteringandClassificationApproachesforReducingtheEffortofAutomaticTweetsClassification
471

For the clustering process we used a Clustering
Tookit to clusters the tweets. For the classification
phase, we applied two classical algorithm strategies,
kNN and CBC, in order to be able to analyze the
impact of them on the results. In the experiments
we analyzed a variety of clustering configurations and
their influence on the following step of the proposed
strategy: the classification phase.
The comparison of the results obtained by our
strategy and that produced by an expert revealed that
our approach was able to imitate the human expert up
to 0.7907% of the times. These findings also showed
that we can greatly reduce the effort of the expert.
Our future work is in the direction of find a way to
predict the best ρ to start with the clustering process
in order to minimize the effort and maximize the
accuracy of the classification process.
ACKNOWLEDGEMENTS
The first author would like to thanks CAPES for its
partial support on this research under the grant n
o
BEX-6128/12-2.
REFERENCES
Baeza-Yates, R. and Ribeiro-Neto, B. (2011). Modern
Information Retrieval. Addison-Wesley, New York,
2 edition.
Berry, M. W. (2003). Survey of Text Mining: Clustering,
Classification, and Retrieval. Springer-Verlag, New
York.
Bruns, A. and Liang, Y. (2012). Tools and Methods
for Capturing Twitter Data During Natural Disasters.
First Monday, 17(4).
Bryden, J., Funk, S., and Jansen, V. A. A. (2013). Word
Usage Mirrors Community Structure in the Online
Social Network Twitter. EPJ Data Science, 2(1):3+.
Ciarelli, P. M., Oliveira, E., and Salles, E. O. T.
(2013). Multi-label Incremental Learning Applied to
Web Pages Categorization. Neural Computing and
Applications, pages 1–17.
Everitt, B. S., Landau, S., Leese, M., and Stahl, D. (2011).
Cluster Analysis. John Wiley & Sons, Ltd, London, 5
edition.
Gundecha, P. and Liu, H. (2012). Mining Social Media: A
Brief Introduction. Tutorials in Operations Research,
1(4).
Hadgu, A. T., Garimella, K., and Weber, I. (2013). Political
Hashtag Hijacking in the U.S. In Proceedings of
the 22Nd International Conference on World Wide
Web Companion, WWW ’13 Companion, pages
55–56, Republic and Canton of Geneva, Switzerland.
International World Wide Web Conferences Steering
Committee.
Han, E.-H. S. and Karypis, G. (2000). Centroid-Based
Document Classification: Analysis and Experimental
Results. Springer.
Jain, A. K., Murty, M. N., and Flynn, P. J. (1999). Data
Clustering: a Review. ACM Computing Surveys,
31(3):264–323.
Karypis, G. (2002). CLUTOa Clustering Toolkit. Technical
report, Dept. of Computer Science, University of
Minnesota. Technical Report 02-017.
Kleinberg, J. (2002). An Impossibility Theorem for
Clustering. pages 446–453. MIT Press.
Kyriakopoulou, A. and Kalamboukis, T. (2007). Using
Clustering to Enhance Text Classification. In 30nd
International ACM SIGIR Conference on Research
and Development in Information Retrieval, pages
805–806, New York, NY, USA. ACM Press.
Makazhanov, A., Rafiei, D., and Waqar, M. (2014).
Predicting Political Preference of Twitter Users.
Social Network Analysis and Mining, 4(1).
Orengo, V. M. and Huyck, C. R. (2001). A Stemming
Algorithmm for the Portuguese Language. In SPIRE,
volume 8, pages 186–193.
Sebastiani, F. (2002). Machine Learning in Automated Text
Categorization. ACMComputing Surveys, 34(1):1–47.
Soucy, P. and Mineau, G. W. (2001). A Simple KNN
Algorithm for Text Categorization. In ICDM
’01: Proceedings of the 2001 IEEE International
Conference on Data Mining, pages 647–648,
Washington, DC, USA. IEEE Computer Society.
Sriram, B., Fuhry, D., Demir, E., Ferhatosmanoglu, H.,
and Demirbas, M. (2010). Short Text Classification
in Twitter to Improve Information Filtering. In 33rd
International ACM SIGIR Conference on Research
and Development in Information Retrieval, SIGIR
’10, pages 841–842, New York, NY, USA. ACM.
Vens, C., Verstrynge, B., and Blockeel, H. (2013).
Semi-supervised Clustering with Example Clusters.
In 5th International Joint Conference on Knowledge
Discovery, Knowledge Engineering and Knowledge
Management, pages 45–51, Vilamoura, Algarve,
Portugal.
KDIR2014-InternationalConferenceonKnowledgeDiscoveryandInformationRetrieval
472
