
A Semi-automatic Mapping Selection in the Ontology Alignment Process
Hafedh Nefzi
1
, Mohamed Farah
1
, Imed Riadh Farah
1,2
and Basel Solaiman
2
1
RIADI Laboratory, University of Manouba, Manouba, Tunisia
2
ITI Laboratory, TELECOM-Bretagne, Brest, France
Keywords:
Ontology, Remote Sensing, Similarity Models and Measures, Alignment, Enrichment, UTA.
Abstract:
Ontologies are considered as one of the most powerful tools for knowledge representation and reasoning.
Thus, they are considered as a fundamental support for image annotation, indexing and retrieval. In order to
build a remote sensing satellite image ontology that models the geographic objects that we find in a scene,
their characteristics as well as their relationships, we propose to reuse existing geographic ontologies to enrich
an ontological core. Reusing high quality resources (called source ontologies) helps ensuring a good quality
for the extracted knowledge, and alleviating the conceptualization stage, i.e. avoiding building a new ontology
from scratch. Ontology alignment is an important phase within the enrichment process. It is a process that
allows discovering mappings between core and source ontologies, where each mapping is a couple of entities
brought from each ontology and linked together either by an equivalence or a subsumption relationship. Such
relationships are based on various similarity measures. In this paper, we first present a brief literature review
of existing theoretical frameworks for similarity measures, then we describe a new alignment approach based
on a semi-automatic mapping selection process that needs little human intervention. First experiments show
the benefit from using the proposed approach.
1 INTRODUCTION
Remote sensing plays a very important role in the ge-
ographic information acquisition and interpretation,
especially in order to study major facts affectingearth,
such as the urbanism expansion or the vegetation and
water resources evolution. They are also considered
as a fundamental support to detect and monitor nat-
ural phenomena such as erosion, flooding, deforesta-
tion, desertification, etc.
The continuous technological progress in remote
sensing has led to a phenomenal increase of multi-
resolution, multi-spectral and multi-temporal satellite
images. Thus experts are no more able to deal with
such big data. Researchers as well as practitioners
definitely agree that processing such big data can only
be dealt with (semi)automatically.
Nowadays, ontologies are considered as one of the
most powerfultools for knowledge representation and
reasoning. An ontology that models the geographic
objects, their characteristics and relationships can be
a good support for automatic annotation, indexing and
retrieval of satellite images content.
In the literature, geographic, spatial as well as
remote sensing satellite image ontologies belongs to
two main categories: thematic geographic ontologies
(agriculture, hydrology, planning, surveying, etc.)
and spatial ontologies modelling spatial concepts for
cartographic representation purposes (Parent et al.,
1998) and (Gesbert, 2005).
One of the most popular spatial ontologies is that
of Durand (Durand et al., 2007) which is constructed
to model and interpret urban vegetation in satellite
images. Each concept of this ontology is character-
ized by contextual attributes as well as a priori val-
ues of spatial and spectral attributes (spectral signa-
tures, indices, etc.). In (Hudelot et al., 2006), we find
a spatial ontology that models topological, distance
and directional relations between objects within a
scene. SatellitesSceneOntology developed within the
DAFOE platform (Charlet et al., 2010) is also a spa-
tial ontology that contains concepts coming mainly
from the Corine Land Cover database and related to
agricultural areas, land use, buildings, vegetation, wa-
ter areas, etc. In addition, it handles topological, dis-
tance and directional relations.
Concerning thematic geographic ontologies, we
mention the hydrographic ontology, named Hydrol-
459
Nefzi H., Farah M., Riadh Farah I. and Solaiman B..
A Semi-automatic Mapping Selection in the Ontology Alignment Process.
DOI: 10.5220/0005162204590466
In Proceedings of the International Conference on Knowledge Engineering and Ontology Development (KEOD-2014), pages 459-466
ISBN: 978-989-758-049-9
Copyright
c
2014 SCITEPRESS (Science and Technology Publications, Lda.)

ogy, which covers topographical features involved in
the retention and transport of inner and surface wa-
ter such as slopes, roads, coastlines, floodplains, hills,
artificial or natural bodies of water, etc. The Fusion-
TopoCarto2 ontology takes its concepts from BDTopo
and BDCarto databases.The concepts of this ontology
are divided into two main categories: artificial topo-
graphic concepts and natural geographic concepts. It
offers a wide number of concepts related to hydrogra-
phy, topography and agriculture. The OntoGeo ontol-
ogy covers concepts related to various geographical
objects that may exist in a satellite scene, as well as
events that may occur and change the status of these
objects.
Studying and analysing these geographic ontolo-
gies and many others let us to conclude that none of
these ontologies entirely covers satellite image fea-
tures, but at the same time they are somehow comple-
mentary. In (Nefzi et al., 2013), authors propose to
build a new remote sensing image ontology reusing
the available ontological resources such as the afore-
mentioned ones. This enrichment process has proven
to guarantee a high quality satellite image ontology
which encompasses the knowledge related to geo-
graphic objects, their relationships and their spatial,
spectral and contextual characteristics.
Reusing of existing ontological resources helps to
alleviate the conceptualization stage by avoiding in-
tensive text processing and datamining activities on
textual corpora for the extraction of relevantkeywords
and their grouping into concepts. In addition, it en-
sures a high quality of the extracted knowledge since
these ontological resources are usually constructed
and validated by domain experts.
Ontology alignment is an important phase within
the enrichment process. It is a process that allows
discovering mappings between core and source on-
tologies, where each mapping is a couple of enti-
ties brought from each ontology and linked together
either by an equivalence or a subsumption relation-
ship. Such relationships are based on various similar-
ity measures.
In this paper, we propose a new alignment ap-
proach based on a semi-automatic mapping selection
process that needs little human intervention. In fact,
given a reduced set of mappings having sufficiently
high similarity scores, the expert is asked to rank them
by decreasing order of relevance. We then infer an
utility-based aggregation model of the similarity mea-
sures which is as close as possible to the expert feed-
back. This model can therefore be used to rank all
the remaining mappings which do not appear in the
reduced set.
The rest of the paper is organized as follows: in
section 2, we present a brief literature review of ex-
isting theoretical frameworks for similarity measures.
Section 3 describes the semi-automatic mapping se-
lection approach that we propose for the alignment
of different ontologies for the enrichment of a remote
sensing core ontology. In Section 4 we present re-
sults of first experimentations. Finally, we conclude
in Section 5.
2 SIMILARITY MODELS
Similarity measures have a long tradition in many
fields such as information retrieval, artificial intelli-
gence, and cognitive science. They have also be-
come popular in semantic geospatial web (Egenhofer,
2002) and they are being applied to compare con-
cepts, to improve searching and browsing through on-
tologies, as well as for matching and aligning ontolo-
gies (Shvaiko and Euzenat, 2008).
Given two sets E
i
and E
j
, a similarity measure be-
tween two elements or objects e
i
and e
j
from E
i
and
E
j
respectively, is defined as a real valued function
Sim : (E
i
× E
j
) → [0,1] where 0 means that both ob-
jects are dissimilar and 1 tells that they are identical.
2.1 Geometric Models
In geometric models, objects are represented as vec-
tors in a multi-dimensional vector space, where each
dimension is a property or an attribute of the object.
The range of each dimension represents all possible
values of the property. In these models, the definition
of the similarity between two objects is obtained by
their internal contents. The similarity measure is seen
as inversely proportional to the spatial distance. The
most commonly used similarity measure is based on
the Minkowski dissimilarity metric :
Dissim
Minkowsky
(e
i
,e
j
) =
"
n
∑
k=1
| e
k
i
− e
k
j
|
r
#
1/r
where n is the number of dimensions, and r is a pa-
rameter used to indicate the distance kind, such as the
Manhattan distance (r = 1) or the euclidean distance
(r = 2) (Schlicker et al., 2006).
There are many other similarity measures in the
geometric model which are reported in the literature
such as the Jaccard distance, the cosine distance, the
Dice distance, or the Gardenfors distance (Garden-
fors, 2000; Schwering and Raubal, 2005).
According to (Tversky, 1977), the main limita-
tions of similarity measures from the geometric mod-
KEOD2014-InternationalConferenceonKnowledgeEngineeringandOntologyDevelopment
460

els are that they have difficulties in describing the ob-
jects that have a large number of features and that the
similarity is only based on common characteristics.
2.2 Feature Models
As the geometric model, feature model uses proper-
ties, also called features, to describe the objects to be
compared. The features correspond to properties, ei-
ther concrete or abstract which can represent nomi-
nal, ordinal, interval and ratio scaled variables. This
model is based on sets theory and takes into account
features that are common to both the objects to be
compared as well as the differentiating features which
are specific to each one. Thus this model differs from
the previous one as the properties are boolean rather
than fuzzy, i.e. features either hold or do not hold
for an object. For instance, the forest concept can be
represented by the shape, area, vegetation, occupa-
tion and relief features. The vegetation component
can have as values low vegetation, mediumvegetation
or high vegetation. Similarly, the occupation score
ranges from 0 to 100. Consequently, for an evergreen
forest concept having as values for both features veg-
etation and occupation high vegetation and 80 in the
geometric model, will have both features set to true in
the feature model.
There are many similarity measures of the feature
model, many of which are based on the Tversky mea-
sure:
Sim
Tversky
e
i
,e
j
= F
S
i
∩ S
j
,S
i
\ S
j
,S
j
\ S
i
where e
i
and e
j
are the objects to be compared, S
i
and S
j
their corresponding sets of features, and F is a
linear function. Depending of the definition of F, we
find different similarity measures such as the contrast
measure as described by the following formula:
Sim
C
e
i
,e
j
= θ· f (A∩ B)+ α· f (A\ B) + β· f (B\A)
where θ, α and β are positive constants and f captures
the saliency of a feature set. For instance, the Lesak
measure is a specific case of the contrast measure.
We have also the ratio measure which is given by:
Sim
R
e
i
,e
j
=
f (A∩ B)
f (A∩ B) + α· f (A\ B) + β · f (B\A)
The Jaccard measure can be seen as a specific case
of the ratio measure. Another feature model calcu-
lates similarity by taking the ratio of common to dis-
tinctive features (Sjoberg, 1972). Another well known
similarity measure of the feature model is the Ham-
ming distance (Hamming, 1950).
2.3 Network Models
Network models are based on graph theory where
knowledge is modelled using semantic networks
where nodes represent units of knowledge, such as
objects, concepts or properties, and edges connect
nodes according to specific relations such as syn-
onymy, antinomy, or subsumption. Most similar-
ity distances are computed using standard graph-
theoretic algorithms such as the shortest path. Net-
work models are divided into three categories.
The first category consists of graph-theoretic mea-
sures which are mainly based on computing the num-
ber of edges that separate two nodes in a taxon-
omy. The most commonly used measures in the lit-
erature are those of Rada, Wu & Palmer , Leacock &
Chodorow and Hirst & St-Onge.
The second category consists of information the-
oretic measures, called entropies. Each measure of
this category is based on the computation of the so
called Information Content IC of a concept e. For in-
stance, the Resnik measure computes the similarity
between two concepts e
i
and e
j
by computing the In-
formation Content of their Least Common Subsumer
LCS in the semantic graph (Resnik, 1995; Resnik,
1999). The Lin’s Measure is a normalized version
of Resnik measure by dividing IC(LCS(e
i
,e
j
)) by
IC(e
i
) + IC(e
j
) (Lin, 1998). We have many other
variationsof Lin’s measure such as the Schlicker mea-
sure (Schlicker et al., 2006) and the GraSM measure
(Couto and Coutinho, 2005).
The third category, also called hybrid approaches,
combine graph based and information theoretic mea-
sures. In this category, we find the Jiang and Con-
rath measure (Jiang, 1997) as well as the Leacock and
Chodorow measure (Leacock, 1998).
2.4 Alignment based Models
Measures of these models are well suited for com-
paring objects that are richly structured rather than
just being a collection of unstructured features. Thus,
comparing objects involves not only matching fea-
tures, but also determining which elements corre-
spond to, or align with, one another. Matching fea-
tures are aligned to the extent that they play simi-
lar roles within their objects.‘Matching features influ-
ence similarity more if they belong to parts that are
placed in correspondence, and parts tend to be placed
in correspondence if they have many features in com-
mon and if they are consistent with other emerg-
ing correspondences’ (Goldstone, 1994; Goldstone,
1999; Markman, 1993). Alignment based measures
are deeply inspired from work on analogical reason-
ASemi-automaticMappingSelectionintheOntologyAlignmentProcess
461

ing (Gentner, 1989; Holyoak and Thagard, 1989).
2.5 Transformational Models
In previous models, similarity measures are based on
features and/or relations describing the concepts to
be compared. In transformational models, a similar-
ity measure of two objects e
i
and e
j
is rather viewed
as the number of transformations required to alter
one concept into another (Imai, 1977; Wiener Ehrl-
ish et al., 1980).
Transformations can be viewed as terminological
operations needed to modify concepts, such as mir-
roring, reversing and adding, as well as geometric op-
erations such as rotating, reflecting, translating and
dilating. In (Goldstone, 2005; Hahn et al., 2009), the
similarity between two concepts corresponds to the
complexity of the algorithm that transforms the rep-
resentation of a specific concept to another.
One of the most well used similarity measures of
this model, we mention the Levenshtein distance also
called the Edit distance as well as the Jaro measure.
3 PROPOSED APPROACH
In this section, we give details on the alignment ap-
proach that we propose which is based on a semi-
automatic mapping selection process that needs little
human intervention.
Remember that we are focusing on a specific but
critical process to build remote sensing image ontol-
ogy by reusing a set of already existing remote sens-
ing domain related ontologies. We choose one of
them as a core or target ontology to be enriched with
the remaining ones that we call source ontologies.
Thus, the target ontology can be extended with new
concepts modelling different objects that may exist in
a satellite scene. Candidate ontologies, even though
they do not take into account the spatial and spectral
characteristics of objects in a standard remote sensing
image, they model with different levels of granular-
ity a variety of useful geographical objects covering
several areas such as topography, hydrography, urban
planning, etc.
The alignment process is based on selecting cou-
ples of concepts (also called mappings) (c
i
,c
j
) ∈ O
i
×
O
j
where O
i
is the core ontology and O
j
is a source
ontology. If c
i
and c
j
are sufficiently similar to each
other, they can be considered in a further process in
the enrichment process.
It is obvious that the quality of the resulting ontol-
ogy depends on the quality of the selected mappings.
Actually, there are two ways to evaluate the quality of
a mapping: either automatically or manually. Auto-
matic based approaches for the quality assessment of
a mapping use a real valued function f that is sup-
posed to capture the overall similarity between the
concepts c
i
and c
j
to be aligned, i.e. f(c
i
,c
j
) is an
aggregation of a set of similarity measures presented
in the previous section. The advantage of using au-
tomatic approaches is their scalability, i.e. their abil-
ity to handle large ontologies but they suffer from a
disadvantage which is how to aggregate the various
similarity measures.
Manual based approaches for the quality assess-
ment of a mapping need the intervention of an expert.
This way ensures the quality of the mapping since it
is human based but cannot be considered in real life
due to the size of the ontologies to be aligned.
We propose a semi-automatic mapping selection
approach which combines the preceding ones. More
specifically, we propose to select a reduced set of
mappings and ask an expert to build a ranking of them
in decreasing order of quality. Next, we automatically
build an aggregation procedure of a set a similarity
measures that tries to reproduce as much as possible
the ranking of the expert. The last step consists of us-
ing the aggregation procedure to automatically rank
all the remaining candidate mappings.
The proposed method finds its roots in the UTA
method (Jacquet-Lagr`eze and Siskos, 1982; Jacquet-
Lagr`eze et al., 1987) for ordinal regression and which
uses both the informationgivenby expertjudgements,
in a form of a ranking, on a reduced set of pairs of con-
cepts to be aligned, as well as the evaluation of sim-
ilarities between the involved concepts, to infer the
parameters of a ranking model that it is as consistent
as possible with the expert judgements.
Our method assumes that there exists a non-
decreasing marginal utility function u
i
corresponding
to each similarity measure sim
i
as well as an additive
utility function U (Keeney and Raiffa, 1976) that en-
compasses the ranking model.
More formally,let
e
R = {a
1
,a
2
,... ,a
n
} denotes the
top-n alignments having the best similarity scores ac-
cording to a family F = {sim
1
,sim
2
,... ,sim
p
} of p
similarity measures. F is supposed to satisfy consis-
tency conditions (Roy, 1991), i.e. completeness (all
relevant similarity measures are considered), mono-
tonicity (increasing the evaluation of an alignment on
some similarity measure leads to increasing its rele-
vance to be considered), and non-redundancy (no su-
perfluous similarity measures are considered). Let
sim(a
j
) = [sim
1
(a
j
),.. . ,sim
p
(a
j
)] be the multicriteria
evaluation vector of alignment a
j
. We assume, with-
out loss of generality, that the greater is sim
i
(a
j
), the
better is alignment a
j
on similarity measure sim
i
.
KEOD2014-InternationalConferenceonKnowledgeEngineeringandOntologyDevelopment
462

The ranking model U can therefore be written as
follows:
U(a
j
) =
p
∑
i=1
u
i
(sim
i
(a
j
))
Let sim
i∗
= min
j
{sim
i
(a
j
)}, sim
∗
i
= max
j
{sim
i
(a
j
)}
be respectively the worst and the best (finite) evalua-
tions on sim
i
. E
i
= [sim
i∗
,sim
∗
i
] is the scale of similar-
ity measure sim
i
, i.e. the range in which the values of
similarity measure sim
j
are found. Consequently, the
evaluation space is E =
∏
sim
i
∈F
E
i
and sim(a
j
) ∈ E is
a profile in such space E.
Expert judgements are supposed to be given in the
form of a ranking that can be modelled using 2 global
preference relations: an indifference relation I and a
strict preference relation P. Therefore, the following
generally holds for U:
a
j
P a
k
⇔ U(a
j
) > U(a
k
)
⇔
p
∑
i=1
u
i
(sim
i
(a
j
)) >
p
∑
i=1
u
i
(sim
i
(a
k
))
a
j
I a
k
⇔ U(a
j
) = U(a
k
)
⇔
p
∑
i=1
u
i
(sim
i
(a
j
)) =
p
∑
i=1
u
i
(sim
i
(a
k
))
The subjectiveranking is therefore a complete pre-
order S = (P,I) on a reduced subset
e
R ⊂ R of align-
ments with multicriteria evaluations on E. I and P are
respectively the symmetric and asymmetric parts of
this preorder that we call hereafter the reference pre-
order.
As in the UTA method, we consider that for each
similarity measure sim
i
, the corresponding marginal
utility function u
i
is estimated by a piecewise linear
function. Thus, the range E
i
is divided into α
i
≥ 1
equal sub-intervals [sim
k
i
,sim
k+1
i
],∀k = 1,..., (α
i
−1)
where α
i
is a parameter. If E
i
is discrete, α
i
can be set
to the numberof grades of the intervalE
i
or a subset of
these grades. Therefore, each end point sim
k
i
is given
by the following formula:
sim
k
i
= sim
i∗
+
k− 1
α
i
− 1
(sim
∗
i
− sim
i∗
)
Estimating the u
i
functions is equivalent to esti-
mating the variables u
i
(sim
k
i
) = u
k
i
. Therefore, the
marginal utility of an alignment a
j
w.r.t. similarity
measure sim
i
, is approximated by a linear interpo-
lation as shown in Figure 1. Thus, for sim
i
(a
j
) ∈
[sim
k
i
,sim
k+1
i
], we have:
u
i
(sim
i
(a
j
)) = u
k
i
+
sim
i
(a
j
) − sim
k
i
sim
k+1
i
− sim
k
i
(u
(k+1)
i
− u
k
i
)
To find the variables u
k
i
, we need to resolve the
following linear program LP:
sim
1
i
sim
2
i
sim
3
i
sim
4
i
sim
5
i
sim
k
i
u
1
i
u
2
i
u
3
i
u
k
i
(sim
i
(a
j
), u
i
(sim
i
(a
j
)))
Figure 1: Computation of the marginal utility of an align-
ment a
j
w.r.t. similarity measure sim
i
(In the above figure,
u
i
(sim
i
(a
j
)) = u
2
i
+
sim
i
(a
j
)−sim
2
i
sim
3
i
−sim
2
i
(u
3
i
− u
2
i
)).
Min Z =
∑
a
j
∈
e
R
σ(a
j
)
s.t
p
∑
i=1
(u
i
(sim
i
(a
j
)) − u
i
(sim
i
(a
k
))) + σ(a
j
)
−σ(a
k
) ≥ δ;∀(a
j
,a
k
) ∈
e
R
2
: a
j
Pa
k
p
∑
i=1
(u
i
(sim
i
(a
j
)) − u
i
(sim
i
(a
k
))) + σ(a
j
)
−σ(a
k
) = 0;∀(a
j
,a
k
) ∈
e
R
2
: a
j
Ia
k
u
(k+1)
i
− u
k
i
≥ s
i
;∀i = 1,..., p;k = 1,..., (α
i
− 1)
p
∑
i=1
u
i
(sim
∗
i
) = 1
u
i
(sim
i∗
) = 0;∀i = 1,. . . , p
u
k
i
≥ 0, ∀i = 1, ..., p;k = 1, ..., (α
i
− 1)
σ(a
j
) ≥ 0;∀a
j
∈
e
R
In the preceding linear program LP, the first two
family of constraints model the reference preorder S.
Using transformations of equation (3), they only in-
volve the principle variables u
k
i
. The third family of
constraints are set since u
i
are supposed to be non-
decreasing marginal utility functions. The 4th con-
straint as well as the 5th family of constraints are set
for normalization purposes: alignments scores will
range from 0 to 1. The last two family of constraints
specify that the principle variables u
k
i
as well as the
auxiliary variables σ(a
j
) are non-negative. More-
over, auxiliary variables σ(a
j
) model errors, δ is
an arbitrary small positive value parameter so as to
significantly discriminate two successive equivalence
classes of
e
R, and s
i
is an indifference threshold pa-
rameter defined on similarity measures sim
i
to model
imprecision.
The linear program LP can be resolved using the
Simplex algorithm. Besides, the structure of the pre-
ceding LP is such that it is more useful to solve the
dual in order to save time and memory.
ASemi-automaticMappingSelectionintheOntologyAlignmentProcess
463
If the optimal solution is Z
∗
= 0, then there exists
a least one utility function U compatible with the ref-
erence preorder S. When the optimal value Z
∗
> 0,
then there is no value function U compatible with the
reference preorder S. In such circumstances, we can
pursue one of the following strategies:
• increase the number α
i
of breakpoints sim
k
i
for
one or several marginal utility functions u
i
,
• ask the user to revise the reference preorder on
e
R,
or
• search over the relaxed domain Z ≤ Z
∗
+ ε an ad-
ditive value function U giving a preorder
b
S on
e
R
which is sufficiently close to the reference pre-
order S, in the sense of Kendall-tau distance or
Spearman-footrule distance. Branch and bound
methods could be used here.
The resulting solution of the preceding LP pro-
gram is therefore used to compute the similarity score
of all the remaining alignments of R using formula
of equations (3) and (3), and rank them accordingly.
This guaranties that the resulting ranking is coherent
with the expert judgements.
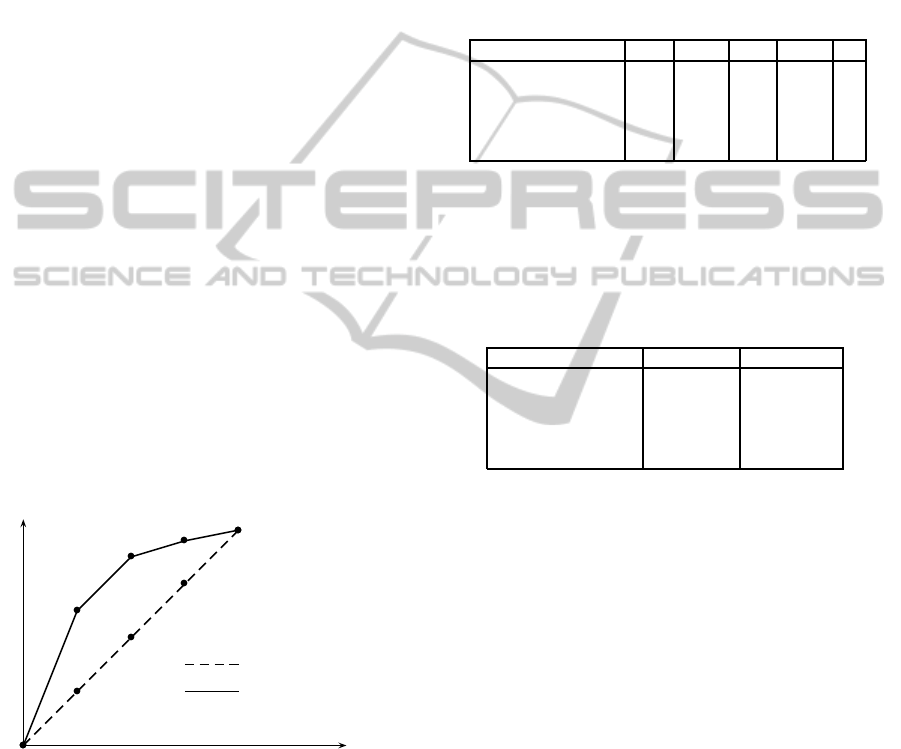
Our model differs from common linear combina-
tion methods w.r.t. the following features. First, our
model incorporates a semi-supervised learning phase
which allows expert intervention. Moreover, linear
combination methods consider that performances on
each similarity measure sim
i
increases linearly all
along the range E
i
, which is not necessary in our
model as shown in Figure 2.
sim
1
i
sim
2
i
sim
3
i
sim
4
i
sim
5
i
sim
k
i
u
k
i
Preferences in common linear
combination methods
Preferences in our approach
Figure 2: Encoding of performances.
4 EXPERIMENTATION
In this section, we report results of first experimenta-
tions that show that the proposed approach is promis-
ing.
First, we select the SatellitesSceneOntology on-
tology of DAFOE platform as a target ontology and
the FTT ontology as a source ontology. For the com-
parison of concepts, we apply 3 similarity measures:
Hamming, Maedche & Staab, and Wu & Palmer.
Table 1 summarizes some mappings as well as
their similarities with respect to Hamming (H), Maed-
che(M) and Wu & Palmer (WP) measures. Their
ranking (R) is established according the sum of the
values of the different similarity measures (global
score: GS).
Table 1: Similarity values and their rankings.
Mapping H M WP GS R
(sea, seas) 1 0.43 1 2.43 1
(forest, rain forests) 0.66 0.67 0.53 1.86 2
(Building, Mansions) 0.25 0.52 0.88 1.65 3
(construction, building) 0.21 0.095 0.93 1.235 4
(forest, vidaucts) 0.08 0.55 0.25 0.88 5
Asking experts to rank these mappings, we find
that they propose two different rankings (cf. Table
2) depending to the fact that we compare concepts
with respect to the equivalence relation (eq) or the
subsumption relation (sub).
Table 2: Rankings of the experts.
Mapping Ranking (eq) Ranking (sub)
(sea, seas) 1 3
(forest, rain forests) 2 1
(building, mansions) 4 2
(construction, building) 3 4
(forest, viaducts) 5 5
This table shows that in the equivalence context,
the ranking of mappings 3 and 4 is reversed which is
easy to explain since the mansion is a sub-concept of
building whereas building and construction are syn-
onyms, therefore more ‘similar’ in the equivalence
context.
The application of the UTA method are summa-
rized in tables 3.
As we can see, for each similarity measure, the
first column indicates the similarity value, the second
one indicates the utility score in the equivalence con-
text, and the third column indicates the utility score in
the subsumption context. Let remark that for the first
mapping (forest, forest), the overall utility score in the
equivalence context is remarkably higher than the one
found in the subsumption context, which means that
both concepts are more equivalent than subsumed.
Also for the mapping (forest, rain forests), the overall
utility score in the equivalence context is remarkably
lower than the one found in the subsumption context,
which means that both concepts are more subsumed
than equivalent.
The score of any mapping a in the equivalence
context is given by the following formula:
KEOD2014-InternationalConferenceonKnowledgeEngineeringandOntologyDevelopment
464
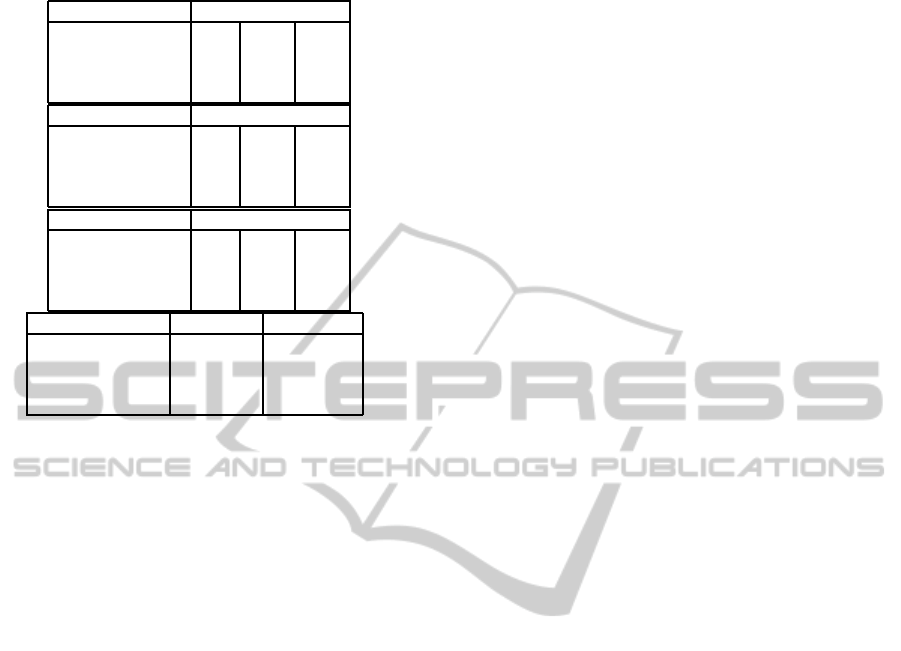
Table 3: Rankings of the experts.
Mapping Hamming
(sea, seas) 1 0.374 0.199
(forest, rain forests) 0.66 0.340 0.199
(Building, Mansions) 0.25 0.121 0.092
(forest, vidaucts) 0.08 0 0
Mapping Maedche
(sea, seas) 0.43 0 0
(forest, rain forests) 0.67 0.158 0.467
(Building, Mansions) 0.52 0 0.167
(forest, vidaucts) 0.55 0 0.167
Mapping Wu & Palmer
(sea, seas) 1 0.467 0.333
(forest, rain forests) 0.53 0.292 0.303
(Building, Mansions) 0.88 0.383 0.333
(forest, vidaucts) 0.25 0 0
Mapping Scoring (eq) Scoring (sub)
(sea, seas) 0.84 0.53
(forest, rain forests) 0.79 0.97
(Building, Mansions) 0.51 0.58
(forest, vidaucts) 0 0.16
U(a) = 0.374∗ u
1
(Sim
Hamming
)
+ 0.158∗ u
2
(Sim
Maedche
)
+ +0.46∗ u
3
(Sim
WUP
)
whereas its score in the subsumption context is
given by the following formula:
U(a) = 0.199∗ u
′
1
(Sim
Hamming
)
+ 0.467∗ u
′
2(Sim
Maedche
)
+ 0.333∗ u
′
3(Sim
WUP
)
These formula can be nowused to rank all the can-
didate mappings coming from SatellitesSceneOntol-
ogy and FTT ontologies.
5 CONCLUSION
In this paper, after presenting a literature review of
the main similarity models used to map or align on-
tology entities, we propose a semi-automatic mapping
selection process in order to build a satellite images
ontology by reusing geographical object ontologies.
The main advantage of our work is that it needs lit-
tle human intervention to monitor the mapping pro-
cess. First experimentations show that our approach
is promising.
REFERENCES
Charlet, j., Szulman, S., Aussenac-Gilles, N., Nazarenko,
Hernandez, N., Nadah, N., Sardet, E., Delahousse, J.,
Valry Tguiak, H., and Baneyx, A. (2010). Dafoe: une
plateforme pour construire des ontologies partir de
textes et de thesaurus. In 10ime Confrence Interna-
tionale Francophone sur l’Extractionet la Gestion des
Connaissances. EGC.
Couto, F. M.and Silva, M. J. and Coutinho, P. M. (2005).
Semantic similarity over the gene ontology: family
correlation and selecting disjunctive ancestors. In
ACM, editor, the 14th ACM International Conference
on Information and Knowledge Management, pages
343–344.
Durand, N., Derivaux, S., Forestier, G., Wemmert, C.,
Gancarski, P., Boussaid, O., and Puissant, A. (2007).
Ontology–based object recognition for remote sensing
image interpretation. In IEEE International Confer-
ence on Tools with Artificial Intelligence, pages 472–
479, Greece.
Egenhofer, M. (2002). Toward the semantic geospa-
tial web. In 10th ACM International Symposium
on Advances in Geographic Information Systems,
10.1145/585147.585148, pages 1–4. ACM.
Gardenfors, P. (2000). Conceptual Spaces: The Geome-
try of Thought. Massachusetts Institute of technology,
Cambridge, 2004 edition.
Gentner, D. (1989). Structure-mapping: A theoretical
framework for analogy. Cognitive Science, 7:155–
170.
Gesbert, N. (2005). Etude de la formalisation des spcifica-
tions de bases de donnes gographiques en vue de leur
intgration. PhD thesis, Universit de Marne la Valle et
IGN.
Goldstone, R. L. (1994). Similarity, interactive activation,
and mapping. Journal of Experimental Psychology:
Learning, Memory, and Cognition, 20:3–28.
Goldstone, R. L. (1999). Similarity. In The MIT encyclope-
dia of the cognitive sciences, pages 763–765.
Goldstone, R. L. (2005). Similarity. In Cambridge hand-
book of thinking and reasonning, pages 13–36.
Hahn, U., Close, J., and Graf, M. (2009). Transformation
direction influences shape similarity judgements. Psy-
chological science, pages 447–454.
Hamming, R. W. (1950). Error detecting and error correct-
ing codes. Bell System Technical Journal, pages 147–
160.
Holyoak, K. J. and Thagard, P. (1989). Analogical mapping
by constraint satisfaction. Cognitive Science, 13:295–
355.
Hudelot, C., Atif, J., and Bloch, I. (2006). Ontologie de re-
lations spatiales floues pour l’interprtation d’images.
In Rencontres francophones sur la Logique Floue et
ses Applications, Toulouse, France. LFA 2006.
Imai, S. (1977). Pattern similarity and cognitive transfor-
mations. Acta Psychologica, 41(6):433–447.
Jacquet-Lagr`eze, E., Meziani, R., and Slowinski, R. (1987).
Molp with an interactive assessment of a piecewise
utility function. Eur. J. Oper. Res, 31(3):350–357.
Jacquet-Lagr`eze, E. and Siskos, Y. (1982). Assessing a set
of additive utility functions for multicriteria decision
making: the UTA method. European Journal of Op-
erational Research, 10:151–164.
ASemi-automaticMappingSelectionintheOntologyAlignmentProcess
465

Jiang, J.and Conrath, D. (1997). Semantic similarity based
on corpus statistics and lexical taxonomy. In Interna-
tional Conference on Research in Computational Lin-
guistics, Taiwan.
Keeney, R. and Raiffa, H. (1976). Decisions with multiple
objectives: Preferences and value tradeoffs. J. Wiley,
New York.
Leacock, C.and Chodorow, M. (1998). Combining local
context and wordnet similarity for word sense identi-
fication. In MIT Press, pages 265–283.
Lin, D. (1998). An information–theoretic definition of simi-
larity. In Madison, M.-K., editor, the fifteenth Interna-
tional Conference on Machine Learning, pages 296–
304.
Markman, A. B., . G. D. (1993). Structural alignment dur-
ing similarity comparisons. Cognitive Psychology,
25:431–467.
Nefzi, H., Messaoudi, W., Farah, M., and Farah, I. R.
(2013). Vers une ontologie riche ddie l’imagerie
satellitaire par rutilisation de ressources existantes. In
TAIMA’2013, pages 35–46.
Parent, C., Spaccapietra, S., and Zimanyi, E. (1998). modle
conceptuel spatio–temporel. Revue internationale de
gomantique, (7):317–352.
Resnik, P. (1995). Using information content to evaluate
semantic similarity in taxonomy. In 14th International
Joint Conference on Artificial Intelligence, Montreal.
Resnik, P. (1999). Semantic similarity in a taxonomy: An
information based measure and its application to prob-
lems of ambiguity in natural language. Journal of Ar-
tificial Intelligence Research.
Roy, B. (1991). The outranking approach and the founda-
tions of ELECTRE methods. Theory and Decision,
31:49–73.
Schlicker, A., Domingues, F. S., Rahnenf, J., and Lengauer,
T. (2006). A new measure for functional similarity of
gene products based on gene ontology. BMC Bioin-
formatics, 7(302).
Schwering, A. and Raubal, M. (2005). Measuring seman-
tic similarity between geospatial conceptual regions.
In the First International Conference on GeoSpatial
Semantics, Mexico City,Mexico.
Shvaiko, P. and Euzenat, J. (2008). Ten challenges for ontol-
ogy matching. In in Computer Science, L. N., editor,
OTM’08: Proceedings of the OTM 2008 Confederated
International, volume 5332, pages 1164–1182. OTM,
Springer.
Sjoberg, L. (1972). A cognitive theory of similarity. Gote-
borg Psychological Reports, 2.
Tversky, A. (1977). Features of similarity. Psychological
Review, 84(4):327–352.
Wiener Ehrlish, W., Bart, W., and Millward, R. (1980). An
analysis of generative representation systems. mathe-
matical psychology, pages 219–246.
KEOD2014-InternationalConferenceonKnowledgeEngineeringandOntologyDevelopment
466
