
Preliminary Study to Detect Gait Initiation Intention Through a BCI
System
Daniel Planelles, Enrique Hortal, Eduardo I
´
anez,
´
Alvaro Costa, Andr
´
es
´
Ubeda and Jos
´
e M. Azor
´
ın
Biomedical Neuroengineering Group, Miguel Hern
´
andez University of Elche, Avda. Universidad, Elche (Alicante), Spain
Keywords:
Brain-Computer Interface, Movement Intention, Gait.
Abstract:
In this paper is presented an experiment designed to detect the will to perform several steps forward (as
walking onset) before it occurs using the electroencephalographic (EEG) signals collected from the scalp. The
preliminary results from five users have been presented. In order to improve the quality of the signals acquired
some different spatial filters are applied and compared. In the future, the improved Brain-Computer Interface
of this paper will be used as part of the control system of an exoskeleton attached to the lower limb of people
with incomplete and complete spinal cord injury to initiate their gait cycle.
1 INTRODUCTION
There is a range of longer-term problems that a person
who has suffered a stroke might continue to face after
they have left hospital. Patients with stroke normally
have communication, cognitive, emotional, physical
or visual problems so they need attendance or even
rehabilitation. However, there is other disabilities as
people with spinal cord injury or multiple sclerosis
that involve lost of voluntary mobility. Therefore, the
research community has to do a huge effort to find so-
lutions to restore their capacities or, at least, to facil-
itate new technology with the aim of improving their
lives.
For this reason, Brain-Computer Interfaces (BCIs)
have seen a rapid development during the last years as
an assistive technology. BCIs are an alternative com-
munication method for people with a severe motor
disability as they allow generating control commands
with the only help of the thoughts (Guido Dornhege
and Muller, 2007; Nicolelis, 2001). Therefore, BCIs
could increase their independence and also could im-
prove their quality of life.
Current technology allows collecting and process-
ing EEG signals that occur just before performing an
action and thus we can know the intention to perform
a movement (Bai et al., 2011). It can be used to assist
subject movements whenever he/she wishes which is
one of the great practical advantages of this approach.
In a motor rehabilitation process, it can make a big
improvement since it would be possible to share ef-
forts between the subject and, for example, an ex-
oskeleton attached to the lower limb (Moreno et al.,
2011). This coordination between the will to exe-
cute a movement and the performance of the action
itself increases the likelihood of the brain to create
new communication channels due to neuronal plas-
ticity (Kolb et al., 2011). Through this, the effects
of rehabilitation increase a greater extent in a much
shorter time frame.
This paper has been developed under the BioMot
project - Smart Wearable Robots with Bioinspired
Sensory-Motor Skills (FP7-ICT-2013-10) funded by
the Commission of the European Union, which pre-
tends to control an exoskeleton attached to the lower
limb of the disabled user capturing and processing
their electroencephalographic (EEG) signals. As part
of this challenge, our purpose is to activate the con-
trolled gait cycle of the exoskeleton using the inten-
tion to walk of the user. Therefore, the EEG signals
will be analysed in order to detect the intention of the
gait onset and this will be turn into an activation com-
mand of the exoskeletons engines or a stimulus over
the leg muscles with Functional Electrical Stimula-
tion (FES). At the moment, the focus is on the system
to detect the intention to start walking and initially,
only healthy subjects have performed the test.
For our knowledge, there are two phenomena ex-
tensively used in BCI related to the motor inten-
tion. On the one hand, a kind of Movement-Related
Cortical Potential (MRCP) which is a slow poten-
tial called Bereitschaftspotential or readiness poten-
tial (Shibasaki and Hallett, 2006) but this paper will
not take into consideration this phenomenon. On
61
Planelles D., Hortal E., Iánez E., Costa Á., Úbeda A. and M. Azorín J..
Preliminary Study to Detect Gait Initiation Intention Through a BCI System.
DOI: 10.5220/0005167800610066
In Proceedings of the 2nd International Congress on Neurotechnology, Electronics and Informatics (NEUROTECHNIX-2014), pages 61-66
ISBN: 978-989-758-056-7
Copyright
c
2014 SCITEPRESS (Science and Technology Publications, Lda.)
the other hand, the event-related desynchronization
(ERD) characterized by a decrease in the spectral
power of EEG signals in mu and beta frequency bands
(Pfurtscheller and da Silva, 1999). This phenomenon
starts up to 2 seconds before the movement onset and
it ends more or less when the movement is finished.
After that, the spectral power recovers its magnitude
generating the event-related synchronization (ERS).
2 MATERIALS AND METHODS
2.1 Test Description
Five healthy subjects between 22 and 29 years old
(26.50±3.15) performed one session. All voluntaries
had normal vision and hearing and no history of neu-
rological or psychiatric disorders. Each subject was
instructed to remain at rest on their two legs during
at least 5 seconds to have enough information to be
used as resting time (or baseline) and then to perform
several steps forward. However, the user could begin
the movement whenever they want after the restricted
period (limited to 10 seconds). No interface guides
the subject but they know when a task starts through
an advice from the experimenter.
8 runs with 10 repetitions each have been per-
formed. Between each run there is one or two min-
utes of break time and between repetitions there is a
few seconds. The user has to wear several measure-
ment equipments to register the EEG signals and the
kinematic of the user. Then, a cap with EEG elec-
trodes, a backpack with the electronic devices that
registers the EEG signals and 7 Inertial Measurement
Units (IMUs) distributed over the lower limb are used.
These devices are connected to a laptop which is over
a cart managed by the experimenter. Therefore, the
experimenter pulls the cart while the user is moving
forward to keep around 1.5 meters between the user
and the cart. In Fig. 1 it is possible to see an example
of test.
2.2 Experimental Set Up
The system architecture is composed by a Brain-
Computer Interface (BCI) that will capture and pro-
cess EEG signals to command, in the future, an ex-
oskeleton attached to the lower limb and seven Iner-
tial Measurement Units (IMUs) managed by the Mo-
tion Capture System (Technaid S.L.), which are dis-
tributed over the lower body to register kinematics.
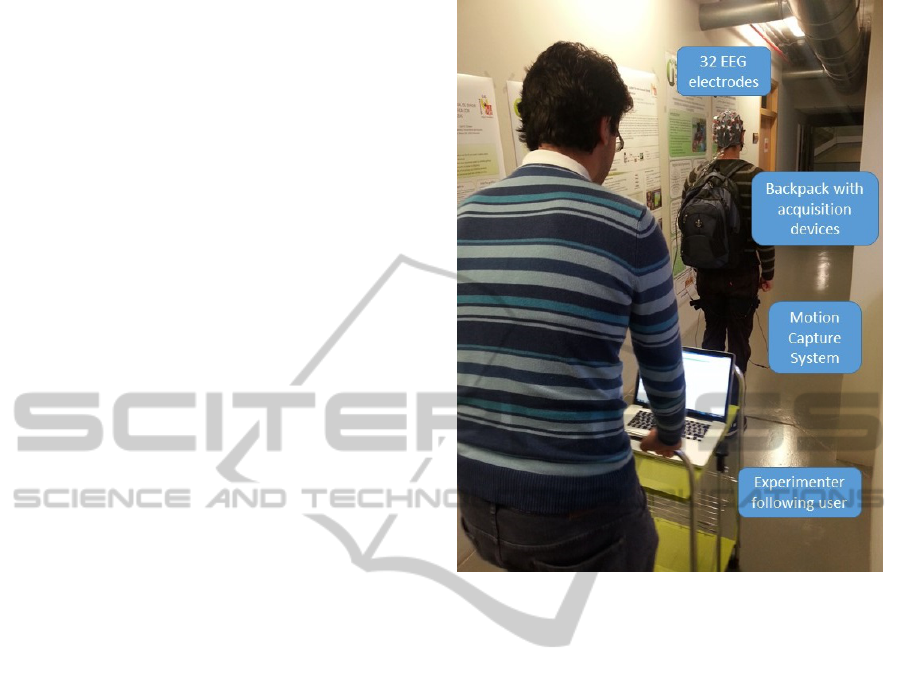
Both acquisition systems are synchronized.
Figure 1: The user is wearing the cap, the backpack and the
Motion Capture System while the experimenter follows him
with the cart and the computer.
2.2.1 Brain-Computer Interface
The EEG signals are registered through 32 active
electrodes. These electrodes are placed using a cap
(g.GAMMAcap, g.tec medical engineering, GmbH,
Austria). This cap is very useful as it allows an easy
placement of the electrodes. The 32 electrodes are
placed following a uniform distribution over the scalp.
According to the International 10-10 System, the po-
sition of the electrodes is the following: FZ, FC5,
FC3, FC1, FCZ, FC2, FC4, FC6, C5, C3, C1, CZ,
C2, C4, C6, CP5, CP3, CP1, CPZ, CP2, CP4, CP6,
P3, P1, PZ, P2, P4, PO7, PO3, POZ, PO4 and PO8.
This distribution of the electrodes is shown in Fig. 2.
These electrodes are the g.LADYbird model, sintered
Ag/AgCl crown with a 2-pin safety connector. These
electrodes need a conductive gel that comes in contact
the scalp with the sensor. The ground sensor is located
in AFz and the reference is placed on the earlobe. The
signals of the 32 electrodes are acquired through two
commercial g.USBamp devices from g.tec synchro-
nized by using g.INTERsync device and they have
two preamplifiers g.GAMMAbox. Each amplifier has
16 channels and the sampling frequency used to reg-
ister the signals is 1200 Hz.
NEUROTECHNIX2014-InternationalCongressonNeurotechnology,ElectronicsandInformatics
62
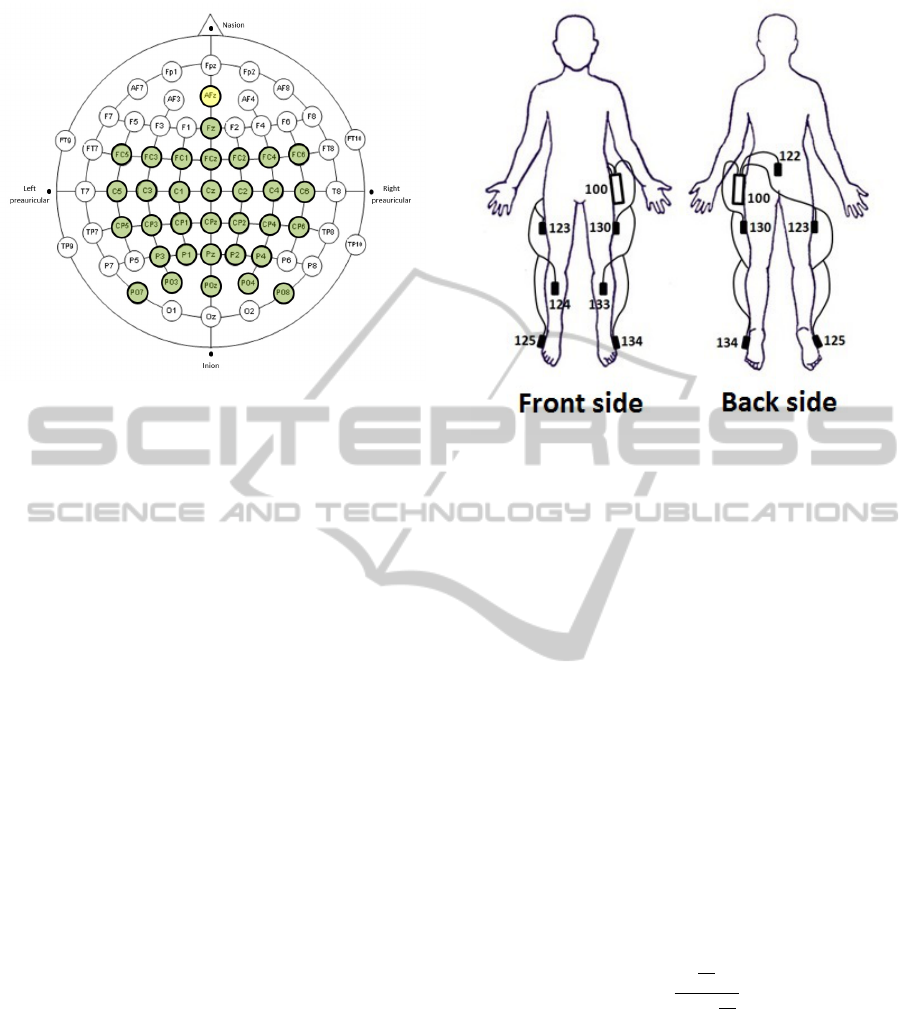
Figure 2: Placement of the 32 electrodes over frontal and
parietal lobes.
2.2.2 Motion Capture System
The motion capture system Tech MCS is a com-
plete wireless motion analysis system. It manages
the seven IMUs of the company Technaid which are
used in our experiments and they are placed as Fig. 3
shows. The sampling frequency used is 30 Hz. Each
Tech IMU integrates three different types of sensors
as an accelerometer, a gyroscope and a magnetometer.
A sophisticated and robust algorithm, calibrated also
taking into account changes in temperature, results in
a very precise and robust estimation of 3D orientation,
even during changing environmental conditions.
2.3 Signal Processing
The EEG signals voltage is around a few microvolts,
consequently the signals are easily affected by other
sources of voltage that are not the cerebral activity as
ocular or muscular movements. Therefore, it is nec-
essary to reduce the undesirable contribution of each
electrode using some temporal and frequency filters.
In this sense, the EEG data is filtered with two fre-
quency filters that eliminate the power line interfer-
ence, the DC component and some artifacts. Then, a
50 Hz Notch filter and a 4th order Butterworth from
1 to 100 Hz filter are used. Thus, the information of
mu and beta (8-30 Hz) and surrounding frequencies
are isolated. Moreover, due to the proximity of the
EEG electrodes and the numerous neural connections,
the signal acquired per each electrode is partially af-
fected by the potential produced in other location of
the scalp. Hence, in this paper two different spatial
filters are used to reduce that neighbour contribution.
On the one hand, a Common Average Reference
Figure 3: IMUs distribution. 100: Tech HUB; 122: Lum-
bar; 123: Right quadriceps; 124: Right biceps; 125: Right
foot; 130: Left quadriceps; 133: Left biceps; 134: Left foot.
(CAR) is used (Alhaddad, 2012). This spatial filter
consists of subtract the 32 EEG channels mean data
to each channel. Therefore, it is expected that the in-
formation processed per electrode comes from itself,
reducing the contribution of the remaining electrodes.
On the other hand, a Laplacian (LAP) algorithm
is applied for all electrodes (McFarland et al., 1997).
This algorithm uses the information received from
all the remaining electrodes and their distances from
them. The visual result is a smoother time signal
which should contain only the contribution coming
from the particular position of the electrode. The
Laplacian is computed according to the formula:
Vi
LAP
= Vi
CR
−
∑
jεSi
g
i j
V j
CR
(1)
where Vi
LAP
is the result of applying this algorithm
to the electrode i, Vi
CR
is the electrode i signal before
the transformation and,
g
i j
=
1
d
i j
∑
jεSi
1
d
i j
(2)
where Si contains all the electrodes except from the
electrode i and d
i j
is the distance between i and j elec-
trodes.
In order to compare, a third option without any
spatial filter (NOF) is used.
2.4 Features Extraction and Classifier
The EEG data are cut from 5 seconds before each
movement onset sample to 1 second after it. Only
PreliminaryStudytoDetectGaitInitiationIntentionThroughaBCISystem
63
these data will be analysed to distinguish between
premovement and resting time. Then, the first three
seconds will be used as resting data and the last three
seconds as premovement data. To know the starting
sample, the data acquired from the IMUs are used. An
automatic searching method based on the first change
in the curve obtained from IMUs is implemented. The
number of IMU is higher than needed in this experi-
ment because other lines of research in BioMot take
under consideration kinematics.
Later, the selected EEG data per each task is fed
into a 7th order autoregressive process that returns a
vector with the estimated coefficients a of a linear re-
gression model per a EEG channel. This vector is
calculated as follows:
x(n) = 1 +
6
∑
i=1
a
i
x(n −i) (3)
where x is the EEG data and a is the vector of
estimated coefficients.
Therefore, these coefficients are used to train a
Support Vector Machine (SVM) classifier. SVM is an
approach where the objective is to find the best sepa-
ration hyperplane, which provides the highest margin
distance between the nearest points of the two classes
to separate them.
3 RESULTS
The system is tested using an 8-fold cross validation
with each run as a fold. This statistic analysis per-
forms all combinations of 7 runs to train the SVM
classifier and uses the other one to test it. In each iter-
ation, the number of correct and incorrect detections
are added and, at the end, the following three statisti-
cal index are calculated:
T PR =
Premovement data correctly detected
Number of premovement data
∗ 100
(4)
FPR =
Resting data incorrectly detected
Number of resting data
∗ 100 (5)
ACC =
Tasks correctly detected
Number of tasks performed
∗ 100 (6)
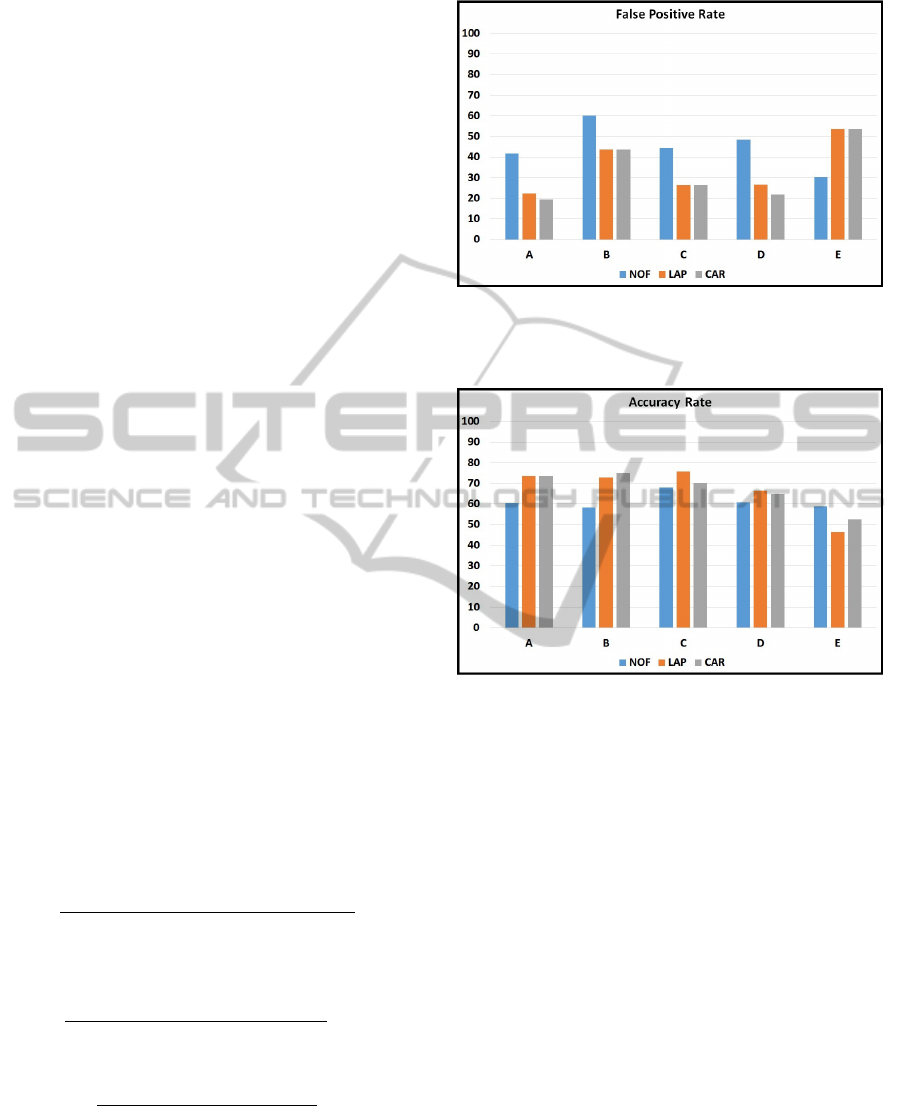
The results obtained per each user with the two
spatial filters and no one are summarized in Table
1. In view of the results, it is possible to say that
when a spatial filter is used the FPR and the ACC are
Figure 4: False Positive Rate (FPR) in all users with the
different filters: no filter (NOF), laplacian filter (LAP) and
common average reference filter (CAR).
Figure 5: Accuracy Rate (ACC) in all users with the differ-
ent filters: no filter (NOF), laplacian filter (LAP) and com-
mon average reference filter (CAR).
improved (around 11% and 6% respectively), except
user E who is an abnormal case as it is shown in fig-
ures 4 and 5. However, there is not significant differ-
ences in TPR average. Leaving out user E and NOF,
TPR is better using LAP filter but FPR is lower us-
ing CAR and at the end, the accuracy of the system
is similar with both filters. Therefore, the difference
between LAP and CAR filter is not significant but at
least, according to ACC, it is better than NOF. In aver-
age, TPR and FPR are around 68% and 34% (respec-
tively) using any filter. However, there is huge differ-
ences between users and for example, user B reaches
93.75% of TPR while user D only achieves 51.56%
with the same spatial filter. Then, the system has to
be improved in both index with more complex signal
processing to achieve better features and a more sta-
ble system.
NEUROTECHNIX2014-InternationalCongressonNeurotechnology,ElectronicsandInformatics
64

Table 1: Results of the 8-fold cross validation.
TRUE FALSE ACCURACY
POSITIVE RATE POSITIVE RATE RATE
USER NOF LAP CAR NOF LAP CAR NOF LAP CAR
A 62.50 69.44 66.67 41.67 22.22 19.44 60.42 73.61 73.61
B 77.08 89.58 93.75 60.08 43.75 43.75 58.33 72.92 75.00
C 80.56 77.78 66.67 44.44 26.39 26.39 68.06 75.69 70.14
D 70.31 59.38 51.56 48.44 26.56 21.88 60.94 66.41 64.84
E 48.21 46.43 58.93 30.36 53.57 53.57 58.93 46.43 52.68
MEAN 67.73 68.52 67.52 45.00 34.50 33.01 61.34 67.01 67.25
4 CONCLUSIONS AND FUTURE
WORKS
In this paper a system to detect the intention to start
walking has been presented. According to the results
obtained from five healthy users, the system has to
be improved to achieve better TPR and FPR. If the
system is able to predict each movement with a re-
ally low FP rate, the classifier output could serve as a
command to activate the engines of an exoskeleton or
a FES system to start walking. Therefore, in a rehabil-
itation process an exoskeleton could be used to sup-
port the lower limbs while the user carries out men-
tally walking intentions. The relationship between the
cognitive process to perform such movement and the
real movement could improve the rehabilitation due
to cerebral plasticity.
Therefore, other methods to characterize the EEG
signals before the movement onset will be studied.
For example, it is possible to calculate the power
spectral and to extract the best component of each
user to be used as feature. Moreover, a frequency fil-
ter narrower could be applied in order to isolate the
mu and beta frequency bands which are involved in
ERD phenomenon. Furthermore, ERD can be used
purely as theory indicates (a relative decrement of
power spectral in a special frequency band measured
in percentage). Usually, EEG signals have some arti-
facts like eye blinks or muscle activity that should be
removed. In particular, eye movements could be re-
moved from EEG signals recording the electroculag-
raphy (EOG) signals using 2 bipolar electrodes (hor-
izontal and vertical channels) and then reducing their
contribution through a linear regression which re-
lates EEG and EOG signals (Kenemans et al., 1991).
Moreover, artifacts due to neck movements can be
easily seen in EEG signals due to their magnitude, so
it is possible to add a voltage threshold to avoid it.
The population of this experiment and also the
number of sessions will be increased. Furthermore,
patients with complete and incomplete spinal cord in-
jury will perform the experiment in order to test the
system and to evaluate the performance. It is ex-
pected that some patients keep their brain procedures
related to the intention of movement as healthy people
although they could be weaker or allocated in other
brain area (Wei et al., 2011). Then, a real-time test
with a better system will be performed both healthy
as patient users.
ACKNOWLEDGEMENTS
This research has been funded by the Commission of
the European Union under the BioMot project - Smart
Wearable Robots with Bioinspired Sensory-Motor
Skills (Grant Agreement number IFP7-ICT- 2013-10-
611695), by the Spanish Ministry of Economy and
Competitiveness as part of the Brain2motion project
- Development of a Multimodal Brain-Neural Inter-
face to Control an Exoskeletal: Neuroprosthesis Hy-
brid Robotic System for the Upper Limb (DPI2011-
27022-C02-01), and by Conselleria d’Educaci
´
o, Cul-
tura i Esport of Generalitat Valenciana of Spain
through grant VALi+d ACIF/2012/135.
REFERENCES
Alhaddad, M. J. (2012). Common Average Reference
(CAR) Improves P300 Speller. International Journal
of Engineering and Technology, 2.
Bai, O., Rathi, V., Lin, P., Huang, D., Battapady, H., Fei,
D.-Y., Schneider, L., Houdayer, E., Chen, X., and
Hallett, M. (2011). Prediction of human voluntary
movement before it occurs. Clinical Neurophysiology,
122(2):364 – 372.
Guido Dornhege, Jos
´
e del R. Mill
´
an, T. H. D. J. M. and
Muller, K.-R. (2007). Towards Brain-Computer Inter-
facing. The MIT Press.
Kenemans, J. L., Molenaar, P. C., Verbaten, M. N., and
Slangen, J. L. (1991). Removal of the ocular artifact
PreliminaryStudytoDetectGaitInitiationIntentionThroughaBCISystem
65

from the eeg: A comparison of time and frequency
domain methods with simulated and real data. Psy-
chophysiology, 28:114–121.
Kolb, B., Muhammad, A., and Gibb, R. (2011). Searching
for factors underlying cerebral plasticity in the normal
and injured brain. Journal of Communication Disor-
ders, 44:503–514.
McFarland, D. J., McCane, L. M., David, S. V., and Wol-
paw, J. R. (1997). Spatial filter selection for EEG-
based communication. Electroencephalography and
Clinical Neurophysiology, 103:386–394.
Moreno, J. C., Ama, A. J., Reyes-Guzmn, A., Gil-Agudo,
n., Ceres, R., and Pons, J. L. (2011). Neurorobotic
and hybrid management of lower limb motor disor-
ders: a review. Medical and Biological Engineering
and Computing, 49(10):1119–1130.
Nicolelis, M. A. L. (2001). Actions from thoughts. Nature,
(409):403407.
Pfurtscheller, G. and da Silva, F. H. L. (1999). Event-
related EEG/MEG synchronization and desynchro-
nization: basic principles. Clinical Neurophysiology,
110:1842–1857.
Shibasaki, H. and Hallett, M. (2006). What is the
Bereitschaftspotential? Clinical Neurophysiology,
117:2341–2356.
Wei, L., Yue, H., Jiang, X., and He, J. (2011). Brain ac-
tivity during walking in patient with spinal cord in-
jury. International Symposium on Bioelectronics and
Bioinformatics, pages 96–99.
NEUROTECHNIX2014-InternationalCongressonNeurotechnology,ElectronicsandInformatics
66
