
Agricultural Drought Monitoring Using Satellite-
Based Products in Romania
Gheorghe Stancalie
1
, Argentina Nertan
1
, and Florin Serban
2
1
National Meteorological Administration, 97 Sos. Bucuresti-Ploiesti, Bucharest, Romania
2
Advanced Studies and Research Center, 4, Verii street, Bucharest, Romania
{gheorghe.stancalie, argentina.nertan}@meteoromania.ro, florin.serban@asrc.ro
Keywords: agricultural drought, satellite, vegetation indices.
Abstract: In Romania, the complex agricultural drought is a climatic hazard inducing the worst consequences ever
occurred in agriculture. The paper presents the results of recent studies developed in the National
Meteorological Administration, in the framework of national and European R&D projects, regarding the use
of satellite-derived products for agricultural drought monitoring. In this respect, different vegetation indices,
biophysical parameters and physically-based vegetation state indicators have been used and tested in study
areas over Romania, in order to monitor and assess the drought impact on crops, at different phenological
dates. The main sources of satellite data and related products were provided by TERRA/AQUA-Modis,
SPOT-Vegetation and Landsat TM/ETM+. By examining spatial and temporal patterns of satellite-derived
products and comparing/correlating with the field conditions measured on site, it was determined that the
NDVI, NDWI and NDDI vegetation indices, the leaf area index (LAI) and the fraction of absorbed
photosynthetical active radiation (fAPAR) proved to be good indicators of the vegetation condition and
relevant for the settlement, duration and intensity of the agricultural drought.
1 INTRODUCTION
Among the problems Europe is facing at the
beginning of the third millennium, the reduction of
water resources, their degrading quality and the
occurrence of ever more severe and frequent
droughts are of crucial importance.
In Romania, the complex agricultural drought is
a climatic hazard phenomenon inducing the worst
consequences ever occurred in agriculture.
The most frequent, the agricultural areas in
Romania are affected by drought (7 mil. ha), water
erosion and landslides (6.4 mil. ha), temporary water
excess (4 mil. ha.) and compaction (2.8 mil. ha).
Drought is the limiting factor affecting the widest
surface as regards the crops. The area subjected to
desertification, characterized by an arid, semi-arid or
dry sub humid climate is around 30% of the total
surface of Romania, being mostly situated in the
South-Eastern (Dobrogea), Eastern (Moldavia),
Southern parts of the Romanian Plain and in the
Western Plain. These areas are prevailingly used for
agriculture (around 80% of the total, 60% of which
is arable land) (Romanian Ministry of Agriculture and
Rural Development, 2008).
In the extremely droughty years the drought
phenomenon may engulf the whole Romania's
territory, as it happened more recently in 2000,
2003 and 2007. Large precipitation deficits were
recorded in 1907, 1924, 1928, 1934, 1945, 1946,
1948, 1953, 1982 and 1983, then in 1992 and 1993
and more recently in 2000, 2001, 2003, 2007, 2009
and 2011.
In Romania, the use of remote sensing data
in agriculture is a quickly developing and
promising trend. For a better operative surveillance
of the agricultural areas, starting with 2005, the
Romanian National Meteorological Administration
has implemented a dedicated service based on
satellite-derived products. The satellite
geoinformation products, elaborated by the Remote
Sensing and GIS Lab, are included and analysed in
the weekly Agrometeorological Bulletin issued by
the Agrometeorological Laboratory.
100
Stancalie G., Nertan A. and Serban F.
Agricultural Drought Monitoring Using Satellite - Based Products in Romania.
DOI: 10.5220/0005421901000106
In Proceedings of the Third International Conference on Telecommunications and Remote Sensing (ICTRS 2014), pages 100-106
ISBN: 978-989-758-033-8
Copyright
c
2014 by SCITEPRESS – Science and Technology Publications, Lda. All rights reserved

2 SATELLITE DATA USED
The main sources of satellite data which have been
used are TERRA/AQUA-Modis, SPOT-Vegetation
and Landsat TM/ETM+. Due to cloudiness, most of
the satellite products are averaged in time, producing
composites based on data from periods of 8-16 days.
The MODIS instrument is one a key instruments
onboard the US satellites of the EOS series (Terra
and Aqua). The bands most applicable for rangeland
studies are bands 1-7 that gather data in the visible
and infrared range at a 250 m and 500 m spatial
resolution.
The SPOT VEGETATION S10 product (ten
days synthesis) with 1 km- resolution is composed
by merging atmospherically corrected segments
(data strips) acquired over a ten days interval. All
the segments of this period (decade) are compared
again pixel by pixel to pick out the 'best' ground
reflectance values.
PROBA-V is a new ESA satellite mission,
launched in May 2013, with the main task of
mapping land cover and vegetation growth across
the Earth every two days. This mission is extending
the data set of the long-established SPOT
Vegetation, but with an improved 350m spatial
resolution.
The LANDSAT TM/ETM+ imagery is a unique
resource for global change research and applications
in agriculture. The main ETM+ image features are: a
panchromatic band with a 15 m-spatial resolution
(band 8); visible (reflected light) bands in the
spectrum of blue, green, red, near-infrared (NIR),
and mid-infrared (MIR) with a 30 m-spatial
resolution (bands 1-5, 7); a thermal infrared channel
with a 60 m-spatial resolution (band 6).
3 AGRICULTURAL DROUGHT
MONITORING USING
SATELLITE-BASED RODUCTS
3.1 The vegetation indices
The vegetation indices (VIs) are among the most
commonly used satellite data products for the
evaluation, monitoring, and measurement of
vegetation cover, condition, biophysical processes,
and change. They have been used for over last
decades in a broad variety of applications, including
monitoring the effects of drought over regional,
national, and even multinational areas (Basso et al.,
2004). The VIs are an important tool for drought
monitoring and evaluation because of the accurate
discrimination of vegetation and correlations with
biophysical parameters which determine the
vegetation state.
The most important VIs for vegetation
monitoring include the "broadband greenness"
category (e.g.: Normalized Difference Vegetation
Index - NDVI, Soil Adjusted Vegetative Index -
SAVI, Enhanced Vegetation Index - EVI, etc) and
the "canopy water content" category (e.g.:
Normalized Difference Water Index - NDWI,
Normalized Difference Drought Index – NDDI, etc)
(Gu et al., 2007; Huete, 1997; Penuelas, 1995).
3.1.1 The Normalized Difference Vegetation
Index (NDVI)
The NDVI is one of the most well known and most
frequently used vegetation indices, being considered
as a measure of the amount and vigour of vegetation.
The combination of its normalized difference
formulation and use of the highest absorption and
reflectance regions of chlorophyll make it robust
over a wide range of conditions (GU et Al., 2007;
Peters et al., 2002). The value of NDVI ranges from -
1 to 1. The common range for green vegetation is
0.2 to 0.8.
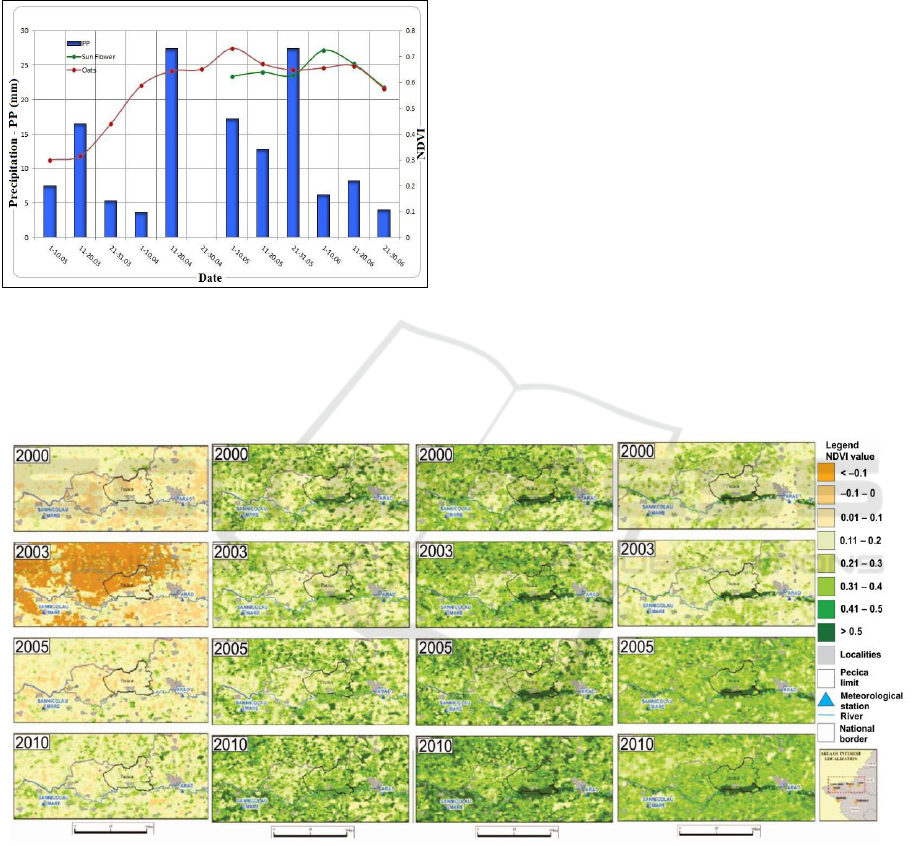
The NDVI values have been used in correlations
with various meteorological parameters. For
example, figure 1 shows a good correlation between
the SPOT Vegetation 10 days synthesis NDVI
values and the precipitation, over the study area
situated in the lower basin of the Mures River,
located in the Western part of Romania (Pecica
agricultural area). In this agricultural area the sun
flower and oats crops were identified on the Landsat
ETM+ satellite image (and validated by GPS ground
measurements); the precipitation values were
recorded at Arad weather station, the closest to the
study area. The analysis covers periods from March
to June 2011.
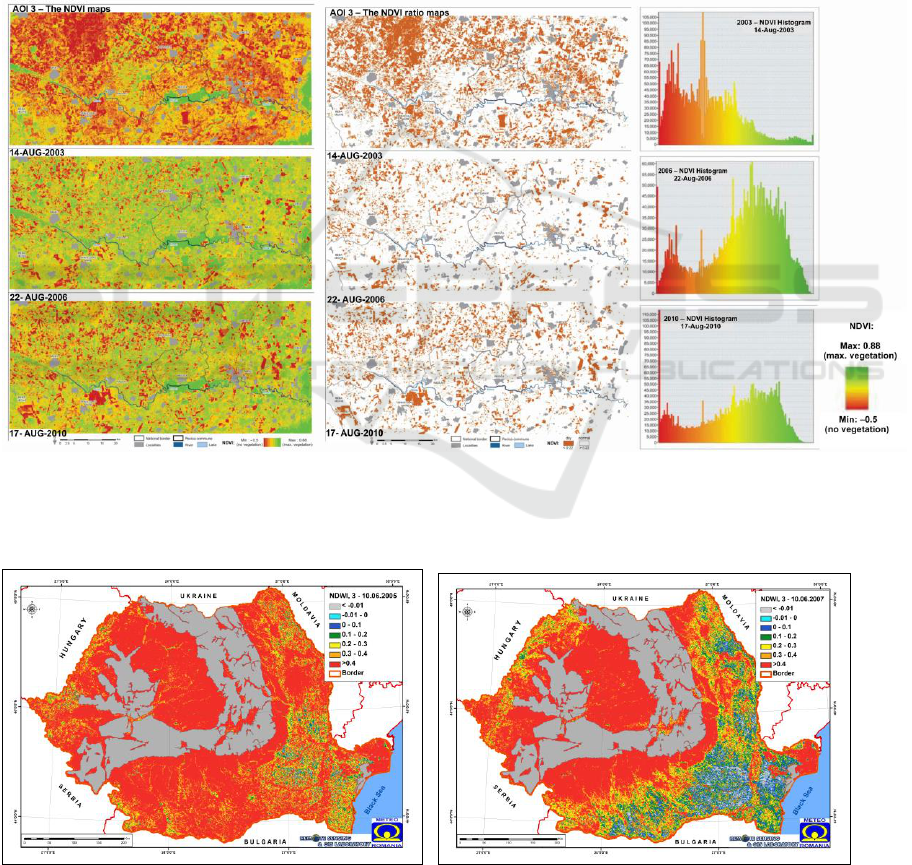
Figure 2 reveals that in the period 6.03 -
6.04.2003, the NDVI values were lower, compared
to the rest, mainly because of the lack of
precipitation in March which have caused a delay of
the vegetation season start. The NDVI time series
analysis is very important for the crop state
monitoring. Such a complex analysis was made
using MODIS/TERRA NDVI products (MOD13A1)
for the following years: 2000 and 2003 (as drought
years), 2005 (as normal year) and 2010 (as rainy
year) and for different vegetation phases. The year
2010, on the other hand, presents greater NDVI
values due to high amount of precipitation. The
Agricultural Drought Monitoring Using Satellite - Based Products in Romania
101
NDVI maps show a rather equal set of values
between the four years, with a slight grow in 2005
and 2010 compared to 2000 and 2003 for the
periods: from the 7
th
of April to the 8
th
of May and
from the 9
th
of May to the 9
th
of June.
Figure 1: The correlation between NDVI (extracted from
SPOT Vegetation) and precipitation (recorded at Arad
weather station) for the sun flower and oats crops, in the
study area situated in the lower basin of the Mures River,
in the Western part of Romania.
Only during the last vegetation phenological
phase a visible difference occurs between 2000 and
2003 on one hand, and between 2005 and 2010 on
the other hand. The analysis clearly shows the effect
of low precipitation and high temperatures in 2000
and 2003 (very droughty years) over the agricultural
areas.
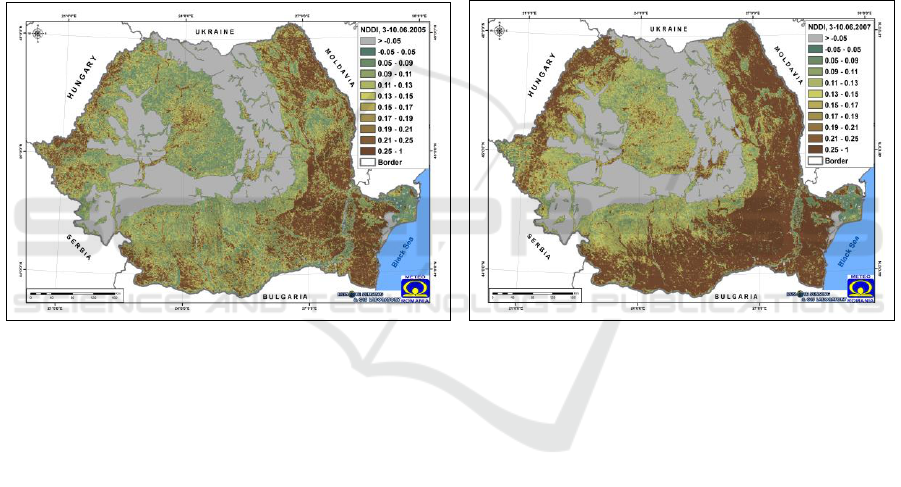
The NDVI-based analysis for crop state
monitoring was also performed using high-
resolution satellite images, such as LANDSAT
TM/ETM+ data (Jackson, 2007). Figure 3 presents an
example of using LANDSAT TM/ETM+ data for
14.08.2003, 22.08.2006 and 17.08.2010, in the same
study area, located in the Western part of Romania.
The figure 3a shows a “hot-spot” area, associated
with very low NDVI values (pixels in orange and
red), in the central-eastern part of the image acquired
on 14.08.2003 (up left image) and normal NDVI
values in the other 2 images acquired on 22.08.2006
and on 17.08.2010, respectively. In order to isolate
only the parts affected by drought a “low-
vegetation” NDVI threshold was applied to highlight
only two classes (figure 3b).
a) b) c) d)
Figure 2: Spatial variation of average NDVI values: )a – in the period 6.03 - 6.04; b) – in the period 7.04 - 8.05; c) – in the
period 9.05 - 9.06; d) – in the period 10.06 - 28.08.
The threshold value able to separate the dry and
normal conditions was set up using the NDVI
histograms (figure 3c). For this study, an NDVI
value of 0.22 was used as “drought threshold“.
These two classes representation excludes the
“normal” NDVI values while keeping the low ones.
Areas represented in brown in figure 5b can be
therefore associated with dry areas.
Third International Conference on Telecommunications and Remote Sensing
102
3.1.2 The Normalized Difference Water
Index (NDWI)
The NDWI is a satellite-derived index from the
Near-Infrared (NIR) and Short Wave Infrared
(SWIR) reflectance channels (Gao, 1996). The
SWIR reflectance reflects changes in both the
vegetation water content and the spongy mesophyll
structure in vegetation canopies, while the NIR
reflectance is affected by leaf internal structure and
leaf dry matter content but not by water content.
NDWI holds considerable potential for drought
monitoring because the two spectral bands used for
its calculation are responsive to changes in the water
content (SWIR band). This index increases with
vegetation water content or from dry soil to free
water (Chen et al., 2005; Gu et al., 2007). The NDWI
value ranges from –1 to 1. The common range for
green vegetation is –0.1 to 0.4.
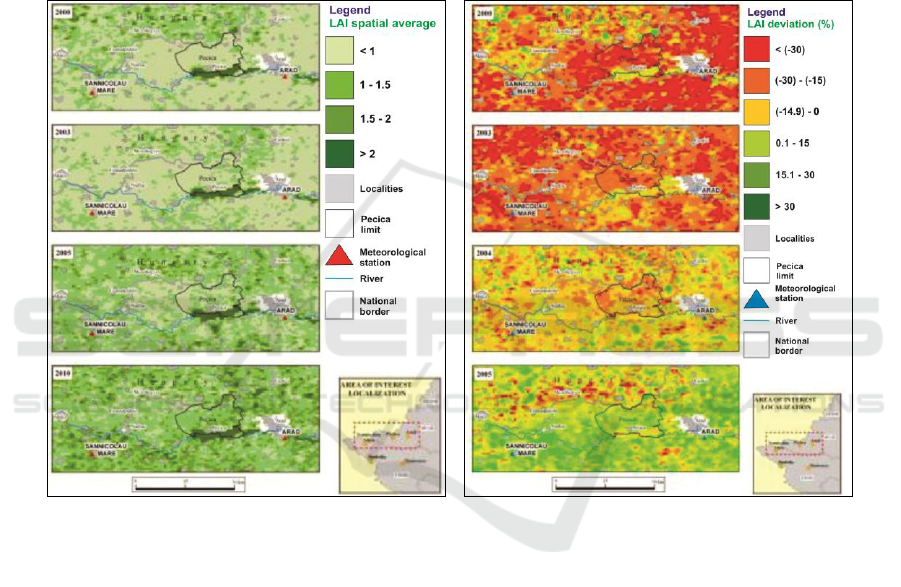
Figure 4 presents an example for NDWI maps
over Romania, obtained from MOD09A1 products
(8-day composite) for 2005 – rainy year (figure 4.a)
and for 2007 – droughty year (figure 4.b).
...a) b) c)
Figure 3: a) – The NDVI maps extracted from LANDSAT data; b) – The two classes NDVI maps obtained by applying a
“low-vegetation” NDVI threshold; c) – NDVI histograms.
a) b)
Figure 4: NDWI maps over Romania, obtained from MOD09A1 products (8-day composite): for 03-10.06.2005 (a) and
03-10.06.2007 (b).
Agricultural Drought Monitoring Using Satellite - Based Products in Romania
103
The figure clearly emphasized the large areas
affected by drought in 2007, in the Eastern, South-
eastern and Western agricultural regions of
Romania.
3.1.3 The Normalized Difference Drought
Index (NDDI)
The NDDI is a satellite-derived index defined by the
equation:
NDDI = (NDVI – NDWI) / (NDVI + NDWI)
(1)
The NDDI can offer an appropriate measure of the
dryness of a particular area, because it combines
information on both vegetation and water. The
NDDI has a stronger response to summer drought
conditions than a simple difference between NDVI
and NDWI, and is therefore, a more sensitive
indicator of drought. In case of common range of
values for vegetation moniotoring the NDDI values
vary between 0.33 to 3, a higher range indicating
more severe drought. This index can be an optimal
complement to in-situ based indicators or for other
indicators based on remote sensing data (Gu et al.,
2007).
The figure 5 shows the NDDI over Romania,
obtained from MODIS MOD09A1 products (8-day
composite) for 2005 (rainy year) and 2007 (droughty
year). The figure also highlights the areas affected
by drought in 2007, especially the Eastern, South-
eastern and Southern agricultural regions of
Romania.
a) b)
Figure 5: NDDI maps over Romania, obtained from MOD09A1 products (8-day composite): for 03-10.06.2005 (a) and 03-
10.06.2007 (b).
3.2 The biophysical parameters and
physically-based vegetation state
indicators
3.2.1 The Leaf Area Index (LAI)
The LAI, defined, as half the total leaf area per unit
ground surface area, is a key biophysical canopy
indicator, which play a major role in vegetation
physiological processes and ecosystem functioning.
Assessment of crop LAI and its spatial distribution
are of importance for crop growth monitoring,
vegetation stress, crop forecasting, yield predictions,
management practices, and climate simulations.
Along with the fAPAR, the LAI is a biophysical
variable describing canopy structure and are closely
related to the rate of energy consumed in the
functional processes and exchange mass. Drought
monitoring, corresponding to the state and dynamics
of vegetation, in a given time may be accounting for
LAI values derived from satellite data.
The algorithm for generating the MODIS LAI
products uses surface reflectance (MOD09) and land
cover (MOD12) products. The MODIS LAI
algorithm is based on the analysis of multispectral
and multidirectional surface reflectance signatures of
vegetation elements. The figures 6 (a, b) show the
spatial evolution of average LAI values, as well as
the deviation from the multi-annual average (2000 –
2009) for the years 2000, 2003 (dry years) and
2005, 2010 ( rainy ones), in the study area located in
the Western part of Romania.
4 CONCLUSIONS
Remote sensing techniques could enhance and
improve the crop vegetation state monitoring and the
drought analysis, especially considering the limited
Third International Conference on Telecommunications and Remote Sensing
104
availability of ground measured agrometeorological
data. The use of remote sensing data in
agrometeorology is a quickly developing and
promising trend.
The main sources of satellite data for crop
vegetation state studies and monitoring are the
TERRA/AQUA – MODIS, LANDSAT-TM/ETM+
and SPOT-Vegetation archives. The satellite-derived
vegetation indices data and biophysical parameters
prouved to be good indicators of vegetation
condition and relevant for the installation, duration
and intensity of the agricultural drought.
The MODIS imagery still represents one of the
most important type of satellite data available free of
charge and can be successfully used in determining
the vegetation status at one point or to predict the
changes that may appear in plants activity.
By examining the spatial and temporal patterns
of vegetation indices and comparing/correlating with
the field conditions measured on site, it was
determined that NDVI, NDWI and NDDI, are more
suitable for agricultural drought characteristics
monitoring.
a) b)
Figure 6: a - Spatial variation of average LAI values (from the 6th of March to the 28th of August); b - The LAI deviation
from the multi-annual average (2000 – 2009) (from 6 March to 28 August).
ACKNOWLEDGEMENTS
The presented work was done in the frame of
STAR 2012 (Space Technology and Advanced
Research Program), project DROMOSIS (Drought
monitoring based on space and in-situ data).
REFERENCES
Basso, B., Cammarano1, D., and De Vita, P., 2004.
Remotely sensed vegetation indices: theory and
applications for crop management, Rivista Italiana
di Agrometeorologia , 36-53 (1).
Chen, D., J. Huang, and Jackson, T. J., 2005. Vegetation
water content estimation for corn and soybeans using
spectral indices derived from MODIS near- and
short-wave infrared bands, Remote Sens. Environ.,
98, 225– 236.
Gao, B., 1996. NDWI—A normalized difference water
index for remote sensing of vegetation liquid water
from space, Remote Sens. Environ., vol., 58, 257–
266.
Gu, Y., J. F. Brown, J. P. Verdin, and Wardlow, B.,
2007. A five-year analysis of MODIS NDVI and
NDWI for grassland drought assessment over the
central Great Plains of the United States, Geophys.
Res. Lett., 34, L06407.
Huete, A.R., H. Liu, K. Batchily, and van Leeuwen, W.,
1997. A Comparison of Vegetation Indices Over a
Global Set of TM Images for EOS-MODIS. Remote
Sensing of Environment 59(3):440-451.
Jackson, J. T., D. Chen, M. Cosh, F. Li, M. Anderson, C.
Walthall, P. Doriaswamy, and Hunt, E. R., 2004.
Vegetation water content mapping using Landsat
data derived normalized difference water index for
Agricultural Drought Monitoring Using Satellite - Based Products in Romania
105

corn and soybeans, Remote Sens. Environ., 92, 475–
482 (2004).
Penuelas, J., I. Filella, C. Biel, L. Serrano, and Save, R.,
1995. Reflectance at the 950-970 Region as an
Indicator of Plant Water Status. Intern. Journal of
Remote Sensing 14:1887-1905.
Peters, A. J., E. A. Walter-Shea, J. Lei, A. Vina, M.
Hayes, and Svoboda M. R., 2002. Drought
monitoring with NDVI-based standardized
vegetation index, Photogramm. Eng. Remote Sens.,
68, 71–75.
Third International Conference on Telecommunications and Remote Sensing
106
