
On Advanced Business Simulations
Converging Operational and Strategic Levels
Marc Drobek
1,2
, Wasif Gilani
1
, David Redlich
1
, Thomas Molka
1
and Danielle Soban
2
1
SAP UK Ltd., Belfast, U.K.
2
Department of Mechanical and Aerospace Engineering, Queens University Belfast, U.K.
{marc.drobek, wasif.gilani, david.redlich, thomas.molka}@sap.com, d.soban@qub.ac.uk
Keywords:
KPI predictions, Business Dynamics, Business Process Simulation, Process Performance Parameters,
Business Simulations, Semantic Knowledge, Ontologies.
Abstract:
Business Dynamics (BD) enables strategic Key Performance Indicator (KPI) predictions to monitor the health
status of companies and support the decision making process. Nevertheless, a very important factor, which
is generally overlooked, is that the top level strategic KPIs are highly influenced by the operational level
business processes. These two domains are, however, mostly segregated and examined as silos with different
solutions. In this paper, we are proposing a framework for advanced business simulations, which converges
the two domains by utilising Ontologies and process execution data. Establishing this connection enables
drilling down from a high level KPI perspective into the underlying operational level details to discover hidden
bottlenecks and pre-emptively apply corrective actions.
1 INTRODUCTION
Managing global companies is an extremely challeng-
ing task, which needs a lot of expertise and experi-
ence. These companies are highly complex ecosys-
tems, with millions of customers and thousands of
employees organised in various departments in dif-
ferent geographical locations. Like every other com-
plex ecosystem, these need to be managed carefully
and with huge responsibility to keep them flourish
and stimulate growth. KPI monitoring and predic-
tion solutions, based on multiple concepts (for exam-
ple, database reporting tools, time series analyses or
Business Dynamics (BD) (Sterman, 2000)), are gen-
erally employed to keep a check on the company’s
performance, foresee future development and make
critical decisions. Examples of conventional strate-
gic KPIs, which are generally monitored, are revenue,
profit, number of orders, employee turnover rate, cus-
tomer satisfaction, etc. These KPIs mainly relate to
business objects, (e.g. Sales Order, Customer, Em-
ployee, etc.) and in most cases are computed based
on the actual data contained in the business objects
(e.g. sales orders in case of sales revenue). A very
important factor, which is generally overlooked, is
that these strategic KPIs are highly influenced by the
operational level business processes, which are the
foundation pillars of any company, and are orches-
trated to offer the services or products that the com-
pany deals with. An efficient execution of these pro-
cesses is therefore vital for company’s success. Huge
amount of event data (process logs), is generated dur-
ing process execution, which has only recently re-
ceived attention by the business world and research
community. The performance indicators computed
from execution data, called Process Performance In-
dicators (PPIs), are used to evaluate the performance
of business processes (Ann et al., 2011; Del-Rio-
Ortega et al., 2010). Such PPIs are, for instance,
process queue length, throughput, resource utilisa-
tion, instance occurrence, etc. This process execu-
tion data, therefore, holds the key to uncover prob-
lems and bottlenecks at the business process execu-
tion level. Significant research work has been carried
out in the area of PPI extractions, for instance, in the
context of Process Performance Mining and Business
Process Performance Management (Redlich and Gi-
lani, 2011; Fritzsche et al., 2009; Heilig and M
¨
oller,
2014).
However, so far KPIs and PPIs have mostly been
dealt with and consumed in isolation at different lev-
els (strategic and operational). For example, if one
looks into the widely adopted commercial solutions
in the Business Intelligence domain, such as Business
Objects, Aris WebMethods, Oracle BAM, SAP Pro-
cess Observer, they all deal exclusively either with
166
Drobek M., Gilani W., Redlich D., Molka T. and Soban D.
On Advanced Business SimulationsConverging Operational and Strategic Levels.
DOI: 10.5220/0005425601660171
In Proceedings of the Fourth International Symposium on Business Modeling and Software Design (BMSD 2014), pages 166-171
ISBN: 978-989-758-032-1
Copyright
c
2014 by SCITEPRESS – Science and Technology Publications, Lda. All rights reserved

PPIs or KPIs (Howson and Newbould, 2012; Heck-
ing and Schroder, 2013). The authors have not come
across any work that connects the PPIs and KPIs, ex-
cept a commercial solution by Software AG that of-
fers a manual mapping approach to connect these two
levels (SoftwareAG, 2014). But clearly, there is a con-
nection between the two levels, as inefficient execu-
tion of BPs eventually leads to KPI deviations, which
might cause financial collapse of the company. Sim-
ple examples highlighting this deep connection be-
tween PPIs and KPIs are:
• An inefficient execution of Sales Opportunity
Management process in a sales office leads to de-
creased revenue.
• A delayed Consignment Fill-up process leads to
lost sales.
• An imperfect execution of the Idea to Market
(I2M) process leads to companies failing to in-
troduce novel competitive solutions, thus loosing
market share (e.g. Kodak and Blackberry).
In this paper, we propose a systematic framework
for BD simulations which utilises semantic knowl-
edge sources, simulations and PPI analyses, to ex-
plore and enhance KPI predictions. This paper is
therefore split into the following sections: Section 2
describes the available operational data and the two
approaches that are generally used for PPI predic-
tions. Section 3 gives an explanation of KPI pre-
dictions with BD simulations and highlights the need
of semantic knowledge to generate such predictions.
Section 4 introduces our advanced business simula-
tion framework and design decisions that have been
made, to incorporate PPI predictions in BD models
with the goal of enhanced KPI predictions. We fur-
ther outline the need for additional semantic knowl-
edge sources, necessary to describe the dependencies
between KPI-KPI and KPI-PPI to create KPI predic-
tions. Finally, in Section 5, we conclude the paper
and list further research challenges, which need to be
tackled in future work.
2 BUSINESS PROCESS
ANALYSES
Software systems supporting the execution and man-
agement of operational BPs are called Business Pro-
cess Management Systems or Business Process Man-
agement Suites (BPMSs) (Ko et al., 2009). Exam-
ples of BPMSs are SAP Netweaver BPM (Woods
and Word, 2004) or Intalio BPMS Designer (Intalio,
2013). When BPs are executed they produce events
each representing a transition in the system’s state.
Enterprise
System
BPMS 1
Event Processing
Performance
Discovery
BPMS 3
BPMS 2
Events
PPIs
Historical
Predicted
BP
Simulation
BP
Scenario
BP State
Extraction
BP
State
PPI Prediction
Analytical
Prediction
Events
Figure 1: Information flow for PPI Extraction and Pre-
diction: (1) Analytical Prediction (horizontally striped);
(2) Prediction via Simulation (vertically striped).
These events are usually of a simple nature and often
only comprise raw information, like process instance
id, timestamp, and type of the state transition but not
the state of the whole system (Van Der Aalst, 2011).
One example of such an event is:
2013-05-26 T 13:45 CET: Activity "Check
availability" completed, pi-id: 253
The performance of the BPs is measured with PPIs,
e.g. activity net working time - the elapsed time of an
execution of a single activity, or activity throughput
- number of executions of a single activity per time
period, or process instance occurrence - how often
the process has been initiated. The historical PPIs are
computed by capturing, selecting, aggregating, and
eventually abstracting raw events from process logs
to generate high-level performance information about
the system (Performance Discovery).
The prediction of PPIs is generally carried out
with two different approaches: The first approach is
to utilise existing data-centric Business Intelligence
tools to predict each PPI individually based on its
history, i.e. Analytical Prediction. These numeri-
On Advanced Business Simulations - Converging Operational and Strategic Levels
167
cal and/or statistical methods do, however, not take
the workflow information that is readily available
in many BPMSs into account (Redlich and Gilani,
2011). The second approach, which includes work-
flow information to create more meaningful predic-
tion results, is Prediction via Simulation. In this
second approach, in addition to the extracted his-
torical performance data, BP Scenario information
about control workflow, involved roles and resources
are utilised in a discrete event simulation (Robinson,
1964). The beneficial effect of using simulation over
analytical methods for predicting PPIs is discussed
in (Redlich and Gilani, 2011) and (Porzucek et al.,
2010). Figure 1 shows the general concept for ex-
tracting Historical (and current) PPI data plus the two
approaches of how to compute the Predicted PPI data
via Analytical Prediction (horizontally striped) and
Prediction via Simulation (vertically striped).
3 BUSINESS DYNAMICS
Predicting KPIs in enterprises is a commonly used
method to support the decision making process to line
up the future business strategy. These predictions are
usually carried out with time series analyses of his-
torical KPI data (Brockwell and Davis, 2006). How-
ever, in large businesses, KPIs appear to be high-
dimensional, non-linear, are part of feedback loops
and not isolated. Especially the fact, that KPIs are
no silos, thus are being influenced by a variety of
other KPIs and variables, raises the level of mathe-
matical expertise needed to perform time series ana-
lyses. In such cases, when the system under study is
highly non-linear and contains feedback, Forrester’s
System Dynamics concept is in general well suited
(Forrester, 1961). Sterman already showed the appli-
cability of Business Dynamics (BD) in the business
domain (Sterman, 2000). Since BD is essentially a
specialised SD concept, it adopts the same traditional
SD steps to support the modeller in understanding the
business and creating predictions. SD itself is, how-
ever, already a well established concept and various
steps involved in SD have been debated for decades
(Burns, 1977; Ford, 1999; Binder et al., 2004). We
have summarised these traditional steps in the life-
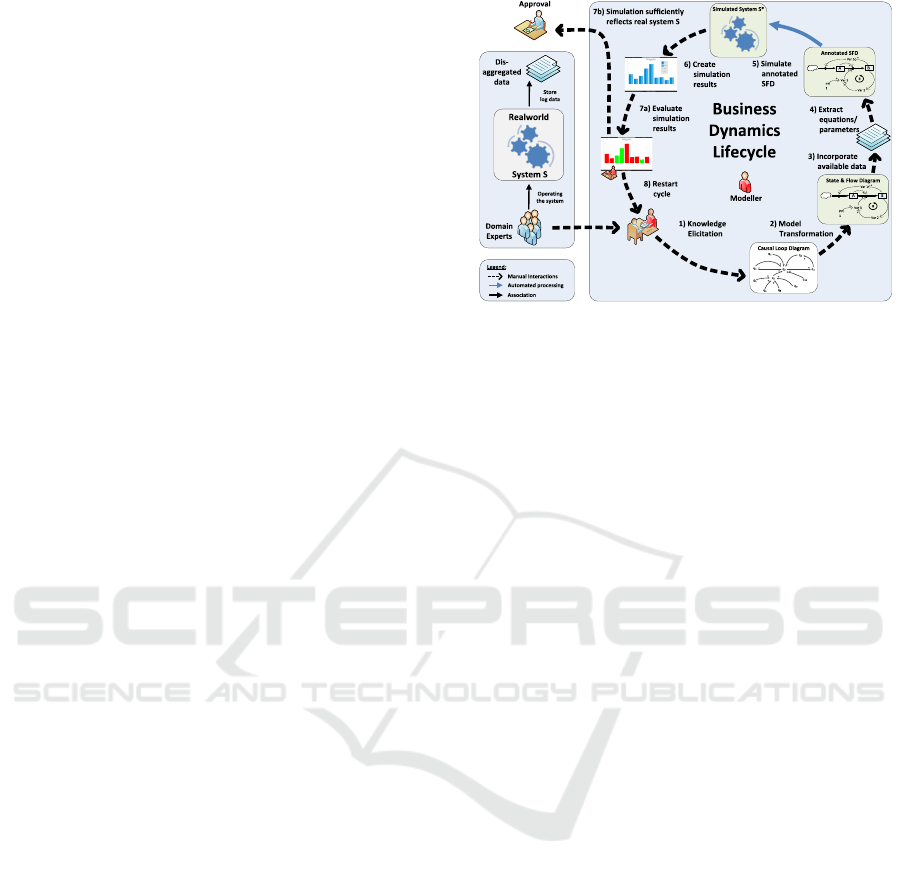
cycle figure 2, using Burns and other sources.
The process usually starts with eliciting knowl-
edge from the business domain experts (company em-
ployees, BP owners, managers, directors and so on)
and formalise it into Causal Loop Diagrams. CLDs
capture the most important business variables (rev-
enue, sales, orders, customer satisfaction) and their
inter-connections (Burns, 1977). The next phase is
Figure 2: The traditional BD life cycle.
the transformation of CLDs into State/Flow Diagrams
(SFDs), which capture the resources/material flow-
ing through the business (Forrester, 1961). In the
next step, the SFDs are annotated with parameters
and equations, which embodies a variety of different
limitations (Drobek et al., 2013), and then fed into
the simulation engine (e.g. Vensim, Stella (Richmond
and isee systems (Firm), 2008)) to finally carry out
simulations. Once first simulation results have been
produced, the modeller has to evaluate, whether the
output matches the real-world behaviour. Further it-
erations are executed to improve simulation results.
The BD modelling process is, however, not triv-
ial, since it is mostly based on the modellers under-
standing and knowledge of the target business. For
instance, the modeller is expected to:
• semantically link together the KPIs and their in-
fluencing variables in the CLD (e.g., profit is in-
fluenced by monthly expenses)
• detect and model feedback loops
• determine the resources/material flowing through
the system to create SFDs (e.g., money, cus-
tomers, satisfaction)
To find these connections, the modeller usually relies
on the business domain experts (Forrester, 1991).
Mostly, this knowledge is a mental model and needs
to be manually extracted by the modeller, which
gives room for misinterpretation and failure (Ford
and Sterman, 1998). Additionally, the modeller
has access to the historical business data (KPIs,
documentation, reports), which she uses to extract
the dependencies and relations of the target KPI. But
even with this knowledge, modelling CLDs and SFDs
is still a very challenging task, since the identification
of the important variables, which influence the target
KPI and main feedback loops, requires a lot of
experience, expertise and imagination.
Fourth International Symposium on Business Modeling and Software Design
168

Enterprise
System
Event
Processing
Performance
Discovery
Events
PPIs
Historical
Predicted
BP
Scenario
BP State
Extraction
BP State
Events
BD Lifecycle
Semantic
Knowledge
Model
KPIs
Predicted
CLD
creation
SFD
creation
Enhanced
CLD
SFD
Business
Process
Level
Strategic
Level
Business
Data
Historical
BP Simulation
BD Simulation (SFD)
Simulation Engine
External
Variable
BPMS 1
BPMS 3
BPMS 2
Figure 3: Framework for linking strategic KPIs with operational PPIs.
4 AN ADVANCED BUSINESS
SIMULATION FRAMEWORK
As stated earlier in the introductory section, and high-
lighted with examples, the strategic KPIs are highly
influenced by the execution of BPs at the operational
level. However, the strategic level decision makers
(head of sales, board members, etc.) lack the process
level visibility to make informed decisions. Establish-
ing a link between the PPIs and KPIs will enable this
process visibility. Our proposed framework solution,
in addition to the strategic KPIs, also incorporates the
predicted PPIs in the BD life cycle, thus establish-
ing a link between the operational and strategic level.
With these links, our framework enables identifying
and addressing issues and bottlenecks pro-actively at
the operational level before they start impacting the
strategic KPIs. Figure 3 shows a schematic descrip-
tion of our advanced business simulation framework.
The two main approaches to compute PPI predictions
are described in Section 2. Our framework employs
the second approach, Prediction via Simulation, be-
cause it preserves the control flow information of the
targeted BPs and thereby helps to exploit the bene-
fits of behavioural simulations (Porzucek et al., 2010).
Additionally, the KPI prediction process via BD sim-
ulation is orchestrated following the BD life cycle
provided in Section 3 (shown in figure 2). The con-
nection between the operational and strategic level is
established by including the PPIs in the CLD creation
process. This is done by applying causal indicators,
such as correlations and Granger causality (Granger,
1969), among the KPIs and PPIs and further extract-
ing their semantic dependencies from available en-
terprise ontologies, as described later. The precom-
puted PPIs are an additional input data source, when
designing these enhanced CLDs in our framework.
Once an enhanced CLD is transformed into an SFD,
it is simulated and finally KPI predictions are gener-
ated. In a standard BD simulation run, each element
apart from static parameters or converters is simu-
lated. Since the PPIs are more accurately calculated
via event processing and BP simulations (as shown in
figure 1), they are not recomputed again in the BD
simulation. The reason behind this accuracy is the
availability of highly formalised and well structured
behavioural models and event data that enables an au-
tomated prediction process. The PPIs are therefore,
by definition, considered to be parameters or convert-
ers in a BD simulation run, even though, they also
change over time. Our solution introduces a new BD
element type called ”external variable”, which maps
to a precomputed PPI. Such an external variable is not
influenced by any of the other BD elements, but is still
continuously updated with each simulation run at the
operational level.
The creation of CLDs has always been a non-
trivial task, as discussed in Section 3. By introduc-
ing an additional operational PPI input, this prob-
lem becomes even more challenging. This raises the
need for a definition of some sort of a ”dependency
model” to provide a guideline on how to link to-
gether operational data to the KPIs. Such a model
needs to describe the relations and dependencies be-
On Advanced Business Simulations - Converging Operational and Strategic Levels
169
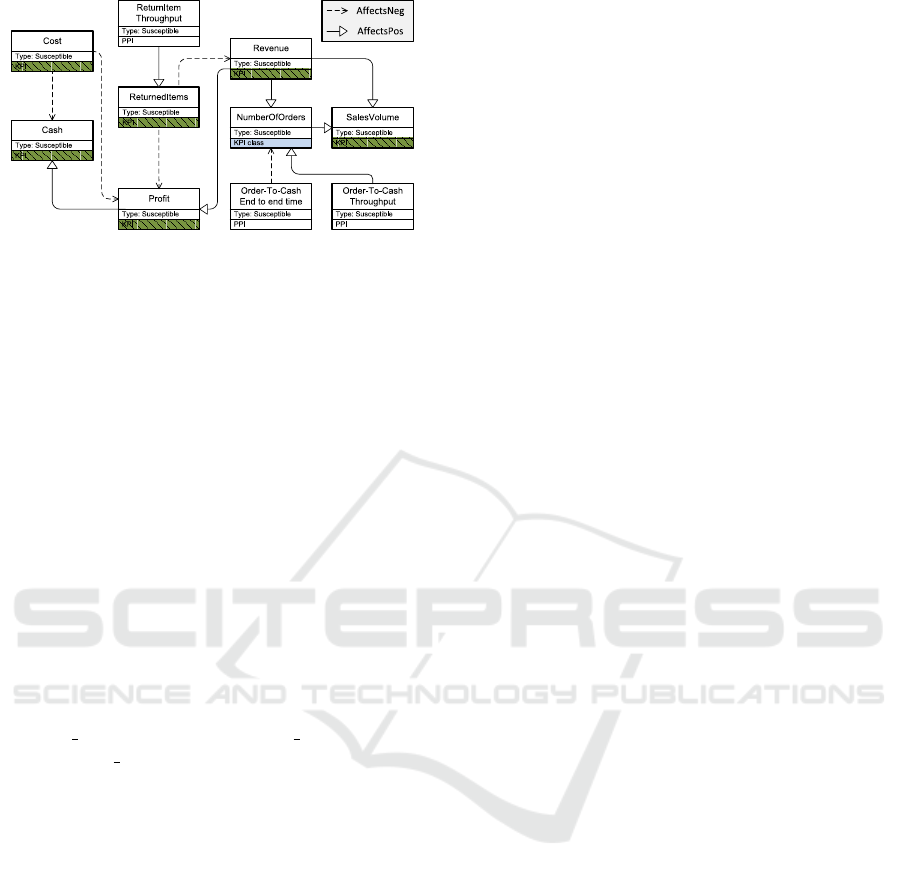
Figure 4: Visual representation of a business ontology to
describe the relation between KPIs and PPIs.
tween KPI-KPI and KPI-PPI, thus reflecting the se-
mantic knowledge that usually resides in the mental
models of the domain experts. Ontologies and knowl-
edge graphs are two examples for formal ”semantic
knowledge models” (SKM) (Zhang, 2002). Compa-
nies, such as Google, are using knowledge graphs to
”... understand real-world entities and their relation-
ships to one another”, which are either automatically
harvested from the web or are once manually created
by the domain experts and then reused (Steiner et al.,
2012). We find Ontologies to be well suited to de-
scribe this kind of semantic information and have in-
cluded such ”semantic knowledge models” into the
framework, as shown in figure 3. A snapshot of an ex-
ample retailer business ontology is shown in figure 4.
This picture visualises the connection between some
high-level KPIs, for instance, Revenue, NumberOf-
Orders, ReturnedItems, and three PPIs, namely Re-
turnItem Throughput, OrderProcess Throughput and
OrderProcess EndToEndTime. These three PPIs are
reflecting the throughput of the ReturnItem and
Order-To-Cash BP, as well as the average execution
time for one Order-To-Cash BP instance. Addition-
ally, the KPIs and PPIs are connected via two re-
lations: affectsPos and affectsNeg. Whilst the af-
fectsPos relation suggests a positive influence from
source to target element (e.g. directly proportional),
the affectsNeg relation negates this dependence (e.g.
inversely proportional). In this given case, we know
that the Order-To-Cash BP drives the high-level KPI
NumberOfOrders, which then impacts the sales vol-
ume and finally the overall revenue of the company.
If a modeller was to predict the company’s revenue,
she should consider the impact of the Order-To-Cash
PPIs and incorporate those into the simulation.
A valid question at this point is the expected num-
ber of KPIs and PPIs, which have to be considered to
create such ontologies. Mostly, BPs are standardized,
but are still sometimes customised to cater specific
requirements of particular companies, for instance,
introduction of additional activities in the standard
Order-To-Cash BP. The fundamental PPIs, such as
end-to-end execution time or instance occurrence,
still remain valid. The same holds for universal KPIs
(revenue, sales volume, cost), which are employed in
all companies to check the health status of the busi-
ness. On the other hand, there are also KPIs, which
are unique for each different company, e.g., ”number
of orders for product X” or ”current stock of product
Y”. Because companies are selling so many different
products and services, one can not simply map each
single product into one universal ontology. In our
framework, we have introduced the notion of KPI/PPI
classes. These classes are used as templates in the on-
tology. A good example for such a class in our on-
tology is NumberOfOrders, which acts as parent for
each single ”number of orders for specific product”
KPI. With this available ontology, all that is left for
the modeller to create CLDs, is: Classify the current
KPI/PPI and query the relationships of its parent class
to other KPIs/PPIs from the ontology.
The introduction of a link between the operational
and strategical level within our framework offers one
huge benefit: It enables the modeller to drill-down
from a high-level strategic view to the low-level op-
erational view. Since an enhanced CLD now contains
both, the KPIs and PPIs, possible strategic KPI bottle-
necks can be tracked all way down to the operational
level, thus showing the root cause of deviations. This
KPI-PPI connection is established with the help of on-
tologies within our framework. Additional benefits
of having such an ontology is, that these are highly
extensible and reusable for the targeted domains, for
instance, any newly observed domain specific depen-
dencies can be included into the ontology. On top
of that, ontologies are well suited for automated pro-
cessing and can easily be queried with SPARQL to re-
trieve the KPI/PPI relationships (The W3C SPARQL
Working Group, 2013).
5 CONCLUSION AND FUTURE
WORK
In this paper, we have proposed an advanced busi-
ness simulation framework that addresses the missing
connection between the strategic and operational level
in businesses, thereby converging the two domains.
Within our framework, the operational level PPIs are
included as a part of BD simulation for KPI predic-
tions and enabling operational level visibility. This
means any KPI violation at the strategic level can be
tracked down to the operational level to carry out cor-
rective actions. Furthermore, in order to address the
increased complexity resulting from the introduction
Fourth International Symposium on Business Modeling and Software Design
170

of PPIs into BD simulations, we have designed and
implemented additional SKMs. These SKMs (ontolo-
gies) provide knowledge about relations and depen-
dencies of KPIs and PPIs, and can be used as busi-
ness dictionaries to look up relationships of KPIs and
PPIs either manually or automatically. An automated
consumption of SKMs can further be used to auto-
mate the BD simulation process for continuous KPI
predictions in real-time. So far this approach is uni-
directional, because we have only incorporated PPIs
as main influencing factor towards KPIs. For future
work, it would be interesting to analyse the KPI influ-
ence towards PPIs as well. We believe, that the pre-
diction of PPIs could also be beneficially impacted
by incorporating the simulated KPIs. The next step
would be, to evaluate the framework in the context of
an industrial use-case, to demonstrate improved KPI
predictions.
REFERENCES
Ann, R., Chase, G., Omar, R., Taylor, J., and von Rosing,
M. (2011). Applying Real-World BPM in an SAP En-
vironment. Galileo Press, Bonn.
Binder, T., Vox, A., Belyazid, S., Haraldsson, H. V., and
Svensson, M. (2004). Developing System Dynamics
models from Causal Loop Diagrams. Technical re-
port, University of Luebeck, Germany; Lund Univer-
sity, Sweden.
Brockwell, P. J. and Davis, R. A. (2006). Time Series: The-
ory and Methods. Springer, second edition.
Burns, J. R. (1977). Converting signed digraphs to For-
rester schematics and converting Forrester schematics
to Differential equations. IEEE Transactions on sys-
tems, man, and cybernetics, 10:695–707.
Del-Rio-Ortega, A., Resinas, M., and Ruiz-Cortes, A.
(2010). Defining Process Performance Indicators : An
Ontological Approach. On the Move to Meaningful
Internet Systems: OTM 2010, 6426:555–572.
Drobek, M., Gilani, W., and Soban, D. (2013). Parameter
estimation and equation formulation in Business Dy-
namics. In Third International Symposium on Busi-
ness Modeling and Software Design, Noordwijker-
hout. ScitePress.
Ford, A. (1999). Modeling the environment: An Intro-
duction to System Dynamics Models of Environmental
Systems. Island Press, Washington, D.C.
Ford, D. N. and Sterman, J. D. (1998). Expert knowledge
elicitation to improve formal and mental models. Sys-
tem Dynamics Review, 14(4):309–340.
Forrester, J. W. (1961). Industrial Dynamics. MIT Press;
currently available from Pegasus Communications;
Waltham, MA, Cambridge, MA.
Forrester, J. W. (1991). System Dynamics and the Lessons
of 35 Years. pages 1–35.
Fritzsche, M., Picht, M., Gilani, W., Spence, I., Brown,
J., and Kilpatrick, P. (2009). Extending BPM Envi-
ronments of Your Choice with Performance Related
Decision Support. In Business Process Management,
pages 97–112. Springer.
Granger, C. W. J. (1969). Investigating Causal Relations
by Econometric Models and Cross-spectral Methods.
Econometrica, 37(3):424–438.
Hecking, M. and Schroder, C. (2013). Current Implementa-
tion Level of Business Process Management in Corpo-
rate Practice: A Quantitative Analysis. GRIN Verlag.
Heilig, B. and M
¨
oller, M. (2014). Business Process Man-
agement mit SAP NetWeaver BPM. Galileo Press
Gmbh, 1st edition.
Howson, C. and Newbould, E. (2012). SAP BusinessOb-
jects BI 4.0 The Complete Reference 3/E. McGraw-
Hill Osborne, 3rd edition.
Intalio (2013). BPMS designer; http://www.intalio.com/
products/bpms/overview/.
Ko, R. K. L., Lee, S. S. G., and Lee, E. W. (2009). Busi-
ness process management (BPM) standards: a survey.
Business Process Management Journal.
Porzucek, T., Kluth, S., Fritzsche, M., and Redlich, D.
(2010). Combination of a Discrete Event Simula-
tion and an Analytical Performance Analysis through
Model-Transformations. In IEEE ECBS, pages 183–
192.
Redlich, D. and Gilani, W. (2011). Event-Driven Process-
Centric Performance Prediction via Simulation. In
BPM Workshops.
Richmond, B. and isee systems (Firm) (2008). An Introduc-
tion to Systems Thinking: STELLA Software.
Robinson, S. (1964). Simulation - The Practice of Model
Development and Use. John Wiley & Sons.
SoftwareAG (2014). Software AG: webMethods, last
accessed: April 2014; http://www.softwareag.com/
corporate/products/wm/bpm/overview/default.asp.
Steiner, T., Verborgh, R., Troncy, R., Gabarro, J., and Walle,
R. V. D. (2012). Adding Realtime Coverage to the
Google Knowledge Graph. In Proceedings of the
ISWC 2012.
Sterman, J. D. (2000). Business Dynamics: Systems think-
ing and modeling for a complex world. McGraw-Hill,
New York, NY.
The W3C SPARQL Working Group (2013). SPARQL
Query Language for RDF; http://www.w3.org/TR/
rdf-sparql-query/.
Van Der Aalst, W. (2011). Process Mining - Discov-
ery, Conformance and Enhancement of Business Pro-
cesses. Springer.
Woods, D. and Word, J. (2004). SAP Netweaver for Dum-
mies. Wiley Hoboken.
Zhang, L. (2002). Knowledge Graph Theory and Structural
Parsing. Ph.d. thesis, University of Twente.
On Advanced Business Simulations - Converging Operational and Strategic Levels
171
