
Multi-Level Business Modeling and Simulation
Koen Casier, Marlies Van der Wee, Sofie Verbrugge
Internet Based Communication Networks and Services research group –IBCN, Ghent University, Belgium
Koen.casier@intec.ugent.be
Heritiana Ranaivoson, Tanguy Coenen, Camille Reynders
SMIT research group, Vrije Universiteit Brussel, Belgium
Keywords: Cost Benefit Analysis, Computer Networks, Computational Modeling, Graphical Models, Cost Benefit
Modeling, Business Modeling.
Abstract: The rapid succession of technological advances leads to important convergences of applications, devices
and networks. More and more firms, previously locked in a niche, are exposed to a more global market and
interactions with other firms. Pushing a new offer on the market requires a thorough understanding of this
altered market. In essence, pushing a new offer requires basic business modeling and simulation. Often, this
is performed by making a “back of the envelope” calculation. This calculation quickly grows out of
proportions if the novel business proposition requires interactions with many other parties. In this paper, we
present a scalable multi-level business modeling and quantification approach. It combines the intuitive
structure and interactive discussions of a multi-user business modeling tool, while directly linking to a lower
level for more technical modeling and simulation of costs and revenues. By combining these two levels of
refinement, the business aspects are clearly separated from the calculation techniques, increasing ease and
speed of modeling at the business side. Delegating the cost calculations to the more technical models allows
for a truthful and reliable mimicking of the actual structure and costs. To achieve this, several detailed cost
modeling languages are presented and linked to the higher level business modeling. Finally, this multi-level
business modeling and simulation approach is applied to the case of an open access fibre to the home
network deployment. The results clearly show the power of using such a multi-level business modeling and
simulation approach.
1 INTRODUCTION
Increasing competitive pressure makes business
model innovation an important issue for most
companies. Especially collaborative business
models, which require a strategic fit between various
stakeholders involved, require an intensive
interaction and consensus building related to
assumptions, architectures and outcomes. Like many
other creative processes (architecture, software
design, new product development, etc.), business
model innovation can also be supported by tools
(Coenen et al, 2010). However, while a few basic
frameworks exist, tool development for
collaborative business model innovation is still in its
infancy.
Many business modelling approaches start from
a conceptual visualization of the context of one
offering on the market, typically of one firm
(Osterwalder et al, 2005) and (Al-Debei et al, 2010).
The extended notion of a multi-firm interaction with
several offerings and objectives exists and is
typically visualized by means of a value network
(Pijpers 2011). Still, most approaches are aimed at
visualizing the interactions, often around one central
firm and looking at one final offering on the market.
A more truthful representation of reality in a
business model should be seen as a network or graph
of actors, the activities they perform, and all kinds of
interactions between these actors. In order to be
useful in advanced analysis, such business model
should be set up according to a standardized
ontology for which we used the SIMBU method
(Coenen et al, 2009) as a starting point. The simple
but expressive ontology proposed there, allows for
the creation of complex business models and permits
the support of consecutive simulations, to give users
a better basis for decision making.
172
Casier K., Wee M., Verbrugge S., Ranaivoson H., Coenen T. and Reynders C.
Multi-Level Business Modeling and Simulation.
DOI: 10.5220/0005425701720179
In Proceedings of the Fourth International Symposium on Business Modeling and Software Design (BMSD 2014), pages 172-179
ISBN: 978-989-758-032-1
Copyright
c
2014 by SCITEPRESS – Science and Technology Publications, Lda. All rights reserved

Although a business model consists of smaller
elements as roles, actors, activities, value streams,
etc., this is much too high level to estimate costs,
revenues, losses or profits. Traditional cost benefit
analysis, on the other hand, takes a closer look at the
economics of a new investment, starting from
dedicated calculations (Analysys Mason, 2008) in
isolated cases and working with generic and reusable
cost modeling languages and calculations (Van der
Wee et al, 2012). Making dedicated calculations
requires every researcher to redo the modeling if
they have no access to the original model.
Additionally, it does not allow extending and linking
to other models. Building complex models will
benefit from reusability, verification, exchange
between researchers and business experts and
linking to other models. Additionally using domain
specific languages as opposed to grand tools with
many parameters, will increase the transparency and
ease of reading and understanding. Combining both
approaches by working with standardized, reusable,
domain specific languages will increase the strength
of the business models.
On the one hand business experts (e.g. CEOs,
entrepreneurs) talk about the roles and interactions
of the different actors in a business model when they
want to introduce a novel product or service on the
market. On the other hand, a cost-benefit analysis is
typically built for an isolated business case (one
actor only), using dedicated, purpose-built models. If
both approaches can be captured with the right level
of detail and domain specific intuitive models and
linked to each other, this will lead to additional
information on the full business model, as well as on
the isolated business cases. The combination of
approaches will allow business experts to work on a
higher level and design the business model as links
between more detailed cost-benefit models, e.g.
cloud infrastructure, network installation, etc. These
models are then delegated to technical experts and
more detailed modeling languages. A repository of
models and fragments at both levels will increase the
applicability of the approach and the speed of
prototyping business models. This paper presents the
combined approach, which is under active research
and development and is called hereafter the BEMES
(Business Modeling and Simulation) approach.
In this paper, the BEMES approach is applied to
a prototype business model for a fiber to the home
(FTTH) case, where one physical infrastructure
FTTH provider is installing a new FTTH network
and opening up this network in a non-discriminatory
way to all available network and service providers.
The multi-level business modeling approach allows
visualizing the main business interactions rapidly,
and learns about the profitability of all actors at the
same time. It also shows the ways one firm’s failing
business case can be made viable within the group of
actors in the full business model.
In section II, the BEMES business modeling tool
is rapidly introduced and then compared to some of
the main existing business modeling approaches.
As mentioned above, the business models need
to be complemented with a cost-benefit analysis in
order to get correct and useful advice and
information from the business model. Building a
reliable cost-benefit analysis also benefits from
using problem specific modeling languages. In
Section III, an overview of existing and novel cost
modeling languages (technical expert tools) is
presented.
In Section IV, both levels of modeling are linked
to each other. As a proof of concept, a multi-level
model for an open access FTTH network is built and
the results of this model are inspected.
Finally, Section V concludes by summing up the
main findings of this work and by presenting future
steps in the development and extension of this multi-
level business modeling and simulation approach.
2 BUSINESS MODELING
People use business modeling with the aim to
analyze the current functioning of a firm or an
industry, identify challenges, and possibly propose
better business configurations. When building the
business model, users need a highly interactive tool
for drawing and discussing on their view of the
industry actors and their interactions. It should be
sufficiently high level, and no detailed cost and
revenue discussions or simulations should be
necessary at this level. The BEMES Business
Modeling, proposed in this paper, is based on the
SIMBU method (Coenen et al, 2009). It features a
value-flow based approach, and uses a simple and
intuitive ontology specifically designed to allow for
collaborative business modelling.
With BEMES, building a business model
consists in identifying every actor, their activities
and the interactions between their activities. A
business model configuration corresponds to a given
business model with specific values (e.g. cost
amounts, revenue percentages, etc.). It is easy to
compare different configurations or scenarios by
playing with these values within the given business
model. It is also possible to compare different
approaches in setting up a working business model
Multi-Level Business Modeling and Simulation
173
by playing with the definition of the actors, the
definition and repartition of the activities, and the
definition of the relationships between the activities.
The following elements are required to get a both
intuitive limited modeling set and a high
expressivity of the model:
• The Actor represents a business model
stakeholder.
• An Activity is undertaken by an actor.
• A Flow represents a relationship between
Activities.
• A flow can either be a monetary flow or a flow
of goods and/or services.
• Value Sharing represents the division of one
monetary flow into multiple monetary flows.
• A Swim lane is horizontally oriented and groups
all the activities of an actor.
• A sub model allows the business modeling to be
itself hierarchically structured and is typically
used to increase readability of the model.
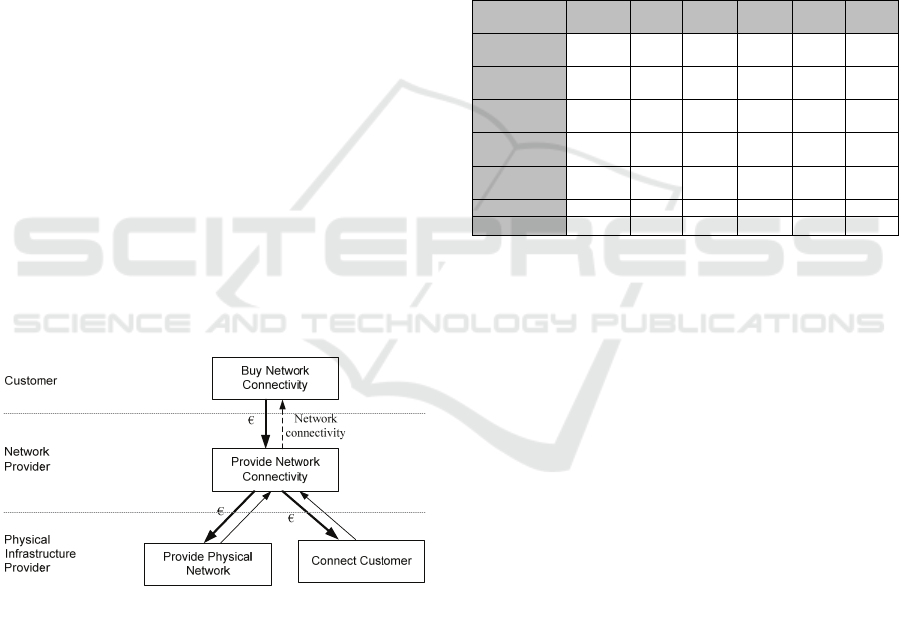
In Figure 1, a FTTH network is modeled, using
BEMES. There are three Actors in this Business
Model: (1) the Customer who buys network
connectivity at (2) the Network Provider. This
Network Provider, in order to be able to provide
network connectivity needs (3) the Physical
Infrastructure Provider, who provides physical
network and connects customers. Arrows between
the Activities performed by each Actor show the
flows of money or services between the Actors’
Activities.
Figure 1: business model for the open access FTTH
deployment.
2.1 Comparison of BEMES
to other Business Modeling
Various other business modeling approaches and
languages exist and Table 1 provides a comparison
of BEMES to the mainly used other business
modeling approaches. Every approach’s main
advantages and disadvantages are briefly discussed
after the table.
One of the most salient business modelling
approaches is the Business Model Canvas (BMC),
based on Osterwalder’s work (Osterwalder and
Pigneur, 2010). The Business Model Canvas is an
ontological construct composed of 9 different
categories participants (key partners, key activities,
value proposition, customer relationships, customer
segments, key resources, channels, cost structure and
revenue streams) that need to be reflected on by a
group of stakeholders. In the Business Model
Canvas philosophy, a brainstorming session is done
as a workshop, where all participants are asked to
place Post-it notes on the canvas and discuss the
implications of their actions.
Table 1: Comparison of business modeling approaches.
BEMES e
3
value
Moby BMW BMC CBM
Value
Proposition
+/- - - + + - + + + +
Multiple
Actors
+ + + + + / - - - - - - -
Flexible
Relations
+ + + + + + - - - - - -
Value Net
Completeness
+ + + + + - - - - - -
Value Net
Simulation
+ + - - + / - + / - - - - -
Ease of Use + - - - - + + + + +
Intuitivism + - -
- -
+ + + +
Konnertz (Konnertz et al, 2011) has proposed the
collaborative business modelling (CBM) approach,
which uses the Business Model Canvas by placing
post-it notes on the canvas, generating a number of
business models. After this is done, the business
models are prioritised on the dimensions of
attractiveness and effort. The models that are most
attractive and take least effort are the ones that get
most attention in the validation phase.
The Business Model Canvas method can be a
powerful eye-opener and a good brainstorming
framework, but it has some severe limitations if one
wants to use it in an Open Business Model
Innovation process. Firstly, the output of the
Business Model Canvas method is a list of elements
that can be bundled in scenarios. There is little
support for making plain the relationships and
interactions between the different elements. These
relations and interactions make the difference
between a business model as a static list of its
constituents and a business model that is dynamic, as
is the environment in which it will operate.
In terms of the open innovation perspective
(Chesbrough, 2005), some categories exist in the
Business Model Canvas approach that can be linked
to more open, multi-actor, value-networks, like key
Fourth International Symposium on Business Modeling and Software Design
174

partners and channels. Still, the reflection
engendered by the Business Model Canvas is mainly
focused on one organization. In Open Business
Model Innovation, several business actors
collaborate to realize a value proposition in a
relationship of mutual benefit. Finding a sustainable
business model requires the perspective of the
different actors to be made explicit and combined in
a consensus business model.
Second, the Business Model Designer, described
in (Weiner and Weisbecker, 2011), is built on a very
broad ontology and allows the creation of very
detailed representation of the components that are
related to a value proposition, both within an
organisation and outside of it. In particular, it allows
the mapping of resources that an organisation should
use in order to realise the value proposition, as well
as the competitors that the organisation will have to
deal with.
Third, the Business model wizard (BMW) allows
for the creating of a business model by configuring
25 elements using an online form. The result is a
business model that can be analysed and compared
to the business models of existing organisations.
While this is an easy to use approach, it focuses on
one organisation and is constrained by the 25
elements that are part of the model.
Fourth, the e3-value modelling approach
proposed by (Gordijn et al, 2011) has tool support in
the form of the e3 editor. This approach focusses
more on the dynamics of the business model than on
its constituents. The e3-value approach allows for
the creation of highly formalized business models.
However it requires a substantial amount of time in
order to learn the interface and the modelling
language.
In conclusion, BEMES is simple yet powerful. It
allows for the expression of a complex business
model, while being easy to learn by the modelers.
The emphasis is more on the business knowledge of
the modeler than on the business modeling skills of
the modeler. Furthermore, the business modeling
ontology allows for easy understanding of models
created by others, which supports collaborative
business modeling. Finally, models built using this
ontology can be used to do high-level or detailed
quantitative cost and revenue simulations.
3 COST MODELING
When making a business plan for the deployment of
a novel open access FTTH network, close
interaction between the physical infrastructure
provider, network provider and any other involved
parties will be necessary. The different parties will
especially be interested to learn more on the costs
they incur and have to pay to the other parties and to
what final customer price this will lead. The FTTH
network consists of the outside plant as well as the
in-house installation and the installation of all
central office equipment. It also requires operational
processes in order to keep the network up and
running and to sell services on top of this network.
Much literature exists on how to build a business
case for an FTTH network (e.g. Analysys Mason,
2008, Van der Wee et al, 2012, Banerjee and Sirbu,
2003 or Medcalf and Mitchell, 2008). However it is
hard for a researcher to follow the model in all these
papers, as the models are typically not expressed in a
format easy to read, easy to duplicate and use in
other modeling steps. Additionally, each paper has a
separate focus and only includes certain parts of
total costs, making comparison very difficult.
Visual modeling languages help in making the
business modelers and technical experts quickly
aware of what it takes into account and how it will
be calculated. A uniform and consistent translation
from model to costs furthermore assures a correct
calculation of the costs and deduces the right
economic indicators from it. In what follows we link
existing modeling approaches to each other and
apply them in making a solid cost model for open
access network architectures. Where necessary, we
introduce and developed a novel modeling approach
and link to more rigid specifications of the new
language. Three cost modeling approaches are
presented – infrastructure or network modeling,
equipment coupling modeling and operational
modeling – and one novel language for modeling the
way revenues are estimated. The former three will
be directly mapped to an activity on the business
model, where the latter is linked to the monetary
arrows linking these activities. All four combined
allow rapid and reliably estimating the investment
costs and revenues of the business case at hand.
3.1 Infrastructure Modeling
The largest cost of the network will come from
installing the outside plant, i.e. deploying the fiber
into trenches to connect all customers to the central
office. Several models already exist for making an
analytical estimation of this cost (Mitcsenkov et al,
2013). Considering the size of this cost, a more
detailed calculation can be made using an ILP
formulation. In (Mitcsenkov et al, 2013) a
comparison is made between two analytical models
Multi-Level Business Modeling and Simulation
175
and a full optimal installation calculation tool, and
the street based estimation model will be used in the
following example calculations. As an example area
we use the city of Ghent, the third largest city of
Belgium counting almost 235,000 inhabitants on an
area of 156 km². The FTTH rollout is limited to the
city center, with ca. 90,000 inhabitants or 42000
families on 20 km². (Gent, 2013).
3.2 Equipment Modeling
The second important cost is linked to the
installation of the equipment in the central office. In
order to calculate the costs of the installation of this
equipment and taking into account all possible
failures of this equipment in time and their
replacements, we developed a novel modeling
format. This modeling format is based upon
previous work (Van der Wee et al, 2008), and
extended with indications of replacement period of
the equipment (in accordance to either proactive
maintenance or of failure rates), power consumption,
floor space consumption, etc.
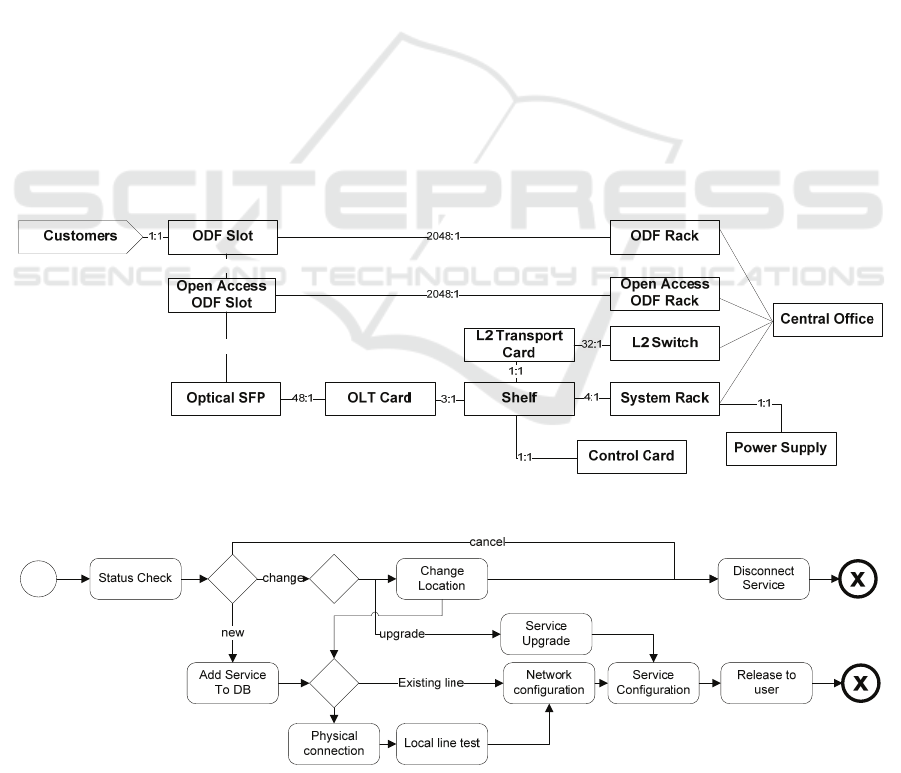
The model is based on (1) main drivers for
equipment installation which are represented by
arrows and will be used in the calculation of the
required amount of equipment linked to these
drivers. Every block from thereon will become a
driver for next blocks once calculated. (2)
Equipment blocks that hold all information on the
cost, replacement time, etc. and (3) aggregators
which will aggregate the incoming demands from
different drivers and sub-equipment in a specific
manner (sum, max, etc.). Finally all blocks are
linked to each other by means of lines with an
aggregation factor. More information on this novel
format can be found at (Casier, 2013). The
equipment model used in this simplified business
model is shown in Figure 2.
3.3 Operational Modeling
Operational modeling is based on the standardized
Business Process Modeling Notation (BPMN)
(OMG, 2013) restricted to a smaller subset only
containing the main flowchart structures required for
cost calculation. Using an approach based on
activity based costing (Kaplan and Anderson, 2004)
and described in (Casier, 2009), the costs can be
linked to the execution of the process for a given
planning horizon. The model for customer
connection used in the case of an open access FTTH
network is shown in Figure 3.
Figure 2: Equipment Coupling Modeling Notation for an open access central office infrastructure and network installation.
Figure 3: Business Process Modeling Notation for the operational process of customer provisioning.
1:1 1:1
+
+
+
Fourth International Symposium on Business Modeling and Software Design
176

3.4 Revenue Modeling
Once the full network, the equipment and the
operational expenditures are modeled, all costs of
the business model can be calculated. Still, this is
only part of the analysis and should be
complemented with a modeling of the revenues for
each activity in the business model. The revenue
modeling is aiming to calculate the revenues based
on the costs and the number of paying customers. As
such it has a notion of a fixed revenue scheme but
also of an adaptive scheme aiming at break-even or a
profit over break-even with an adjustable timing on
when to get up to this point. Additionally the
revenue model allows switching between revenue
schemes at a given time or condition (e.g. critical
customer mass reached). This revenue modeling
allows answering questions on the main economic
indicators such as profitability, minimal and advised
pricing or payback period. A more formal
specification of the full model is given in (Casier,
2013). The models used in pricing the open access
and the final connection price are kept deliberately
very simple, where we assume each role to aim for
20% profit over a planning horizon of 10 years.
Deploying the physical infrastructure of the network
will make an exception to this and aim for 10%
profit over a planning horizon of 20 years.
4 MULTI-LEVEL MODELING
The multi-level modeling links the cost and revenue
models to the respective higher level elements,
activities and monetary flows in the business model.
A cost estimation model is attached to each activity
in the business model actually leading to costs in its
execution. A revenue model is attached to each
monetary flow between two activities. Finally,
additional input (e.g. amount of customers or price
of equipment) can be defined as time-dependent
values and linked to the models of the activities.
Once all inputs are defined, all activities causing
costs and all monetary flows are linked to a cost,
respectively a revenue model; the business model
can be fully simulated.
The calculation starts from the activities of the
graph which have no outgoing monetary value
exchanges, or in other words, which use no service
from a lower level activity for which they are
charged. The costs in these blocks can be fully
calculated using their internally attached cost model.
In the case of Figure 1 the cost for the physical
infrastructure can readily be calculated. When this
cost is known together with the expected amount of
customers, executions, etc., this should be charged to
the revenue model and linked to the monetary
incoming arrow(s) to be able to calculate pricing and
total revenues. Again in Figure 1 the amount the PIP
will charge to the NP for the use of its infrastructure
can now be calculated. The same calculation steps
can be taken for connecting the customers and the
price charged for this role to the NP. At this point
the network provisioning is becoming the next point
in the calculation, as all outgoing value exchanges
linked to this activity are fully quantified. And
finally this allows calculating the price to charge to
the end customer. This recursive scheme allows all
activities and monetary flows in any business model
to be fully quantified.
We translated Figure 1 into a business model
configuration that can be simulated by attaching the
infrastructure cost model to the physical
infrastructure deployment role, linking the
equipment model for the active equipment to the
network deployment role and finally operational
model to the network provisioning role. We assume
all monetary flows to aim for 20% profit on the costs
of the role (and underlying roles). As mentioned the
infrastructure considers only 10% profit. Additional
information can be exchanged between models, as
for instance the amount of installed equipment will
be the driving value for operational maintenance.
When calculating the business model for the
given scenario, the different cost components are
calculated in terms of the amount of customers in the
area (physical infrastructure) and the amount of
customers to connect to the network. The first is
equal to the amount of inhabitants in Ghent and for
the second, we consider a bass adoption curve with
as market potential 95%, with innovation (p) 0.03
and imitation (q) 0.38. A demand aggregation of
30% is expected as a boundary condition for the
FTTH network deployment. All costs of the physical
infrastructure and network provider are discounted
with a discount factor of 5% respectively 10%.
Figure 4 gives the results for the cumulative
discounted costs, revenues and outcome for the 10
years for (top) the PIP infrastructure, (middle) the
PIP operational expenditures and (bottom) the
overall NP outcome.
In this business case the PIP will have to charge
a price of €235 per customer per year to the NP for
the use of its infrastructure and a price of €42 for
Multi-Level Business Modeling and Simulation
177
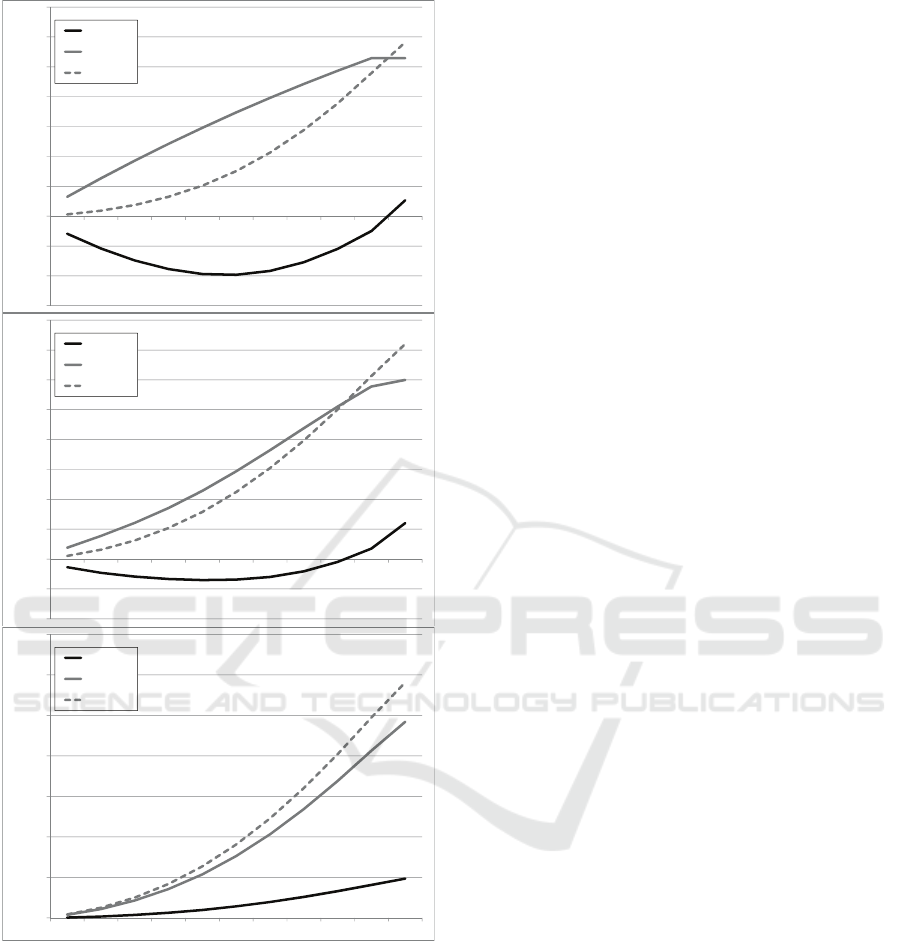
Figure 4: Overview of the costs, revenues and profit for
the different roles in the open access business case.
making a connection to a customer. This already
incorporates the fact that customers will only need a
one-time physical connection and changing
providers afterwards does not require dispatching an
installation team. This leads to an overall cost of
€277 per customer per year charged from the PIP to
the NP, which is equal to a monthly price of €23
(€19.5 for the infrastructure).
The NP will additionally provide the necessary
equipment and make a contract with the PIP. In
order to accomplish this, the NP needs to charge the
customer a yearly fee of €339 or a monthly fee of
approximately €28.
5 CONCLUSIONS
& FUTURE WORK
Building a viable business case for a commercial
offering based on novel technology on the market is
not straightforward; especially in case different
actors have to cooperate. Estimating the viability of
such business cases requires input and knowledge
from two research fields – (1) techno-economic
research in which cost simulation models are built
and (2) business modeling in which graphical
models are focusing on the roles, actors and their
interactions. A combination of both requires a multi-
level business modeling approach in which a
graphical business model is linked to separate
techno-economic simulations. Clearly this will
require an intuitive and complete business modeling
ontology in combination with domain specific
techno-economic cost as well as revenue simulation
languages.
In this paper we have presented a multi-level
business modeling approach – called BEMES – with
a very intuitive yet complete business modeling
ontology and linked (in an extensible manner) to
network infrastructure, business process and a novel
equipment modeling as well as to a (also novel)
revenue modeling. We have used this approach to
build a business model for an open access FTTH
network deployment in which a physical
infrastructure provider is leasing the fibers to a
network provider together with the operations for
connecting customers. Both actors will aim for a
profit of 10% (infrastructure) respectively 20%
(network). This business model configuration clearly
shows the value of BEMES as the viability of the
overall business case can be quickly checked against
the final subscription price that needs to be charged
to the customers. In this way we learn that an open
access deployment in the city center of Ghent should
demand at least €28 for providing FTTH
connectivity to the end customer.
ACKNOWLEDGEMENTS
The authors have received funding from the Agency
for Innovation by Science and Technology in
Flanders, Belgium, and the BEMES project is part of
-15
-10
-5
0
5
10
15
20
25
30
35
012345678910
Outcome in Euro (Millions)
Yea r
cashflows
costs
revenues
-1
-0.5
0
0.5
1
1.5
2
2.5
3
3.5
4
012345678910
Outcome in Euro (Millions)
Yea r
cashflows
costs
revenues
0
5
10
15
20
25
30
35
012345678910
Outcome in Euro (Millions)
Yea r
cashflows
costs
revenues
Fourth International Symposium on Business Modeling and Software Design
178

the FI-WARE: Future Internet Core Platform
European project (grant-nr. 285248).
REFERENCES
Al-Debei, Mutaz M., Avison D.. "Developing a unified
framework of the business model concept." European
Journal of Information Systems 19.3 (2010): 359-376
Analysys Mason, “Final report for the Broadband
Stakeholder Group: The costs of deploying fibre-based
next-generation broadband infrastructure”, Ref:
12726-371 (8 September 2008).
Banerjee A. and Sirbu M., “Towards Technologically and
Competitively Neutral Fiber to the Home (FttH)
Infrastructure,” in Proceedings of The 31st Research
Conference on Communication, Information and
Internet Policy, Washington DC, USA (19-21
September 2003).
Casier K, Techno-Economic Evaluation of a Next
Generation Access Network Deployment in a
Competitive Setting, PhD degree at the Faculty of
Engineering of the Ghent University obtained, October
8th 2009
Casier K, Revenue Modeling Wizard Specification, 2013,
http://forge.fi-ware.eu/plugins/mediawiki/wiki
/fiware/index.php/FIWARE.OpenSpecification.Apps.
BusinessCalculator.Revenue
Casier K., The Equipment Coupling Modeling Notation
(ECMN) Specification, 2013, http://forge.fi-
ware.eu/plugins/mediawiki/wiki/fiware/index.php/
FIWARE.OpenSpecification.Apps.BusinessCalculator
.ECMN
Chesbrough, H. W. “Open innovation : the new imperative
for creating and profiting from technology” Boston,
Mass.: Harvard Business School Press., 2005
Coenen, T., De Waele L., Ballon P.. "The Simbu method-
Supporting creativity in business modelling for open
innovation” 2009
Coenen, T., Ranaivoson, H., Ballon, P. “Tool support for
the Open Business Model Innovation funnel”.
Proceedings of ISPIM Innovation Symposium 2010,
Quebec, Canada.
Gent, Gent in Cijfers, Online information on the city of
Ghent (Dutch), http://gent.buurtmonitor.be/
Gordijn, J., De Leenheer P., and Razo-Zapata I.
"Generating Service Value Webs by Hierarchical
Configuration: A Case in Intellectual Property Rights
Clearing." System Sciences (HICSS), 2011 44th
Hawaii International Conference on. IEEE, 2011
Kaplan R.S., Anderson S.: “Time–Driven Activity-Based
Costing,” Harvard Business Review, 2004, vol. 82, no.
11, pp. 131-138.
Konnertz, L, Rohrbeck R., and Knab S. "How
collaborative business modeling can be used to jointly
explore sustainability innovations."ISPIM Annual
Conference, Hamburg, Germany. 2011.
Medcalf R., Mitchell S., “Fiber to the Home: Technology
Wars”,
http://www.cisco.com/web/about/ac79/docs/wp/Tech_
Wars_Part__1_Ext_EI_0128.pdf (January 2008).
Mitcsenkov A., et al., Geometric versus Geographic
Models for the Estimation of an FTTH Deployment,
Telecom Systems Journal special issue, May 2016
(accepted)
Object Management Group/Business Process Management
Initiative, http://www.bpmn.org/
Ostenwalder A., Pigneur Y., Tucci C.L., Clarifying
Business Models: Origins, Present, and Future of the
Concept, Communications of AIS, Volume 15, Article
1, 2005
Osterwalder, A. & Pigneur, Y., 2010. Business Model
Generation: A Handbook for Visionaries, Game
Changers, and Challengers, Hoboken, New Jersey:
John Wiley & Sons
Pijpers V. • De Leenheer P., • Gordijn J.,• Akkermans H.,
Using conceptual models to explore business-ICT
alignment in networked value constellations,
Requirements Engineering (13 October 2011), pp. 1-
24
Van der Wee M., et al., A modular and hierarchically
structured techno-economic model for FTTH
deployments. Comparison of technology and
equipment placement as function of population density
and number of flexibility points, ONDM 2012
Weiner N, Weisbecker A. "A Business Model Framework
for the Design and Evaluation of Business Models in
the Internet of Services." SRII Global Conference
(SRII), 2011 Annual. IEEE, 2011
Multi-Level Business Modeling and Simulation
179
