
Business Model Design
An Evaluation of Paper-based and Computer-Aided Canvases
Boris Fritscher and Yves Pigneur
Faculty of Business and Economics, University of Lausanne, 1015 Lausanne, Switzerland
boris.fritscher@unil.ch, yves.pigneur@unil.ch
Keywords: Business Model Canvas, Computer-Aided Business Model Design, Guidelines.
Abstract: In recent years, Business Model Canvas design has evolved from being a paper-based activity to one that
involves the use of dedicated computer-aided business model design tools. We propose a set of guidelines
to help design more coherent business models. When combined with functionalities offered by CAD tools,
they show great potential to improve business model design as an ongoing activity. However, in order to
create complex solutions, it is necessary to compare basic business model design tasks, using a CAD system
over its paper-based counterpart. To this end, we carried out an experiment to measure user perceptions of
both solutions. Performance was evaluated by applying our guidelines to both solutions and then carrying
out a comparison of business model designs. Although CAD did not outperform paper-based design, the
results are very encouraging for the future of computer-aided business model design.
1 INTRODUCTION
In a fast-evolving business landscape, companies
need to turn to new methods to help them rethink
their business strategy. By using a Business Model
Canvas (BMC), they can get a better picture of their
current business model, as well as create new ones.
These methods are gaining in popularity, leading to
the creation of a range of tools to support them.
Thus, BMC design has evolved from being a paper-
based activity to being one that is supported by
custom-built computer-aided business model design
(CABMD) tools. Such tools provide functionalities
that are similar to the paper experience, but offer
additional options such as version handling and
calculation. However, in order to give free rein to
creativity, the tools tend to be open in nature,
making them difficult to use in a structured
environment in which software tools are used. This
is especially the case if the application is expected to
assist the model itself. Guidelines can help by
capturing and encapsulating knowledge that has
been collected from best practice. This knowledge
can then be offered to users. Elaborating guidelines
helps in the design of more coherent business
models; in turn, this helps to improve the way in
which CAD can support business model design.
Nonetheless, all these advanced CAD tools, which
are aimed at supporting the BMC, are worthless if
they hinder the creative-thinking process enabled by
the paper version. However, if evaluation can show
that a digital canvas is perceived and performs at
least as well as a paper-based canvas, this promises
great potential. For example, some features, such as
automated guidelines validation, are only possible
with digital tools.
The focus of this research can be summarized by
the following questions:
Can guidelines help to produce a more coherent
business model canvas?
How does using a computer-aided business
model canvas design tool affect perception
compared with using a paper-based version?
How does using a computer-aided business
model canvas design tool affect performance
compared with using a paper-based version?
In the next section we present any justificatory
knowledge, followed by a short description of our
methodology. We then present the guidelines
themselves and the way in which they can be
supported by CAD. Our evaluation also includes a
business model case and an experiment aimed at
comparing paper-based design with CAD. The
results are presented, along with any lessons learned.
236
Fritscher B. and Pigneur Y.
Business Model Design An Evaluation of Paper-based and Computer-Aided Canvases.
DOI: 10.5220/0005426602360244
In Proceedings of the Fourth International Symposium on Business Modeling and Software Design (BMSD 2014), pages 236-244
ISBN: 978-989-758-032-1
Copyright
c
2014 by SCITEPRESS – Science and Technology Publications, Lda. All rights reserved

2 DESIGNING BUSINESS
MODELS
According to Osterwalder and Pigneur (2013) there
are three areas where IS research can contribute to
strategic management. First, modelling at a strategic
level requires a common language and
representation. One business model visualization in
particular is starting to be widely adopted by
practitioners: the Business Model Canvas (BMC)
(Osterwalder and Pigneur, 2010).
Second, the strategizing process should be seen
as a design activity. Here, design means elicitation
and testing; namely, the generation of ideas and their
validation.
Third, they put forward the idea that CAD can
“make tasks easier and quicker, while revealing as-
yet-unseen opportunities” (Osterwalder and Pigneur,
2013).
For the purpose of our study, testing in business
model terms represents two things: 1) coherence of
the business model and 2) commercial viability of
the business hypothesis. In this paper, we will focus
on the former, since it can be addressed by CAD
tools.
2.1 BMC Evaluation
The BMC design activity is usually a team effort
that involves stakeholders across the company. A
recent survey
1
of 1,172 users confirmed that 74% of
them carry out design in groups of 2 to 10
collaborators. Moreover, from research undertaken
by Reinig (2003: 65), we know that “the satisfaction
users have with the processes and outcomes of the
teamwork itself often determines the ultimate
adoption and sustained use of collaborative
technologies”. Therefore, it is important to compare
users’ perceptions of paper-based BMC with its
computer-aided counterpart.
To date, few studies have sought to evaluate
BMC design. However, Hoffmann et al. (2012) have
shown that paper-based BMC design outperforms
two other idea generation methods considerably.
They noted that: “The ability to select the best idea
was found to be much higher when groups worked
with the business model canvas: 80 per cent of
groups selected the best idea”. Their decision to
limit their study to paper-based design was based on
the extensive training and potentially expensive
support systems required by electronic methods.
In their research, Lucassen et al. (2012) focused
on how business model methods can be supported
1
Internal survey, Business Model Foundry GmbH 2012
by software. They came to the conclusion that,
“BMC is the preferred method because it effectively
models explicit information of both tangible and
intangible aspects of the business and communicates
this information in a highly accessible manner to
parties unfamiliar with the modeling technique”.
However, they did point out that there is still room
for improvement, because of a lack of clarity in the
modeling process. Furthermore, they pointed out
that knowing when the model is sufficiently correct
is not explicit. This sustains the relevance of
providing better business model design guidelines.
3 A DESIGN SCIENCE
APPROACH
In this study, we used the methodology put forward
in design science research by Gregor and Hevner
(2013). First, we explored how CAD can best
support business modeling. This was carried out
iteratively by building and evaluating prototypes.
We also focused on the evaluation of the perception
and performance of CAD business model design in
comparison with paper-based design. We used
existing artifacts such as the BMC and CABMD
tools. Our evaluation has one particularity in that we
chose to use a commercial instantiation of CABMD
software. However, we did propose a new artifact in
the form of guidelines, with the intention of making
better use of them. The evaluation of this artifact is
done by validity. Demonstrating that a coherent
business model case can be created by following the
guidelines.
4 TOOLS FOR BUSINESS
MODEL DESIGN
To help in the design of a BMC we put forward
guidelines, aimed at helping both the elicitation of
new elements and the testing of coherence. These
guidelines could then be transformed into actionable
rules for use inside a CABMD tool.
4.1 BMC as a Paper-based Artifact
The BMC uses nine building blocks to represent a
business model. These building blocks can be
further grouped into four perspectives, as shown in
table 1. The main perspective is the offer (what we
do), which connects the client perspective (who we
do it for) and the activity perspective (how we do it).
Business Model Design - An Evaluation of Paper-based and Computer-Aided Canvases
237
Finally,
(how m
u
The
importa
n
which
h
facilitat
e
drawn u
s
the offe
r
p
erspect
i
the acti
v
Ta
b
Perspe
c
Offer
Client
(right si
d
Activity
(left sid
e
Financi
a
The
r
elicitati
o
A
. D
i
Any eli
c
go throu
element
s
not har
n
its stren
from di
ff
the financial
u
ch?).
positioning
o
n
t. Visually,
t
h
elps to stru
c
e
comparison
s
s
ing this met
h
r
is in the c
e
i
ve and reve
n
v
ity perspecti
v
b
le 1 Business
M
c
tive Que
s
What
d
e)
Who
?
e
)
How
?
a
l How
r
e are three
o
n of business
iscover busin
e
c
itation techn
i
u
gh the nine b
l
s
as if it were
n
ess the full
p
n
gth lies in t
h
ff
erent blocks.
Fi
g
perspective
o
f these nin
e
t
hey form se
p
c
ture the tho
u
s
between th
e
h
od. As can b
e
e
ntre; to the
r
n
ue stream,
w
v
e and cost str
u
M
odel Canvas
s
tion Bui
l
? Val
u
?
Cust
Dist
r
Cust
?
Key
Key
Key
much? Rev
e
Cost
guidelines w
elements on
t
e
ss model ele
m
i
que is appli
c
l
ocks one aft
e
a checklist.
H
p
otential of t
h
h
e connecte
d
u
re 1: Busines
s
deals with p
e
blocks is
v
p
arate group
i
u
ght process
e
business m
o
e
seen in figu
r
r
ight is the c
l
w
hilst to the l
e
u
cture.
Components.
l
ding block
u
e proposition
o
mer segmen
t
r
ibution channel
o
mer relationsh
i
resources
activities
partnerships
e
nue stream
structure
h
ich help in
t
he BMC.
m
ents
c
able. Many
u
e
r another an
d
H
owever, this
d
h
e model, bec
a
n
ess of ele
m
s
Model Canva
s
p
rofit
very
i
ngs,
and
o
dels
r
e 1,
lient
e
ft is
l
s
i
ps
the
u
sers
d
add
d
oes
ause
m
ents
at
l
Ad
d
b
lo
c
vis
u
dis
p
ess
e
the
the
de
p
vis
u
5
w
gui
d
4.
2
Te
s
of
c
b
lo
c
gui
d
4.2
Th
e
un
d
s
of Zumba Fit
n
B. Improve b
A good BM
C
l
east one ot
h
d
itionally, th
e
c
k has to be
r
u
al appeara
n
p
laying only
e
ntial role i
n
connectedne
s
story of the
b
C. Highlight
By using bi
g
p
ict the flo
w
u
alize the sto
r
w
e use an
d
elines.
2
BMC
C
s
ting a BMC’
s
c
ontrol point
s
c
ks and co
n
d
elines for ea
c
.1 Guideli
n
Elemen
t
e
se guidelin
e
d
erstandable
B
There is
n
ess.
u
siness mode
l
C
has all of its
h
er; there are
e
number of
r
easonable so
n
ce. This
i
those elem
e
the busines
s
s
s between el
e
usiness mode
business mo
d
g
arrows on t
h
w
of interact
i
r
y of the busi
n
example to
oherence
G
s
coherence i
n
on three lev
e
n
nections.
W
c
h.
n
es Applyin
g
s help in
m
B
MC.
only one ide
a
l
through con
n
s
elements co
n
e
no orphan
elements in
s
as not to ov
e
i
s accompli
s
e
nts that pe
r
s
model. Fur
t
e
ments helps
e
l.
d
el mechanics
h
e top of th
e
i
on, it is p
o
i
ness model.
I
o
illustrate
t
G
uidelines
n
volves the v
e
els: elements
,
W
e propose
a
g
to Any In
d
m
aintaining
a
a
per sticky n
o
n
ections
n
nected to
elements.
s
ide each
e
rload the
s
hed by
r
form an
t
hermore,
in telling
BMC to
o
ssible to
I
n section
t
he three
e
rification
,
building
a
set of
d
ividual
visually
o
te.
Fourth International Symposium on Business Modeling and Software Design
238

Ideas are written with keywords, or
presented with a simple illustration.
The meaning of the element is
understandable by all stakeholders.
The element is a key component in
explaining the business model; indeed,
without it the business model cannot be
explained.
4.2.2 Guidelines Applying to Individual
Building Blocks
These guidelines help to identify the right amount of
detail for the BMC.
All nine building blocks of the model are
used, or have at least been considered.
Elements that are too detailed have been
grouped into a simpler element.
Elements that are too generic have been split
into more detailed elements.
The detail level of the elements are adequate
(there are not too many detailed elements,
nor to few which are too generic).
4.2.3 Guidelines Applying to Connections
between Elements in Different
Building Blocks
These guidelines help with the coherence of the
BMC.
Colors are used on elements to highlight
their connections according to the BMC’s
meta-model (Fritscher and Pigneur, 2010)
Each color is labeled and has a specific
meaning.
Client perspective is valid:
- Each customer segment is addressed by
one or more value proposition.
- A channel supports a value proposition-
customer segment set.
- If present, a customer relationship
targets a customer segment.
- In case of multiple customer segments,
colors distinguish each business side.
Activity perspective is valid:
- Each value proposition is
produced/delivered by a key activity, a
key partner or offers a key resource.
- Key resources or key partners support
an activity.
Financial perspective is valid:
- Revenue stream is generated from a
value proposition-customer segment set.
(A revenue stream can also be “free”).
- Major fixed costs are listed.
- Major variables costs are listed.
There are no orphan elements: all elements
are connected to another element (in a
different block to themselves).
4.3 BMC Computer-Aided Design
Multiple versions of BMC prototypes can be found,
as well as commercial versions. Research prototypes
emphasize advanced features; however, they lack
finesse in user experience. In order to make the best
comparison between a paper-based BMC and a
digital implementation, we chose to use Strategyzer,
a commercial version that is closest to the original
paper-based BMC. This commercial software
solution not only has a proven user-friendly
interface, it has the added advantage of being
inspired by the same original artifact ideas as our
research prototypes. Another benefit is that it has
calculation features which sit on top of the basic
functionality features, showing that integration is
possible without compromising the simplicity of the
user interface.
When Computer Aided Design (CAD) is applied
to the BMC, it can support elicitation by making it
easier to move, duplicate and rename elements.
Thanks to its digital properties, elements can also be
hidden and shown selectively, allowing for multiple
views of the same data. This enables the exploration
of business model variants, thereby further aiding
the elicitation process.
Beyond visual interactions, such software tools
can be used to support business model design with
features that are tailored to guarantee the coherence
of the meta-model on which they are built.
Guidelines can be transformed into rules, which can
then be tested by the tool. In case of incoherence, a
notification is shown on any invalid elements. Such
visual flags can, in addition, contain hints on how to
fix the problem or, at the very least, offer a reference
as to which rule or guideline was violated. The
computation is carried out automatically; thus, visual
flags appear as soon as something changes.
Guidelines allow a coherence score to be
attributed to each model; this score is based on the
number of fulfilled conditions.
4.3.1 Example Guideline Transformed into
Rules and Resolution Hints
Rule 1: There are not more than a specified number
(given by a threshold) of customer segment elements
with the same color.
Business Model Design - An Evaluation of Paper-based and Computer-Aided Canvases
239

Resolution Hint: Either merge elements that are too
detailed (building block guideline) or change colors
of element belonging to a different value proposition
to distinguish the segments (connection guideline).
Rule 2: A customer segment has to have a
corresponding value proposition element with the
same color as itself.
Resolution Hint: Create missing elements or add
right colors.
5 COMPARING COMPUTER-
AIDED DESIGN WITH PAPER-
BASED DESIGN
The focus of our evaluation is to compare a paper-
based BMC with one created using a computer-aided
design tool in terms of perception and performance.
In this section, we first present how we created a
business model for Zumba Fitness following our
guidelines. We then go on to present the
experimental setup, followed by the results and
statistics.
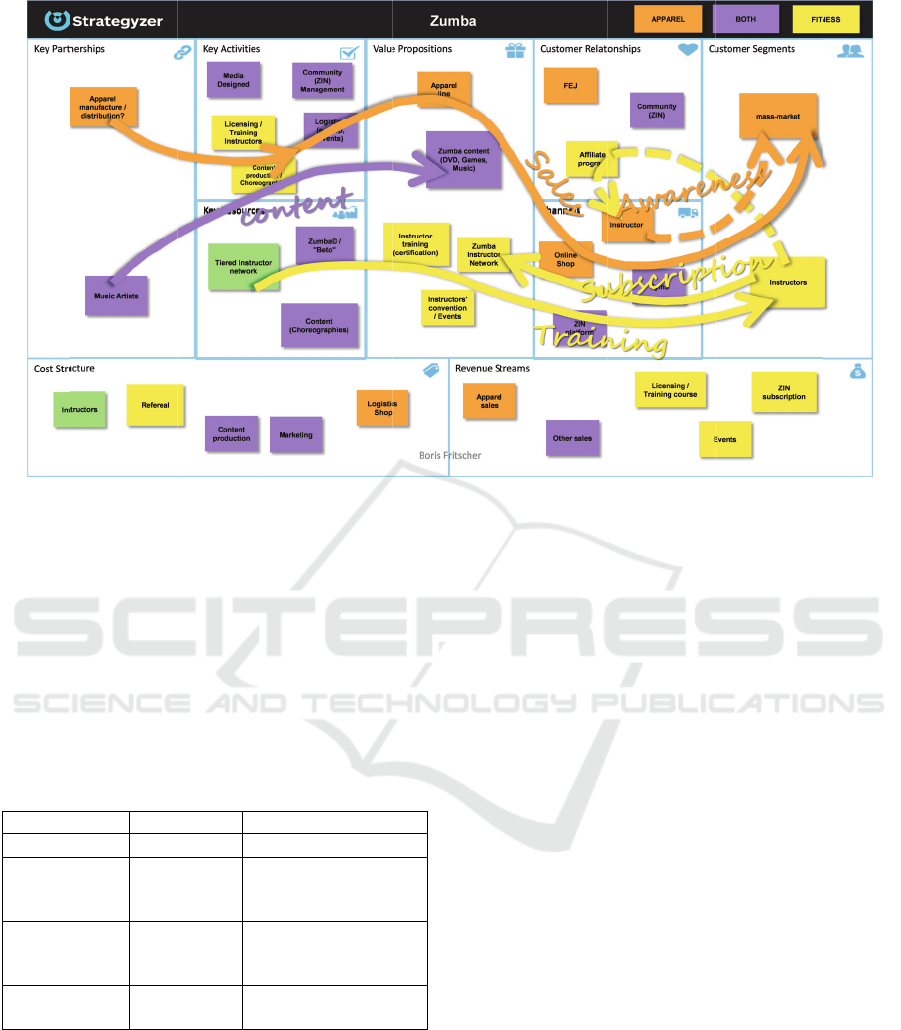
5.1 Zumba Fitness Business Model
This case is used to illustrate how to apply our
elicitation guidelines when designing the Zumba
Fitness business model using publicly available
information (as shown in figure 1). Zumba Fitness is
a company that offers fitness training to instructors
(yellow) and sells fitness apparel (orange) to the
mass market. Separate colors were used for each
type of offering. Elements that are affected by both
value propositions are shown in violet.
A. Discover Business Model Elements
The discovery of elements, which can be added to
any of the building blocks, can come from internal
knowledge, interview, observation or indeed any
kind of research method. However, it is crucial to
move from one idea to the next without limiting
oneself to one block at a time. Our main source of
information for this case study was a six-page report
by Inc magazine
2
and a video interview featuring
one of the company’s founders.
As should be the case for any presentation of the
BMC, we will first present the elements as a story,
instead of going through the blocks one at a time.
2
http://www.inc.com/magazine/201212/leigh-buchanan/
zumba-fitness-company-of-the-year-2012.html
Zumba Fitness offers Instructor training to the
instructors customer segment with the help of their
online ZIN platform and gyms. Giving courses
generates licensing/training revenues. A second
revenue stream from instructors is a subscription to
the ZIN network. This offer (value proposition) gives
the instructors access to new Zumba content which
they can use in their own Zumba classes. To provide
the aforementioned value propositions, a number of
key activities have to be performed, including
training, ZIN community management and creation
of new content (choreography).
Another customer segment is the mass market,
namely, people who buy apparel from the online
shop, thus generating sales revenue.
B. Improve Business Model through Connections
With any BMC, it is important to check the
connections between the elements. This helps to
identify any missing elements. It can also lead us to
question the validity of elements if no connection to
other elements can be found.
Continuing with our example, although fitness
apparel is sold, its source is missing. Therefore, for
coherence, manufacturing & distribution partners
had to be added, as well as a logistics and media
design activity, and the cost structure of a logistics
shop.
The content creation activity produces new
choreographies, not only as a value proposition, but
also as a new resource. However, to produce such
choreographies, the company also needed music
artists; these become a new partner element. The
creation of content (content production) is also a
major cost in the business model. An additional
resource, which gives value to their content, is the
Zumba brand name.
C. Highlight Business Model Mechanics
Business Model mechanics help to visually illustrate
major interactions between elements on the BMC.
The flow of the interaction is depicted by large
arrows, which connect the elements. Thinking about
the mechanics and the story behind it will help
reveal additional element interaction, which may not
emerge when looking only at individual elements.
This case is particularly interesting, because a
series of mechanics helps to reveal that instructors
are also a channel. Zumba starts by
training/certifying instructors; a major percentage of
these instructors will then subscribe to the Zumba
Instructor Network. A certified instructor goes on to
give Zumba courses and naturally starts to promote
Fourth International Symposium on Business Modeling and Software Design
240
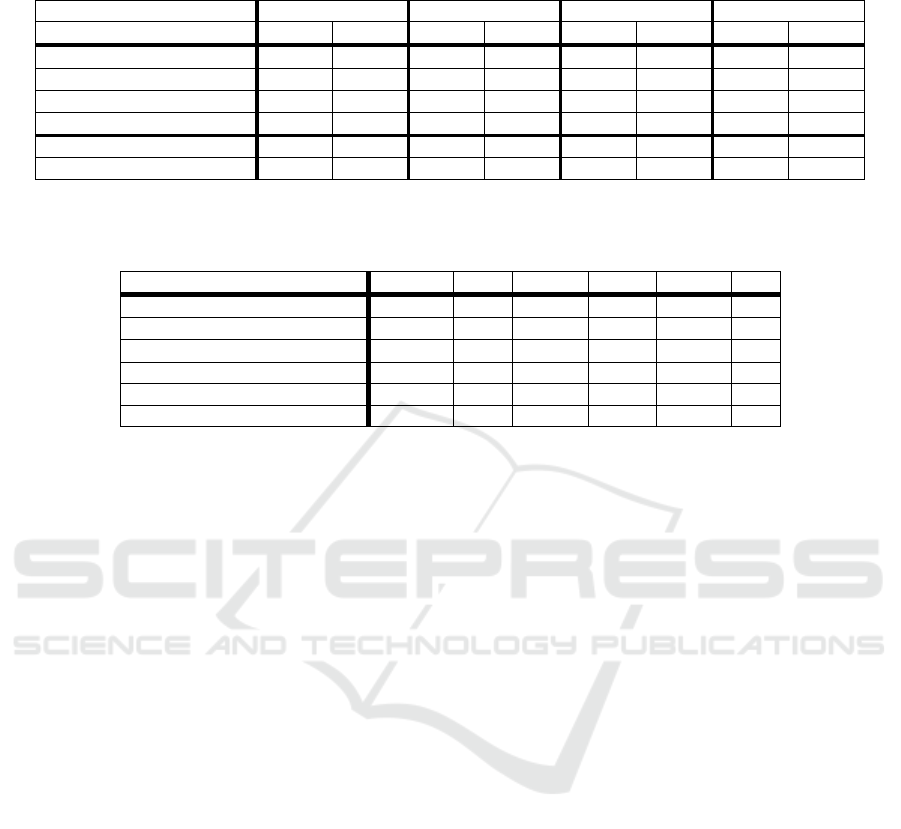
Table 2: Descriptive statistics.
Variable Mean Std. Dev. Min Max
Tool
P S P S P S P S
Perceived Usefulness 2.38 1.83 0.98 0.69 1.25 1.00 5.00 3.50
Perceived Ease of Use 2.36 1.80 1.13 0.73 1.00 1.00 6.00 4.00
Task Outcome 2.27 1.85 0.80 0.72 1.00 1.00 4.33 3.33
Task Innovation 2.17 2.79 0.73 1.10 1.00 1.00 3.00 4.67
Total Elements 23.00 28.82 5.75 6.91 11.00 20.00 32.00 42.00
Correct Elements 16.81 15.64 2.62 3.91 13.00 11.00 20.00 25.00
P: Paper (21 observations), S: Strategyzer software (22 observations)
Table 3: Pearson's correlation between concepts.
PU PEU TO TI TE CE
Perceived Usefulness [PU] 1.00
Perceived Ease of Use [PEU] 0.54*** 1.00
Perceived Task Outcome [TO] 0.27 1.00
Perceived Task Innovation [TI] 0.39** 1.00
Total Elements [TE] -0.28 -0.26 1.00
Correct Elements [CE] -0.32* 0.43** 1.0
P>|t| *** 0.001, ** 0.01, * 0.05
the brand and its apparel. To build on this
phenomenon, Zumba offers them an affiliate
program (customer relationship). Thus, through
awareness generation, instructors become a channel
to the mass market. This supports the second
mechanic, which is the sale of fitness apparel
through the online shop. The third mechanic can be
found backstage, in the form of generating content.
Having added instructor as a channel and an
affiliate program, it is then necessary to check again
for any connections. In turn, this reveals that, to
retain coherence, a referral fee has to be added to the
cost structure. This demonstrates the need to iterate
through the mentioned techniques and guidelines
until everything is in a stable and coherent state.
5.2 Experiment Setup
Our experiment was aimed at designing a business
model for the Zumba case using an article and a
video interview as information resources. The
evaluation was performed during a business model
course attended by students from a master’s program
in IS. The students were all familiar to a similar
level with the BMC method and web tool. A total of
43 students participated. They were split into 22
groups in order to have the most groups possible and
avoid students having to do the task individually.
Having teams of two people is a key component of
generating creative ideas (Paulus 2000) and
corresponds better to the normal use of the BMC.
Half of the groups were asked to do the design
task using a paper-based BMC. The others used the
chosen computer-aided business model design
software and were not allowed to use paper at all.
Evaluation of the task was carried out in two
parts. First, when a group considered their work to
be complete, each student was asked to individually
fill out a questionnaire to assess their perception of
the task. Second, all BMCs were collected and
evaluated to assess the performance of the groups’
designs.
5.3 Results and Statistics
In this section, we present our measures of
perception and performance, followed by their
statistical analysis.
5.3.1 Measurement of Perception
For the questionnaire we decided to use questions
and scales taken from existing literature (see
appendix for the full question list). The concepts of
perceived usefulness and perceived ease of use were
adopted from TAM (Davis 1989). However, we
simplified the questionnaire, reducing the number of
questions by removing those with similar meanings,
to avoid confusion amongst our non-native English
speakers.
A measure of the perceived task outcome was
added so that we could test whether there is a
difference in perception between the two medias. In
Business Model Design - An Evaluation of Paper-based and Computer-Aided Canvases
241
addition, this allowed us to make a comparison with
the real outcome performance metric. The task
outcome was adapted from Briggs et al. (2006).
Here, we selected items from their meeting outcome
and meeting process questions.
We were also interested in how media type
impacts our perception of being able to generate
ideas. For task innovation we used questions taken
from (Torkzadeh and Doll, 1999).
All answers have a seven-point likert scale,
which we coded from 1 (best) to 7 (worst).
In order to analyse the concept, for each question
we grouped the answer variables of each metric into
a usable concept (latent variables) using Cronbach's
alpha. The perceived usefulness concept is well
defined by its four questions with an alpha of 0.75.
For the perceived ease of use, we dropped question
number 2.3 to get a better alpha of 0.71. For the task
outcome concept we had to drop question 4.3 to get
an acceptable alpha of 0.75. The task innovation
concept is well described by its three questions with
an alpha of 0.92.
5.3.2 Measurement of Performance
The designed business model’s performance was
computed by comparing it with the solution
developed by two experts who followed the
techniques and guidelines presented in the artifact
section. A total of 28 points could be achieved for
the Correct Element measure. The comparison
points were not all a direct match; if an element was
similar in meaning to the solution, it was also
accepted. There were no negative points for
additional elements and the same evaluator corrected
all of the BMCs. We also took into consideration the
metric of the Total Elements in order to measure any
differences in quantity generation between the
media.
5.3.3 Descriptive Statistics of Results
As can be seen in table 2, answers are skewed
positively, with a low average score for all the
perception constructs. This indicates that overall the
students had a very positive perception of the BMC,
irrespective of the type. The computer-aided canvas
was marginally better than the paper-based canvas
on all the perception measures, except for task
innovation. It also helped to generate more elements.
Correct elements are very similar for both types.
Element metrics of the computer-aided canvas
showed the greatest deviation, with both the best and
the worst number of correct elements.
5.3.4 Statistical Analysis of Concepts
We used the Stata 12 software package to perform
our statistical analysis. After verifying the concept’s
alpha values we looked at the Pearson correlation
between them. The matrix, which can be seen in
table 3, helped us select the concepts that warranted
further analysis with regressions to determine the
impact of the type of media used.
The strongest correlation is between usefulness
and ease of use, which matches TAM’s theory. The
correlation between the total elements and correct
elements also seems natural. We did not penalize
wrong elements, therefore the more there are, the
greater the possibility of also having correct ones. Of
particular interest is the correlation between task
innovation and task outcome, and between task
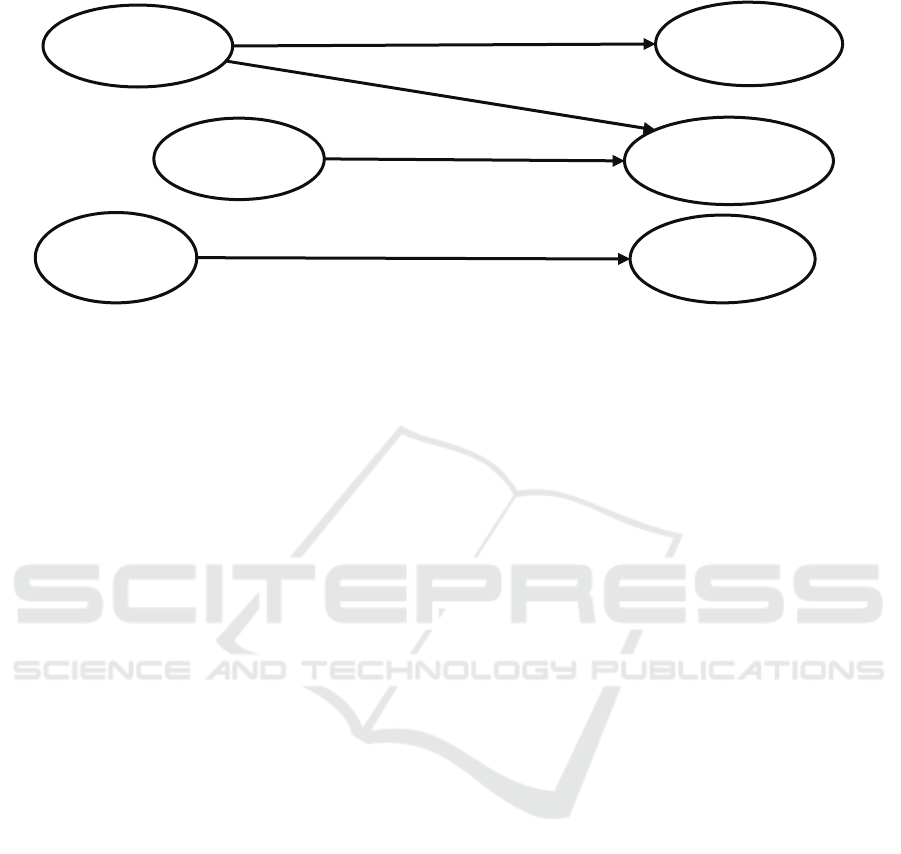
Perceived
Innovation
Perceived
Ease of
Perceived
Usefulness
Total
Elements
Perceived
Outcome
Correct
Elements
P>|t| *** 0.01, ** 0.01, * 0.05
T
yp
e S: contribution of CAD
0.43***
R: 0.33
Type S: -0.68***
0.44**
R: 0.32
Type S: -
0.30**
R: 0.34
Type S: -2.92***
-1.13*
R: 0.10
Type S: -
R: 0.10
Type S: -0.55*
R: 0.10
Type S: 0.61*
R: 0.17
Type S: 5.8**
Figure 2: regressions between concepts.
Fourth International Symposium on Business Modeling and Software Design
242

innovation and correct elements, which represents
the real outcome. We explore these relations further
in the discussion.
6 LESSONS FROM THE
COMPARISON
A regression analysis was used on the variables for
which correlations stood out. The results are shown
in figure 2. Only links with significant regression
results are shown. Type S is the contribution of
using the computer-aided software BMC over the
paper-based BMC. As already observed, with the
mean values, perceived innovation is slightly better
with the paper-based BMC, but the R-square value is
only 0.10. On the other hand, perceived innovation
strongly predicts perceived outcome. Users of the
digital BMC perceived that it helped them do a
better job more than did the users of the paper-based
BMC. Perceived innovation slightly predicts real
outcome (correct elements), without a difference
between types.
On its own, perceived usefulness is seen as being
better with the digital tool. This could be a bias of
the population of IS students who are familiar with
IT technology and might prefer a technical solution
to one that uses paper.
There is no significant difference between the
type that affected the influence of perceived ease of
use over perceived usefulness. This can be seen as a
positive result for the software tools, because it does
not perform better or worse. Having at least the
same ease of use as paper is a key result, which
should be reflected upon when considering that the
digital tool has the potential of offering additional
features, providing usefulness that is not possible on
paper.
The computer-aided BMC helps to generate
more elements than a paper-based one; however, it
also has a negative influence on the number of
correct elements. It is easier to generate more
elements, but also to generate more wrong elements.
Users who think that the digital tool helps them
innovate, think they have performed better;
however, in our small setup they obtained similar
numbers of correct elements.
In addition to the statistical analysis, we also
observed how the teams worked during the design
task. One observation that is of particular interest
relates to the process of eliciting elements. On the
paper-based BMC, a discussion first occurs and then
a sticky note element is created and positioned. On
the computer-aided BMC, however, which also
supports collaboration, elements are added first by
each member and then changed to reflect the
consensus. This is interesting because recording the
decision inside the tool means that it can be utilized
to better support the ongoing business modeling
collaboration process.
Three weeks after the first task, we carried out a
trial experiment with the coherence guidelines using
paper. The results were varied and inconclusive,
although users did say it helped them improve their
model. Problems arose when attempting to test them
on paper. In this situation, users have to perform the
checks manually; in some instances, they do not take
the time to iteratively do it as soon as they change
something. Therefore we posit that although we
showed that guidelines can be used to create
coherent models on paper, it is more appropriate for
such guidelines to be implemented and tested inside
a prototype tool. Here, they can be recomputed each
time a change is detected.
In summary, in our experiment with our test
group, the tested CAD tool was as effective as
paper-based design for the creation of business
models in terms of eliciting elements of the BMC.
This indicates that with the help of rules, it might be
better suited for testing the coherence of business
models than paper-based design.
7 CONCLUSIONS
To assist BMC design using software tools, we
proposed guidelines that help with elicitation and
testing in order to produce coherent models. Before
implementing such features in a digital tool we
needed to confirm that perception and performance
on a basic BMC design task are at least similar to
those of a paper-based design. With our evaluation
we found that the tested digital tools can be
perceived as useful, and does not perform any worse
than its paper-based alternative. Even if CABMD
did not outperform paper-based design, it shows
some promising results, because such tools can be
extended to offer additional features, thus increasing
their usefulness. Features that are much better suited
for digital tools include the continuous reviewing of
coherence rules to check their validity.
In this paper, we focused on modeling an
existing “as-is”, business model. Further research is
needed to explore options that may enable the
exploration of future “to-be”, business models. For
example, rules could be extended to simulate
financial assumption or validate regulatory
constraints.
Business Model Design - An Evaluation of Paper-based and Computer-Aided Canvases
243

REFERENCES
Briggs, R. O., Reinig, B. A., & de Vreede, G. J. (2006).
Meeting Satisfaction for Technology-Supported
Groups an Empirical Validation of a Goal-Attainment
Model. Small Group Research, 37(6), 585-611.
Davis, F. D. (1989). Perceived usefulness, perceived ease
of use, and user acceptance of information technology.
MIS quarterly, 319-340.
Fritscher, B., & Pigneur, Y. (2010). Supporting Business
Model Modelling: A Compromise between Creativity
and Constraints. Task Models and Diagrams for User
Interface, (LNCS 5963), 28–43.
Gregor, S., & Hevner, A. R. (2013). Positioning and
Presenting Design Science Research for Maximum
Impact. MIS Quarterly, 37(2).
Hoffmann, F., Eppler, M. J., & Bresciani, S. (2012).
Business Model Ideation: An Experimental Approach
for the Evaluation of Team-based Methods. 12th
EURAM 2012 European School of Management
Lucassen, G., Brinkkemper, S., Jansen, S., & Handoyo, E.
(2012). Comparison of visual business modeling
techniques for software companies. In Software
Business (pp. 79-93). Springer Berlin Heidelberg.
Osterwalder, A., & Pigneur, Y. (2010). Business model
generation: a handbook for visionaries, game
changers, and challengers. John Wiley & Sons.
Osterwalder, A., & Pigneur, Y. (2013). Designing
Business Models and Similar Strategic Objects: The
Contribution of IS. Journal of the Association for
Information Systems, 14.
Paulus, P. (2000). Groups, Teams, and Creativity: The
Creative Potential of Idea-generating Groups. Applied
psychology, 49(2), 237-262.
Reinig, B. A. (2003). Toward an understanding of
satisfaction with the process and outcomes of
teamwork. Journal of Management Information
Systems, 19(4), 65-84.
Torkzadeh, G., & Doll, W. J. (1999). The development of
a tool for measuring the perceived impact of
information technology on work. Omega, 27(3), 327-
339.
APPENDIX
The following questionnaire was used for our
survey, either using Strategyzer or the paper canvas
as subject.
Based on your short experience with Strategyzer,
how would you rate the following statements when
thinking about using Strategyzer for future Business
Model Design Tasks?
The following seven point Likert scale was used:
extremely likely (1), quite likely (2), slightly likely
(3), neither (4), slightly unlikely (5), quite unlikely
(6) extremely unlikely (7)
1 Perceived Usefulness
1.1 Using Strategyzer to design business model
would enable me to accomplish the task
more quickl
y
.
1.2 Using Strategyzer would improve my
p
erformance in desi
g
nin
g
business models.
1.3 Using Strategyer would make it easier to
desi
g
n business models.
1.4 I would find Strategyzer useful fo
r
desi
g
nin
g
b
usiness models.
2 Perceived Ease of Use
2.1 Learning to operate Strategyzer to design
b
usiness models would be eas
y
for me.
2.2 I would find it easy to get Strategyzer to do
what I want it to do.
2.3 It would be easy for me to become skillful
at using Strategyzer to design business
models.
The following seven point Likert scale was used
for the next two sections: strongly agree (1), agree
somewhat (2), agree (3), neither (4), somewhat
disagree (5), disagree (6), strongly disagree (7)
Now evaluate your business model design task.
3 Task Outcome
3.1 I feel satisfied with the designed business
model.
3.2 I feel satisfied with the process used to
desi
g
n the business model.
3.3 With more time I could substantially
improve the desi
g
ned business model.
3.4 I had enou
g
h time to complete the task.
4 Task Innovation
4.1 Strategyzer helps me create new ideas.
4.2 Strategyzer helps me come up with new
ideas.
4.3 Strategyzer helps me try out innovative
ideas.
Fourth International Symposium on Business Modeling and Software Design
244
