
Artificial Intelligence Neural Networks Applications in Forecasting
Financial Markets and Stock Prices
Veselin L. Shahpazov, Lyubka A. Doukovska and Dimitar N. Karastoyanov
Institute of Information and Communication Technologies, Bulgarian Academy of Sciences,
Acad. G. Bonchev str., bl. 2, 1113 Sofia, Bulgaria
veselin_georgiev@abv.bg, doukovska@iit.bas.bg, dkarast@iinf.bas.bg
Keywords: Artificial Neural Network, Business, Predicting Stock Prices, Review, Historic Development.
Abstract: The interest in using artificial neural networks (ANN’s) for forecasting has led to a tremendous surge in
research activities over time. Artificial Neural Networks are flexible computing frameworks and universal
approximators that can be applied to a wide range of time series forecasting problems with a high degree of
accuracy. Forecasting problems arise in so many different disciplines and the literature on forecasting using
ANN’s is scattered in so many diverse fields that it is hard for a researcher to be aware of all the work done
to date in the area. There is an extensive literature in financial applications of ANN’s. Naturally forecasting
stock price or financial markets has attracted considerable interest and it has been one of the biggest
challenges. This paper reviews the history of the application of artificial neural networks for forecasting
future stock prices. From the introduction of the back-propagation algorithm in 1980’s for training an MLP
neural network by Werbos, who used this technique to train a neural network and claimed that neural
networks are better than regression methods and Box-Jenkins model in prediction problems through the
application of such technics to financial markets forecasting by pioneers in the field like White, Kimoto and
Kamijo to the more recent studies of stocks prices in not only the biggest capital markets but also in some
emerging and illiquid markets, we will look at the progress made in the past more than twenty five years of
research.
1 INTRODUCTION
It is nowadays a common notion that vast amounts
of capital are traded through the stock markets all
around the world. National economies are strongly
linked and heavily influenced from the performance
of their stock markets. Moreover, recently the
markets have become a more accessible investment
tool, not only for strategic investors but for common
people as well. Consequently they are not only
related to macroeconomic parameters, but they
influence everyday life in a more direct way.
Therefore, they constitute a mechanism which has
important and direct social impacts.
The characteristic that all stock markets have in
common is the uncertainty, which is related with
their short and long-term future state. This feature is
undesirable for the investor but it is also unavoidable
whenever the Stock Market is selected as the
investment tool. The best that one can do is to try to
reduce this uncertainty. The Stock Market prediction
task divides researchers and academics into two
groups those who believe that we can devise
mechanisms to predict the market and those who
believe that the market is efficient and whenever
new information comes up the market absorbs it by
correcting itself, thus there is no space for prediction
(EMH). Furthermore they believe that the Stock
Market follows a Random Walk, which implies that
the best prediction you can have about tomorrow’s
value is today’s value.
In literature a number of different methods have
been applied in order to predict Stock Market
returns. These methods can be grouped in four major
categories: 1) Technical Analysis Methods,
2) Fundamental Analysis Methods, 3) Traditional
Time Series Forecasting and 4) Machine Learning
Methods. Technical analysts, known as chartists,
attempt to predict the market by tracing patterns that
come from the study of charts which describe
historic data of the market. Fundamental analysts
study the intrinsic value of an stock and they invest
on it if they estimate that its current value is lower
that it’s intrinsic value. In Traditional Time Series
282
L. Shahpazov V., Doukovska L. and Karastoyanov D.
Artificial Intelligence Neural Networks Applications in Forecasting Financial Markets and Stock Prices.
DOI: 10.5220/0005427202820288
In Proceedings of the Fourth International Symposium on Business Modeling and Software Design (BMSD 2014), pages 282-288
ISBN: 978-989-758-032-1
Copyright
c
2014 by SCITEPRESS – Science and Technology Publications, Lda. All rights reserved
forecasting an attempt to create linear prediction
models to trace patterns in historic data takes place.
These linear models are divided in two categories:
the univariate and the multivariate regression
models, depending on whether they use one of more
variables to approximate the Stock Market time
series. Finally a number of methods have been
developed under the common label Machine
Learning these methods use a set of samples and try
to trace patterns in it (linear or non-linear) in order
to approximate the underlying function that
generated the data. The aim is to draw conclusions
from these samples in such way that when unseen
data are presented to a model it is possible to infer
the to-be explained variable from these data. These
methods have been applied to market prediction;
particularly for Neural Networks there is a rich
literature related to the forecast of the market on
daily basis.
2 AN OVERVIEW
OF ARTIFICIAL NEURAL
NETWORKS
The most commonly used forecasting network
structure of ANN’s is the multi-layer feed forward
network brain particularly, are composed of a num-
ber of interconnected simple processing elements
called neurons or nodes. Each node receives an input
signal which is the total “information” from other
nodes or external stimuli, processes it locally
through an activation or transfer function and
produces a transformed output signal to other nodes
or external outputs. Although each individual neuron
implements its function rather slowly and im-
perfectly, collectively a network can perform a
surprising number of tasks quite efficiently. This
information processing characteristic makes ANNs a
powerful computational device and able to learn
from examples and then to generalize to examples
never before seen.
A number of different ANN models have been
proposed. Perhaps the most influential models are
the multi-layer perceptrons (MLP), Hopfield
networks, and Kohonen’s self-organizing networks.
Other popular network structures are radial-basis
functions networks, ridge polynomial networks, and
wavelet networks.
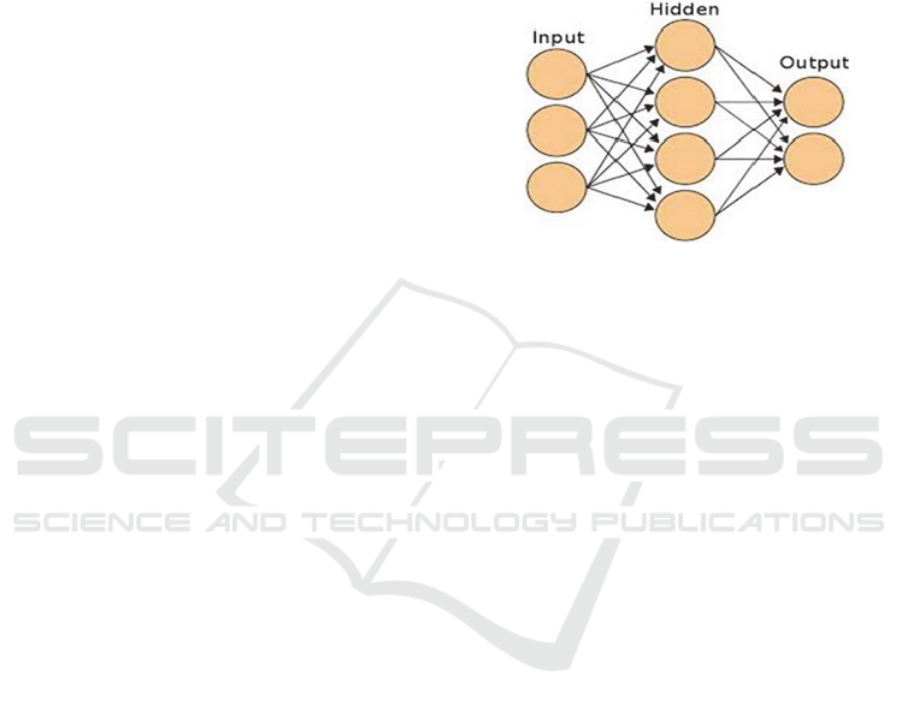
An MLP is typically composed of several layers
of nodes. The first or the lowest layer is an input
layer where external information is received. The
last or the highest layer is an output layer where the
problem solution is obtained. The input layer and
output layer are separated by one or more
intermediate layers called the hidden layers. The
nodes in adjacent layers are usually fully connected
by acyclic arcs from a lower layer to a higher layer.
Figure 1 gives an example of a fully connected MLP
with one hidden layer.
Figure 1: Example of a fully connected MLP.
For an explanatory or causal forecasting problem,
the inputs to an ANN are usually the independent or
predictor variables. The functional relationship,
estimated by the ANN, can be written as:
y = f(x
1
, x
2
, …, x
p
) (1)
where x
1
, x
2
, …, x
p
are p independent variables and y
is a dependent variable. In this sense, the neural
network is functionally equivalent to a nonlinear
regression model. On the other hand, for an extra-
polative or time series forecasting problem, the
inputs are typically the past observations of the data
series and the output is the future value. The ANN
performs the following function mapping:
y
t+1
= f(y
t
, y
t –1
,…, y
t –
p
) (2)
where y
t
is the observation at time t. Thus, the ANN
is equivalent to the nonlinear autoregressive model
for time series forecasting problems. It is also easy
to incorporate both predictor variables and time-
lagged observations into one ANN model, which
amounts to the general transfer function model.
Before an ANN can be used to perform any
desired task, it must be trained to do so. Basically
training is the process of determining the arc weights
which are the key elements of an ANN. The
knowledge learned by a network is stored in the arcs
and nodes in the form of arc weights and node
biases. It is through the linking arcs that an ANN can
carry out complex nonlinear mappings from its input
nodes to its output nodes.
Artificial Intelligence Neural Networks Applications in Forecasting Financial Markets and Stock Prices
283

3 ANN APPLICATIONS
AS FORECASTING TOOLS
Forecasting problems arise in so many different
disciplines and the literature on forecasting using
ANNs is scattered in so many diverse fields that it is
hard for a researcher to be aware of all the work
done to date in the area. One of the first successful
applications of ANNs in forecasting is reported by
Lapedes and Farber. Using two deterministic chaotic
time series generated by the logistic map and the
Glass Mackey equation, they designed the feed-
forward neural networks that can accurately mimic
and predict such dynamic nonlinear systems. Their
results show that ANNs can be used for modelling
and forecasting nonlinear time series with very high
accuracy. After that a number of papers were
devoted to using ANNs to analyse and predict
deterministic chaotic time series with and/or without
noise. Chaotic time series occur mostly in engine-
ering and physical science since most physical
phenomena are generated by nonlinear chaotic
systems. As a result, many authors in the chaotic
time series modelling and forecasting are from the
field of physics.
There is an extensive literature in financial
applications of ANNs. ANNs have been used for
forecasting bankruptcy and business failure, foreign
exchange rate, stock prices off course. Another
major application of neural network forecasting is in
electric load consumption study.
Many other forecasting problems have been
solved by ANNs. A short list includes airborne
pollen commodity prices, environmental tempera-
ture; helicopter component loads international airline
passenger traffic macroeconomic indices, ozone
level, personnel inventory, rainfall, river flow, stu-
dent grade point averages, tool life, total industrial
production, transportation, and wind pressure and
wind pressure and many more.
4 ANN AND STOCK MARKET
FORECASTING
The idea of using neural networks for predicting
problems was first expressed in (Hu, 1964) which
was used for weather forecasting. The absence of
any learning method for multi-layer networks made
it impossible to apply these networks to complex
prediction problems. But in 1980’s the back-
propagation algorithm was introduced for training an
MLP neural network. Werbos used this technique to
train a neural network (Werbos, 1988) and claimed
that neural networks are better than regression
methods and Box-Jenkins model in prediction
problems.
In recent years so many researches have been
done on neural networks to predict the financial
markets and the stock market changes in particular.
Probably the first paper in the vast field, at least
from today’s perspective of stock market prediction
with ANN’s is (White, 1988), in which the main
focus is to try to prove wrong the Efficient Market
Hypothesis. In its simplest form, this hypothesis
asserts that asset prices follow a random walk that is,
the movement of an asset's price is completely
unpredictable from publicly available information
such as the price and volume history for the asset
itself or that of any other asset.
One of the first efforts was by Kimoto and his
colleagues in which they used neural networks to
predict the index of Tokyo stock market (Kimoto
et al., 1990). They used several neural networks
trained to learn the relationships between past values
of various technical and economic indices for
obtaining the expected returns of the TOPIX. The
TOPIX is a weighted average of all stocks listed on
the Tokyo Stock Exchange. The used technical and
economic indices are: the vector curve (an indicator
of market momentum), turnover, interest rate,
foreign exchange rate and the value of the DJIA
(Dow Jones Industrial Average). The desired output
of the networks is a weighted sum, few weeks, of the
logarithm of the ratio of the TOPIX at the end of
week t to the TOPIX value at the end of week (t – 1)
and the desired output is a weighted sum of r
t
for
some weeks. The future extraction is not explained
in this paper, except for the fact that some irregul-
arity is removed and logarithm function is used
before normalization.
In (Kamijo, Tanigawa, 1990) is proposed the use
of “Elman recurrent net” (recurrent neural network
is class of neural network, where connections
between units form a directed cycle. This creates an
internal state of the network which allows it to
exhibit dynamic temporal behaviour) for predicting
the future stock prices using extracted features from
past daily high, low and closing stock prices. Unlike
feed-forward neural networks, RNNs can use their
internal memory to process arbitrary sequences of
inputs. The method used tries to extract triangle
patterns in stock prices which are seen on the daily
high, low and closing graph. A triangle is usually
seen as a beginning of a sudden stock price rise after
that the high and low prices appear and the price
oscillates for a period of time before the lines
Fourth International Symposium on Business Modeling and Software Design
284

converge. The ANN is trained to recognize this
pattern in the stock prices.
Matsuba uses a feed-forward NN with the last n
stock index values as inputs and the next N – n
values as the outputs (Matsuba, 1991). This is an
N – n step ahead prediction. Thus, if the index for
the n
-th
day is denoted by X
n
then, the inputs are X
1
,
X
2
, …, X
n
and the outputs are X
n+1
, X
n+2
, …, X
N
.
If such a network is trained, any correlation between
the index values for n + 1 through N
-th
day will be
neglected. To ensure that this does not happen, the
network is trained with errors between the desired
and actual outputs in addition to the n inputs.
These errors will then be X
n – 1
– Y
n+1
, …, where Y is
the output of the network. As the training proceeds
this error will tend to zero and these additional
inputs are not required in the testing phase.
In his work Freisleben used a simple feed-
forward NN trained using past and present data to
predict the value of the FAZ Index (Freisleben,
1992). Input data includes the moving average of
past 5 and 10 weeks of the FAZ Index a first order
difference of the FAZ Index and its moving average,
the present bond market index and its first order
difference and the Dollar-Mark exchange rate along
with its first order difference. The value of the FAZ
Index is predicted for the next week based on this
data. The neural network is trained for the past
M weeks and is then tested based on data for the
next L weeks, where M is called the training window
and L is called the testing window. For every
successive prediction, the windows are shifted ahead
and the network is retrained.
In (Azoff, 1994) is outlined that networks are
computer program that can recognize patterns in
data, learn from this and make forecasts of future
patterns. At the time, there were just over 20
commercially available neural network programs
designed for use on financial markets and there have
been some notable reports of their successful
application. However, like any other computer
program, neural networks are only as good as the
data they are given and the questions that are asked
of them. Proper use of a neural network involves
spending time understanding and cleaning the data:
removing errors, pre-processing and post-pro-
cessing. His book provides the knowledge that is
required for the proper design and use of ANN’s in
financial markets forecasting – with an emphasis on
futures trading.
In (Kaastra, Boyd, 1995) is provided a practical,
non-technical introduction to designing a neural
network forecasting model using economic time
series data (16). The procedure of designing a model
is divided into eight steps: 1) variable selection; 2)
data collection; 3) data pre-processing; 4) training,
testing and validation sets; 5) neural network
paradigms; 6) evaluation criteria; 7) neural network
training; and 8) implementation. Three major
conclusions are made, the first being that researchers
must have the time resources and patience to
experiment mainly because of the nature financial
markets. The second is that NN software must allow
automated routines such as walk-forward testing,
optimization of hidden neurons and testing of input
variable combinations, either through direct
programming or the use of batch or script files. And
third the researcher must maintain a good set of
records that list all parameters for each network
tested since any parameter may turn out to cause a
significant change in neural network performance.
In (Leung, Daouk, Chen, 2000) is conducted a
research which focuses on estimating the level of
return on stock market index. Given the notion that a
prediction with little forecast error does not
necessarily translate into capital gain, they evaluate
the efficacy of several multivariate classification
techniques relative to a group of level estimation
approaches. Among the level estimation counter-
parts, which forecast the level, are exponential
smoothing are the multilayered feed-forward neural
network and a probabilistic neural network.
With the introduction of electronic communic-
ation networks (ECN) as electronic trading systems
facilitating trading of stocks and other financial
products in the world’s leading stock exchanges at
first and later on other non-mainstream stock
markets, and the constantly growing interest by both
retail and institutional investors all around the world
in stock’s investing, the research in this field
exploded. The advancement in computational and
communicational power allowed researchers to
develop models using artificial neural networks that
are fed with real time data and capable to produce
real time buy and sell signals.
In (Pan, Tilakaratne, Yearwood, 2005) is
presented a computational approach for predicting
the Australian stock market index – AORD using
multi-layer feed-forward neural networks from the
time series data of AORD and various interrelated
markets. This effort aims to discover an effective
neural network or a set of adaptive neural networks
for this prediction purpose, which can exploit or
model various dynamical swings and inter-market
influences discovered from professional technical
analysis and quantitative analysis.
Kalyvas attempts to predict the daily excess
returns of FTSE 500 and S&P 500 indices over the
Artificial Intelligence Neural Networks Applications in Forecasting Financial Markets and Stock Prices
285

respective Treasury Bill rate returns (Kalyvas,
2001). Then the author applies two different types of
prediction models: Autoregressive (AR) and feed-
forward Neural Networks (NN) to predict the excess
returns time series using lagged values. For the NN
models a Genetic Algorithm is constructed in order
to choose the optimum topology. Data consists of
3275 daily observations of FTSE-100 index, UK
T-Bill Rates and 3277 observations of S&P-500
index and US T-Bill Rates from 4 Jan 1988 until 12
Dec 2000. Finally he evaluates the prediction
models on four different metrics and concludes that
they do not manage to outperform significantly the
prediction abilities of naive predictors.
In their study (Chen, Leung, Daouk, 2003) the
authors attempt to model and predict the direction of
market index of the Taiwan Stock Exchange, one of
the fastest growing financial exchanges in the
developing Asian countries (considered an emerging
market). The probabilistic neural network (PNN) is
used to forecast the direction of index return after it
is trained by historical data. Statistical performance
of the PNN forecasts are measured and compared
with that of the generalized methods of moments
(GMM) with Kalman filter. Moreover, the forecasts
are applied to various index trading strategies, of
which the performances are compared with those
generated by the buy-and-hold strategy as well as
the investment strategies guided by forecasts
estimated by the random walk model and the
parametric GMM models. They conclude that
empirical results show that the PNN-based
investment strategies obtain higher returns than
other investment strategies examined in this study.
In (Kim, Lee, 2004) is compared a feature
transformation method using genetic algorithm with
two conventional methods for artificial neural
networks. The genetic algorithm is incorporated to
improve the learning and generalization abilities of
ANN’s for stock market prediction. Daily
predictions are conducted and their accuracy is
measured. The authors use the proposed model to
predict South Korea composite stock price index
(KOSPI). The comparison of the results achieved by
a feature transformation method using a genetic
algorithm to other feature transformation methods
shows that the proposed model performs better.
Experimental results show that the proposed model
reduces the dimensionality of the feature space and
decreases irrelevant factors for stock market
predictions.
In (Kim, 2006) is proposed a genetic algorithm
approach to instance selection in artificial neural
networks for financial data mining. He notes that
artificial neural networks have preeminent learning
ability, but often exhibit inconsistent and unpredict-
able performance for noisy data. In addition, it may
not be possible to train ANN’s or the training task
cannot be effectively carried out without data
reduction when the amount of data is so large. The
proposed model uses a genetic algorithm to optimize
simultaneously the connection weights between
layers and a selection task for relevant instances.
The globally evolved weights mitigate the well-
known limitations of gradient descent algorithm. In
addition, genetically selected instances shorten the
learning time and enhance prediction performance.
In (Madden, O’Connor, 2006) is evaluated the
effectiveness of using external indicators, such as
commodity prices and currency exchange rates, in
predicting movements in the Dow Jones Industrial
Average index. The performance of each technique
is evaluated using different domain-specific metrics.
A comprehensive evaluation procedure is described,
involving the use of trading simulations to assess the
practical value of predictive models, and comparison
with simple benchmarks that respond to underlying
market growth. In the experiments presented, basing
trading decisions on a neural network trained on a
range of external indicators resulted in a return on
investment of 23.5% per annum, during a period
when the DJIA index grew by 13.03% per annum.
In (Gosh, 2012) is presented a hybrid neural-
evolutionary methodology to forecast time-series
and prediction of the NASDAQ stock price in
particular. The methodology is hybrid because an
evolutionary computation-based optimization process
is used to produce a complete design of a neural
network. The produced neural network, as a model,
is then used to forecast the time-series. The model
identification process involves data manipulation
and a highly experienced statistician to do the work.
Compared to previous work, this paper approach is
purely evolutionary, while others use mixed, mainly
combined with back-propagation, which is known to
get stuck in local optima. On the direction of model
production, the evolutionary process automates the
identification of input variables, allowing the user to
avoid data pre-treatment and statistical analysis.
The study proves the nimbleness of ANN as a
predictive tool for Financial Time series Prediction.
Furthermore, Conjugate Gradient Descent is proved
to be an efficient Back-propagation algorithm that
can be adopted to predict the average stock price of
NASDAQ.
In (Chen, Du, 2013) are studied the interactions
between social media and financial markets. The
authors use a popular online Chinese stock forum
Fourth International Symposium on Business Modeling and Software Design
286

Guba.com.cn as well as traditional sentimental
analysis methods, for each stock, they build a Social
Behaviour Graph based on human’s online
behaviour, calculate key characteristics of the graph,
and find out the correlations between trading
volume/price and those characteristics. They make
use of a back-propagation neural network to predict
the trading volume and price of stocks from the
Shanghai/Shenzhen Stock Exchange in China. Their
method has achieved better outcome compared to
the traditional trading volume/price based time
series models. A trading strategy based on this
method achieved 56.28% benefits for a period of
three month, during which the stock index increased
by only 1.17%.
5 CONCLUSION
This paper surveyed the application of neural
networks to financial systems. It demonstrated how
neural networks have been used to test the Efficient
Market Hypothesis and how they outperform
statistical and regression techniques in forecasting
share prices. Although neural networks are not
perfect in their prediction, they outperform all other
methods and provide hope that one day we can more
fully understand dynamic, chaotic systems such as
the stock market.
Nowadays the technical advancement in comput-
ational power has served researchers to implement
ANN’s and obtain results faster and easier.
The Efficient Market Hypothesis is being heavily
criticized and rejected mainly because of the fact
that not all market participants possess the same
amount of information and speed of access to the
market and so on. This fact is encourages even more
researchers to look for ways to predict the stock
markets using the machine learning methods and
artificial neural networks in particular.
Great deal of work has been done in the field
since the late 1980’s and progress has been
substantial, putting ANN’s in the centre of
sophisticated models for predicting stock markets all
around the world, from mainstream market indexes
like the Daw Jones IA and S&P 500 through the
Emerging markets of the BRIC to the less liquid
financial markets in Eastern Europe, Latin and South
America and the Middle and Far East.
ACKNOWLEDGEMENTS
The research work presented in this paper is partially
supported by the FP7 grant AComIn №316087,
funded by the European Commission in Capacity
Programme in 2012-2016 and by the European
Social Fund and Republic of Bulgaria, Operational
Programme “Development of Human Resources”
2007-2013, Grant № BG051PO001-3.3.06-0048
from 04.10.2012.
REFERENCES
Azoff E. M., 1994. Neural Network Time Series
Forecasting of Financial Markets. John Wiley&Sons.
Chen A. S., M. T. Leung, H. Daouk, 2003. Application of
neural networks to an emerging financial market:
Forecasting and trading the Taiwan Stock Index.
Computers & Operations Research, Vol. 30, Issue 6,
pp. 901–923.
Chen Z., X. Du, 2013. Study of Stock Prediction Based on
Social Network, In: Proceedings of 2013 International
Conference on Social Computing, September 8–14
Alexandria, VA, USA, pp. 913–916.
Freisleben B., 1992. Stock market prediction with back-
propagation networks. In: Proceedings of 5
th
Intl.
Conf. on the industrial and engineering application of
artificial intelligence and expert systems, Germany,
June 1992, pp. 451–460.
Gosh A., 2012. Comparative study of Financial Time
Series Prediction by Artificial Neural Network with
Gradient Descent Learning. Brain, Vol. 3 Issue 1, pp.
41–49.
Kaastra I., M. Boyd, 1995. Forecasting futures trading
volume using neural networks Journal of Futures
Markets, Vol. 15, Issue 8, pp. 953–970.
Kalyvas E., 2001. Using Neural Networks And Genetic
Algorithms to Predict Stock Market Returns.
Department of Computer Science, The University of
Manchester, UK.
Kamijo K., T. Tanigawa, 1990. Stock market pattern
recognition – A recurrent neural network approach
Proc. IJCNN, San Diego, Vol. 1, pp. 215–221.
Kim K., 2006. Artificial neural networks with evolution-
ary instance selection for financial forecasting. Expert
Systems with Applications, Vol. 30, Issue 3, pp. 519–
526.
Kim W., B. Lee, 2004. Stock Market Prediction using
artificial neural networks with optimal feature
transformation. Neural Comput & Applic, Vol. 13, pp.
255–260.
Kimoto T., K. Asakawa, M. Yoda, M. Takeoka, 1990.
Stock market prediction system with modular neural
network. Proceedings of the International Joint
Conference on Neural Networks, pp. 1–6.
Leung M. T., H. Daouk, A.-S. Chen, 2000. Forecasting
stock indices: A comparison of classification and level
estimation models. Int. J of Forecasting, Vol. 16, pp.
173–190.
Madden M. G., N. O'Connor, 2006. Neural Network
Approach to Predicting Stock Exchange Movements
Artificial Intelligence Neural Networks Applications in Forecasting Financial Markets and Stock Prices
287

using External Factors. In: Applications and
Innovations in Intelligent Systems XIII, pp. 64–77.
Matsuba I., 1991. Neural sequential associator and its
application to stock price prediction Proc. IECON 91,
Japan, Vol. 2, pp. 1476–1479.
Pan H., I. Tilakaratne, J. Yearwood, 2005. Predicting
Australian Stock Market Index Using Neural Net-
works Exploiting Dynamical Swings and Intermarket
Influences, Journal of Research and Practice in
Information Technology, Vol. 37, No. 1, pp. 43–55.
Werbos P. J., 1988. Generalization of back-propagation
with application to a recurrent gas market model,
Neural Networks, Vol. 1, pp. 339–356.
White H., 1988. Economic prediction using Neural
Networks: The case of IBM daily stock returns. In:
Proc. of the IEEE International Conference on Neural
Networks, pp. 451–458.
Fourth International Symposium on Business Modeling and Software Design
288
