
Social Business Intelligence
OLAP Applied to User Generated Contents
Matteo Golfarelli
DISI, University of Bologna, Via Sacchi, 3, Cesena, Italy
Keywords:
OLAP, User-generated Contents, Data Warehousing, Social Media Monitoring, Sentiment Analysis.
Abstract:
Social BI is an emerging discipline that aims at applying OLAP analysis to textual user-generated content to
let decision-makers analyze their business based on the trends perceived from the environment. Despite the
increasing diffusion of SBI applications, only few works in the academic literature addressed the specificities
of this applications. In this paper we report some of this distinguishing features and discuss possible solutions.
1 INTRODUCTION
The planetary success of social networks and the
widespread diffusion of portable devices has enabled
simplified and ubiquitous forms of communication
and has contributed, during the last decade, to a sig-
nificant shift in human communication patterns to-
wards the voluntary sharing of personal information.
Most of us are able to connect to the Internet any-
where, anytime, and continuously send messages to a
virtual community centered around blogs, forums, so-
cial networks, and the like. This has resulted in the ac-
cumulation of enormous amounts of user-generated
content (UGC), that include geolocation, preferences,
opinions, news, etc. This huge wealth of informa-
tion about people’s tastes, thoughts, and actions is ob-
viously raising an increasing interest from decision
makers because it can give them a fresh and timely
perception of the market mood; besides, often the dif-
fusion of UGC is so widespread to directly influence
in a decisive way the phenomena of business and so-
ciety (Castellanos et al., 2011; Rehman et al., 2012b;
Zhang et al., 2009).
Some commercial tools are available for analyz-
ing the UGC from a few predefined points of view
(e.g., topic discovery, brand reputation, and topics
correlation) and using some ad-hoc KPIs (e.g., topic
presence counting and topic sentiment). These tools
do not rely on any standard data schema; often they
do not even lean on a relational DBMS but rather on
in-memory or non-SQL ones. Currently, they are per-
ceived by companies as self-standing applications, so
UGC-related analyses are run separately from those
strictly related to business, that are carried out based
on corporate data using traditional business intelli-
gence platforms. To give decision makers an unprece-
dentedly comprehensivepicture of the ongoing events
and of their motivation, this gap must be bridged
(Garc´ıa-Moya et al., 2013).
Social Business Intelligence
1
(SBI) is the emerg-
ing discipline that aims at effectively and efficiently
combining corporate data with UGC to let decision-
makers analyze and improve their business based on
the trends and moods perceived from the environ-
ment (Gallinucci et al., 2013). As in traditional busi-
ness intelligence, the goal of SBI is to enable power-
ful and flexible analyses for decision makers (simply
called users from now on) with a limited expertise in
databases and ICT. In other terms we want to apply
OLAP analysis on top of a data warehouse storing a
semantically enriched version of the UGC related to a
specific matter.
In the context of SBI, the most widely used cate-
gory of UGC is the one coming in the form of textual
clips. Clips can either be messages posted on social
media (such as Twitter, Facebook, blogs, and forums)
or articles taken from on-line newspapers and mag-
azines. Digging information useful for users out of
textual UGC requires to set up an extended ETL pro-
cess that includes (1) crawling the web to extract the
clips related to a subject area; (2) enriching them in
order to let as much information as possible emerge
from the raw text; (3) transforming and modeling the
data in order to store them in a multidimensional fash-
1
In the literature the term Social BI is also used to de-
fine the collaborative development of post user-generated
analytics among business analysts and data mining profes-
sionals.
Golfarelli M.
Social Business Intelligence - OLAP Applied to User Generated Contents.
DOI: 10.5220/0006807200010001
In Proceedings of the 11th International Conference on e-Business (ICETE 2014), pages 11-19
ISBN: 978-989-758-043-7
Copyright
c
2014 by SCITEPRESS – Science and Technology Publications, Lda. All rights reserved
ion. The subject area defines the project scope and
extent, and can be for instance related to a brand or
a specific market. Enrichment activities may simply
identify the structured parts of a clip, such as its au-
thor, or even use sentiment analysis techniques (Liu
and Zhang, 2012) to interpret each sentence and if
possible assign a sentiment (also called polarity, i.e.,
positive, negative, or neutral) to it. We will call SBI
process the one whose phases range from web crawl-
ing to users’ analyses of the results.
SBI has emerged as an application and research
field in the last few years. Although a wide literature
is available on the two initial steps of the extended
ETL process sketched so far, namely data crawling,
text mining, semantic enrichment and Natural Lan-
guage Processing, only few papers have focused on
the strictly OLAP-related issues. In (Lee et al., 2000)
the authors propose a cube for analyzing terms oc-
ccurrences in documents belonging to a corpus but
the terms categorization is very simple and do not al-
low to carry out analysis at different levels of abstrac-
tion. In (Ravat et al., 2008) the authors propose tex-
tual measures as a solution to summarize textual in-
formation within a cube. Complete architectures for
SBI have been proposed by (Rehman et al., 2012a)
and by (Garca-Moya et al., 2013) identifying its basic
blocks but still with a limited expressiveness. An im-
portant step in increasing the expressiveness of SBI
queries has been done in (Dayal et al., 2012) where,
a first advanced solution for modeling – the so-called
topic hierarchy – has been proposed. In this paper we
discuss three issues that, in our experience, represent
major changes with respect to tradition BI projects:
• SBI Architecture: with reference to standard BI
projects, SBI requires additional modules neces-
sary, for example, for semantic enrichment of un-
structured data. It also requires new technologies
such as document DBMS necessary for storing
and querying the large amount textual UGC.
• Modeling of SBI data: the semi-structured na-
ture of SBI data together with the dynamism of
UGCs make traditional multidimensional models
not enough expressive to support SBI queries.
• Methodology for SBI projects: a distinctive fea-
ture of SBI projects is related to the huge dy-
namism of the UGC and of the pressing need
of immediately perceiving and timely reacting to
changes in the environment.
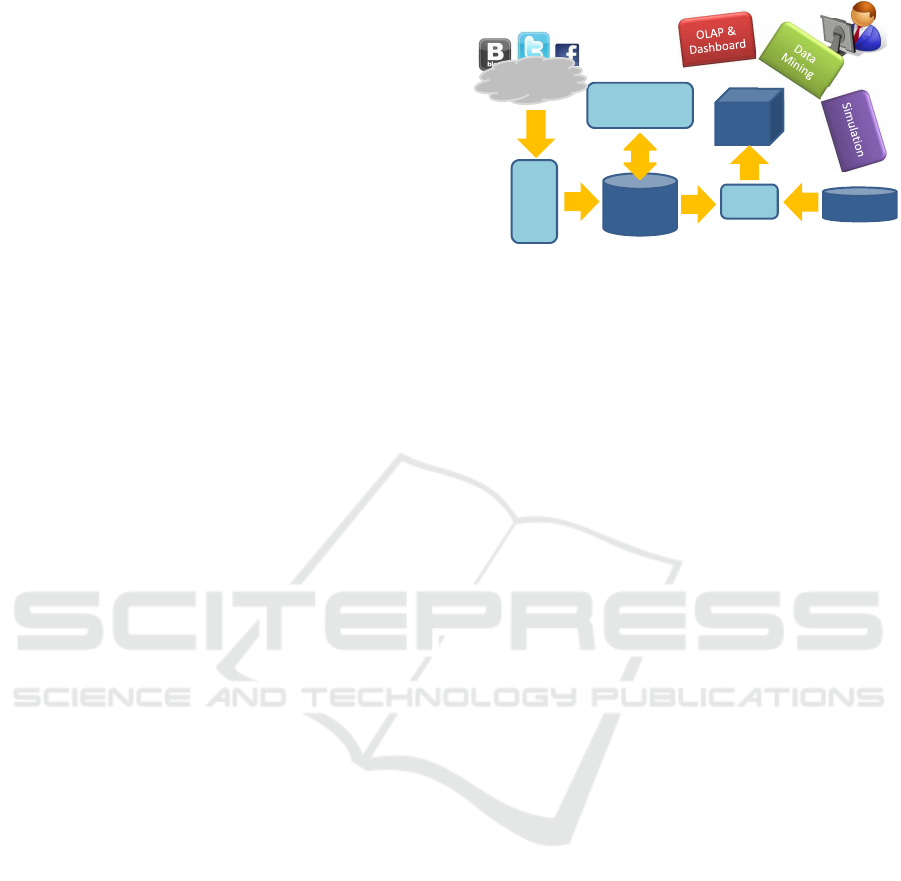
2 A SBI ARCHITECTURE
The architecture we propose to support our approach
Figure 1: An architecture for SBI.
to SBI is depicted in Figure 1. Its main highlight is
the integration between sentiment and business data,
which is achieved in a non-invasive way by extracting
some business flows from the enterprise data ware-
house and integrating them with those carrying tex-
tual UGC, in order to provide users with 360
◦
deci-
sional capabilities. In the following we briefly com-
ment each component.
The Crawling component carries out a set of
keyword-based queries aimed at retrieving the clips
(and the available meta-data) that are in the scope
of the subject area. The target of the crawler search
could be either the whole web or a set of user-defined
web sources (e.g., blogs, forums, web sites, social
networks). The semi-structured output of the crawler
is turned into a structured form and loaded onto the
Operational Data Store (ODS), that stores all the rel-
evant data about clips, their authors, and their source
channels; to this end, a relational ODS can be cou-
pled with a document-oriented database that can effi-
ciently store and search the text of the clips. The ODS
also represents all the topics within the subject area
and their relationships. The Semantic Enrichment
component works on the ODS to extract the seman-
tic information hidden in the clip texts. Depending
on the technology adopted (e.g., supervised machine-
learning (Pang et al., 2002) or lexicon-based tech-
niques (Taboada et al., 2011) such information can in-
clude the single sentences in the clip, its topic(s), the
syntactic and semantic relationships between words,
or the sentiment related to a whole sentence or to
each single topic it contains. The ETL component
periodically extracts data about clips and topics from
the ODS, integrates them with the business data ex-
tracted from the Enterprise Data Warehouse (EDW),
and loads them onto the Data Mart (DM). The DM
stores integrated data in the form of a set of multidi-
mensional cubes that, as shown in Section 3, require
ad-hoc modeling solutions; these cubes support the
decision making process in three complemental ways:
1. OLAP & Dashboard: users can explore the UGC
from different perspectives and effectively con-
trol the overall social feeling. Using OLAP tools
for analyzing UGC in a multidimensional fashion
pushes the flexibility of our architecture much fur-
ther than the standard architectures adopted in this
context.
2. Data Mining: users evaluate the actual relation-
ship between the rumors/opinion circulating on
the web and the business events (e.g., to what ex-
tent positive opinions circulating about a product
will have a positive impact on sales?).
3. Simulation: the correlation patterns that connect
the UGC with the business events, extracted from
past data, are used to forecast business events in
the near future given the current UGC.
In our prototypical implementation of this ar-
chitecture, publicly available at http://semantic.csr.
unibo.it, topics and roll-up relationships are manu-
ally defined; we use Brandwatch for keyword-based
crawling, Talend for ETL, SyN Semantic Center by
SyNTHEMA for semantic enrichment (specifically,
for labeling each clip with its sentiment), Oracle for
storing the ODS and the DM, and MongoDB for stor-
ing the document database. We developed an ad-hoc
OLAP & dashboard interface using JavaScript, while
simulation and data mining components are not cur-
rently implemented.
The components mentioned above are normally
present, though with different levels of sophistica-
tion, in most current commercial solutions for SBI.
However the roles in charge of designing, tuning, and
maintaining each component may vary from project
to project. In regards to this, SBI projects can be clas-
sified as follows:
• Level 1: Best-of-Breed. In this type of projects,
a best-of-breed policy is followed to acquire tools
specialized in one of the steps necessary to trans-
form raw clips in semantically-rich information.
This approach is often followed by those who run
a medium to long-term project to get full control
of the SBI process by finely tuning all its criti-
cal parameters, typically aimed at implementing
ad-hoc reports and dashboards to enable sophisti-
cated analyses of the UGC.
• Level 2: End-to-End. Here, an end-to-end soft-
ware/ service is acquired and tuned. Customers
only need to carry out a limited set of tuning
activities that are typically related to the subject
area, while a service provider or a system integra-
tor ensures the effectiveness of the technical (and
domain-independent) phases of the SBI process.
• Level 3: Off-the-Shelf. This type of projects con-
sists in adopting, typically in a as-a-service man-
OCCURRENCE
totalOcc
positiveOcc
negativeOcc
avgSentiment
Date Month Year
Source
Media Type
Clip
Author
Country
Sex
Language
Topic
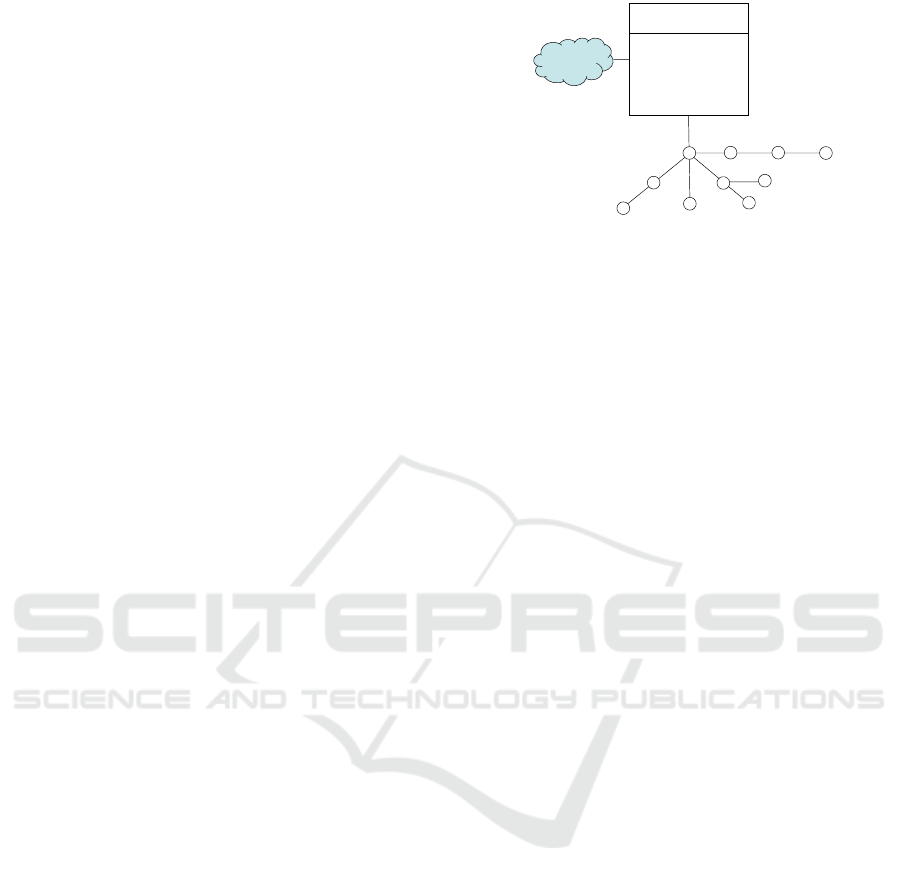
Figure 2: A DFM representation of an SBI cube reporting
information about the occurrence of a specific topic in a spe-
cific text.
ner, an off-the-shelf solution supporting a set of
reports and dashboards that can satisfy the most
frequent user needs in the SBI area (e.g., average
sentiment, top topics, trending topics, and their
breakdown by source/author /sex). With this ap-
proach the customer has a very limited view of the
single activities that constitute the SBI process, so
she has little or no chance of positively impact-
ing on activities that are not directly related to the
analysis of the final results.
Moving from level 1 to 3, projects require less techni-
cal capabilities from customers and ensure a shorter
set-up time, but they also allow less control of the
overall effectiveness and less flexibility in analyzing
the results.
3 MODELING SBI DATA
The main goal of SBI is to allow OLAP paradigm to
be applied to social/textual data. As shown in the pre-
vious section some proposals for a multidimensional
modeling of SBI data has been provided but all of
them lacks in providing the required expressiveness.
A key role in the analysis of textual UGC is played by
topics, meant as specific concepts of interest within
the subject area. Users are interested in knowing how
much people talk about a topic, which words are re-
lated to it, if it has a good or bad reputation, etc. Thus,
topics are obvious candidates to become a dimension
of the cubes for SBI. A simple example of an SBI
cube is reported in Figure 2. Apart from the Topic hi-
erarchy, the meta-data retrieved by the crawling mod-
ule has been modeled thus, for example, the average
sentiment about a specific group of topics can be ana-
lyzed for different Media Types. Like for any other di-
mension, users are very interested in grouping topics
together in different ways to carry out more general
and effective analyses —which requires the definition
of a topic hierarchy that specifies inter-topic roll-up

(i.e., grouping) relationships so as to enable aggrega-
tions of topics at different levels.
Example 1. A marketing analyst wants to analyze
people’s feelings about mobile devices and relate
them to the selling trends. A basic cube she will use
to this purpose is the one counting, within the textual
UGC, the number of occurrences of each topic related
to subject area “mobile technologies”, distinguishing
between those expressing positive/negative sentiment
as labeled by an opinion mining algorithm (see Fig-
ure 2). Figure 3-right shows a set of topics for mobile
technologies and their roll-up relationships: when
computing the brand reputation for the topic “Sam-
sung”, decision makers may wish to also include oc-
currences of topics “Galaxy III” and “Galaxy Tab”,
while when analyzing users’ concerns about “Galaxy
III” she want to consider comments about its parts.
However, topic hierarchies are different from tra-
ditional hierarchies (like the temporal and the geo-
graphical one) in several ways:
♯1 Also non-leaf topics can be related to facts (e.g.,
clips may talk of smartphones as well as of the
Galaxy III) (Dayal et al., 2012). This means that
grouping topics at a given level may not determine
a total partitioning of facts (Pedersen et al., 2001).
Besides, topic hierarchies are unbalanced, i.e., hi-
erarchy instances can have different lengths.
♯2 Trendy topics are heterogeneous (e.g., they could
include names of famous people, products, places,
brands, etc.) and change quickly over time (e.g., if
at some time it were announced that using smart-
phones can cause finger pathologies, a brand new
set of hot unpredicted topics would emerge during
the following days), so a comprehensive schema
for topics cannot be anticipated at design time and
must be dynamically defined.
♯3 Roll-up relationships between topics can have dif-
ferent semantics: for instance, the relationship se-
mantics in “Galaxy III has brand Samsung” and
“Galaxy III has type smartphone” is quite differ-
ent. In traditional hierarchies this is indirectly
modeled by leaning on the semantics of aggre-
gation levels (“Smartphone” is a member of level
Type, “Samsung” is a member of level Brand).
In light of the above, topic hierarchies in ROLAP
contexts must clearly be modeled with more sophis-
ticated solutions than traditional star schemata. In
(Gallinucci et al., 2013) we proposed meta-star; its
basic idea is to use meta-modeling coupled with nav-
igation tables and with traditional dimension tables.
On the one hand, navigation tables easily support hi-
erarchy instances with different lengths and with non-
leaf facts (requirement ♯1), and allow different roll-
up semantics to be explicitly annotated (requirement
♯3); on the other, meta-modeling enables hierarchy
heterogeneity and dynamics to be accommodated (re-
quirement ♯2). An obvious consequence of the adop-
tion of navigation tables is that the total size of the
solution increases exponentially with the size of the
topic hierarchy. This clearly limits the applicability of
the meta-star approach to topic hierarchies of small-
medium size; however, we argue that this limitation
is not really penalizing because topic hierarchies are
normally created and maintained manually by domain
experts, which suggests that their size can hardly be-
come too large.
In the remainder of this section we provide a for-
mal definition of the topic hierarchy related concepts.
Definition 1. A hierarchy schema S is a couple of a
set L of levels and a roll-up partial order ≻ of L. We
will write l
k
˙
≻l
j
to emphasize that l
k
is an immediate
predecessor of l
j
in ≻.
Example 2. In Example 1 it is L = {Product,
Type, Category, Brand, Component} and
Component
˙
≻Product
˙
≻Type
˙
≻Category,
Product
˙
≻Brand (see Figure 3-left).
The connection between hierarchy schemata (in-
tension) and topic hierarchies (extension) is captured
by Definition 2, that also annotates roll-up relation-
ships with their semantics.
Definition 2. A topic hierarchy conformed to hierar-
chy schema S = (L,≻
S
) is a triple of (i) an acyclic
directed graph H = (T,R), where T is a set of top-
ics and R is a set of inter-topic roll-up relationships;
(ii) a partial function Lev : T → L that associates
some topics to levels of S ; and (iii) a partial func-
tion Sem : R → ρ that associates some roll-up rela-
tionships to their semantics (with ρ being a list of
user-defined roll-up semantics). Graph H must be
such that, for each ordered pair of topics (t
1
,t
2
) ∈ R
such that Lev(t
1
) = l
1
and Lev(t
2
) = l
2
, it is l
1
˙
≻l
2
and
∀(t
1
,t
3
) ∈ R, Lev(t
3
) 6= l
2
.
The intuition behind the constraints on H is that
inter-topic relationships must not contradict the roll-
up partial order and must have many-to-onemultiplic-
ity. For instance, the arc from “Galaxy III” to “Smart-
phone” is correct because Product
˙
≻Type, but there
could be no other arc from “Galaxy III” to a topic
of level Type. In the same way, no arc from a product
to a category is allowed; the arc from “Galaxy III” to
“Touchscreen” is allowed because the latter does not
belong to any level.
Finally, Definition 3 provides a compact represen-
tation for the semantics involved in any path of a topic
hierarchy.
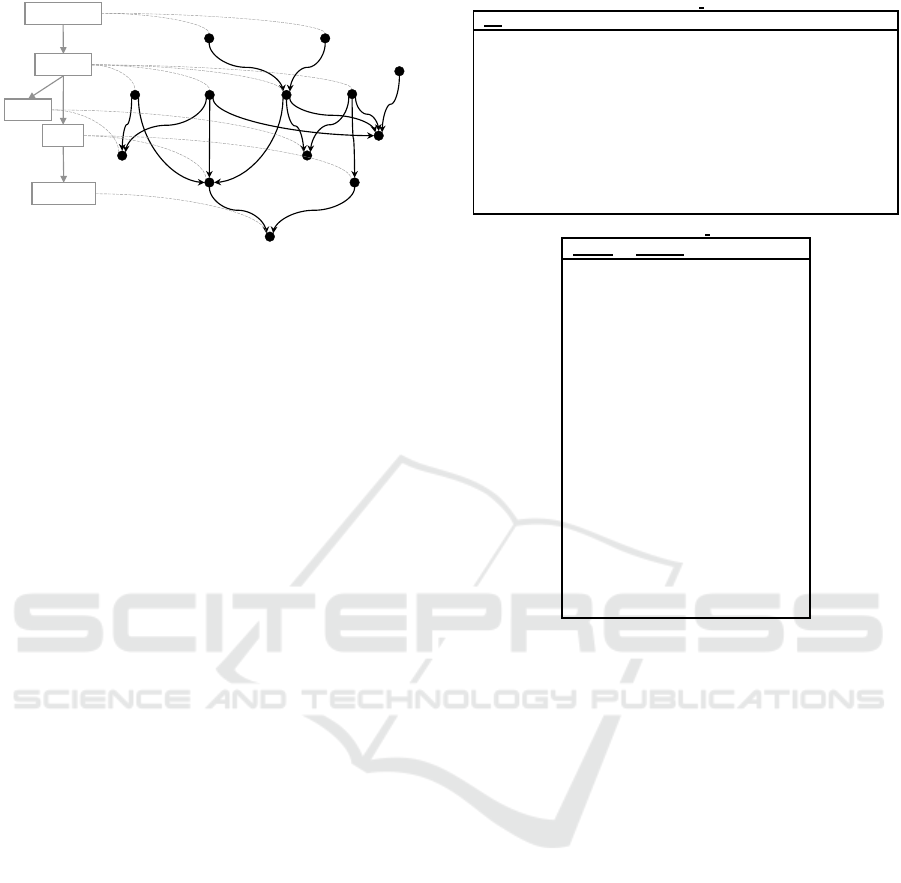
Smartphone
Galaxy IIILumia 920
Samsung
Nokia
8MP Camera
4.8in Display
hasBrand
hasType
isPartOf
hasBrand
Mobile Tech
Tablet
hasCategory
hasType
hasType
Brand
Category
Type
Product
Component
E5
Galaxy Tab
Touchscreen
Finger Pathologies
causedBy
has
has
has
Figure 3: The annotated topic hierarchy for the mobile tech-
nology subject area.
Definition 3. Given topic t
1
such that Lev(t
1
) = l
1
and given level l
2
such that l
1
≻ l
2
, we denote with
Anc
l
2
(t
1
) the topic t
2
such that Lev(t
2
) = l
2
and t
2
is
reached from t
1
through a directed path P in H. The
roll-up signature of couple (t
1
,t
2
) is a binary string
of |ρ| bits, where each bit corresponds to one roll-up
semantics and is set to 1 if at least one roll-up re-
lationship with that semantics is part of P, is set to
0 otherwise. Conventionally, the roll-up signature of
(t,t) is a string of 0’s for each t.
Example 3. In Figure 3 the topic hierar-
chy on the right-hand side is annotated with
levels and roll-up semantics; for instance,
it is Anc
Brand
(8MP Camera) = Samsung,
Anc
Type
(8MP Camera) = Smartphone. Note that
topics “Touchscreen” and “Finger Pathologies” do
not belong to any level. If ρ = (isPartOf, hasType,
hasBrand, hasCategory, has, causedBy), then the
roll-up signature of (8MP Camera, Samsung) is
101000 (because the path from “8MP Camera”
to “Samsung” includes roll-up relationships with
semantics isPartOf and hasBrand), that of (8MP
Camera, Smartphone) is 110000.
Topic hierarchies can be implemented on a RO-
LAP platform combining classical dimension tables
with recursive navigation tables and extends the re-
sult by meta-modeling. Remarkably, the designer can
tune the solution by deciding which levels L
stat
⊆ L
are to be modeled also in a static way, i.e., like in
a classical dimension table. Two different tables are
used:
1. A topic table storing one row for each distinct
topic t ∈ T. The schema of this table includes
a primary surrogate key IdT, a Topic column, a
Level column, and an additional column for each
static level l ∈ L
stat
. The row associated to topic t
has Topic= t and Level= Lev(t). Then, if Lev(t) ∈
L
stat
, that row has value t in column Lev(t), value
Anc
l
(t) in each column l such that l ∈ L
stat
and
Lev(t) ≻ l, and NULL elsewhere.
TOPIC
T
IdT Topic Level Product Type Category
1 8MPCamera Component – – –
2 GalaxyIII Product GalaxyIII Smartph. MobTech
3 GalaxyTab Product GalaxyTab Tablet MobTech
4 Smartphone Type – Smartph. MobTech
5 Tablet Type – Tablet MobTech
6 MobileTech Category – – MobTech
7 Samsung Brand – – –
8 Finger Path. – – – –
9 Touchscreen – – – –
... ... ... ... ... . ..
ROLLUP T
ChildId FatherId RollUpSignature
1 1 000000
2 2 000000
... ... 000000
1 2 100000
2 4 010000
2 7 001000
4 6 000100
8 9 000001
2 9 000010
... ... ...
1 4 110000
1 7 101000
1 9 100010
2 6 010100
3 6 010100
... ... ...
1 6 110100
... ... ...
Figure 4: Meta-star modeling for the mobile technology
subject area.
2. A roll-up table storing one row for each topic in
T and one for each arc in the transitive closure
of H. The row corresponding to topic t has two
foreign keys, ChildId and FatherId, that reference
the topic table and both store the surrogate of topic
t, and a column RollUpSignature that stores the
roll-up signature of (t,t), i.e., a string of 0’s. The
row corresponding to arc (t
1
,t
2
) stores in ChildId
and FatherId the two surrogates of topics t
1
and t
2
,
while column RollUpSignature stores the roll-up
signature of (t
1
,t
2
).
Example 4. The topic and the roll-up tables for
the topic hieerarchy in Figure 3 when L
stat
=
{Product,Type, Category} are reported in Figure 4.
The eleventh row of the roll-up table states that the
roll-up signature of couple (8MP Camera, Smart-
phone) is 110000, i.e., that the path from one topic
to the other includes semantics isPartOf and hasType.
Meta-stars also better support topic hierarchy dy-
namics, through the combined use of meta-modeling
and of the roll-up table. A whole new set of emerging
topics, possibly structured in a hierarchy with differ-
ent levels, can be accommodated —without changing
the schema of meta-stars— by adding new values to
the domain of the Level column, adding rows to the
topic and the roll-up tables to represent the new top-
ics and their relationships, and extending the roll-up
signatures with new bits for the new roll-up seman-
tics. The newly-added levels will immediately be-
come available for querying and aggregation.
Meta-stars yield higher querying expressiveness,
at the cost of a lower time and space efficiency.
Surprisingly the tests we carried out in (Gallinucci
et al., 2013) have shown that though, as expected,
in most cases traditional star schemata out-perform
meta-stars, the time execution gap is quite limited and
perfectly acceptable in terms of on-line querying.
4 A METHODOLOGY FOR SBI
PROJECTS
SBI has emerged as an application and research field
in the last few years and there is no agreement yet
on how to organize the different design activities. In-
deed, in real SBI projects, practitioners typically carry
out a wide set of task but they lack an organic and
structured view of the design process. The specifici-
ties that distinguish a BI project from an SBI one are
listed below:
• SBI projects call for an effective and efficient
support to maintenance iterations, because of the
huge dynamism of the UGC and of the pressing
need of immediately perceiving and timely react-
ing to changes in the environment.
• The schema of the data and the ETL flows are in-
dependent of the project domain and the changes
are mainly related to the meta-data made available
by the crawling and the semantic enrichment en-
gines.
• The complexity of different tasks and the subjects
who are in charge of them are strongly related to
the type of project implemented.
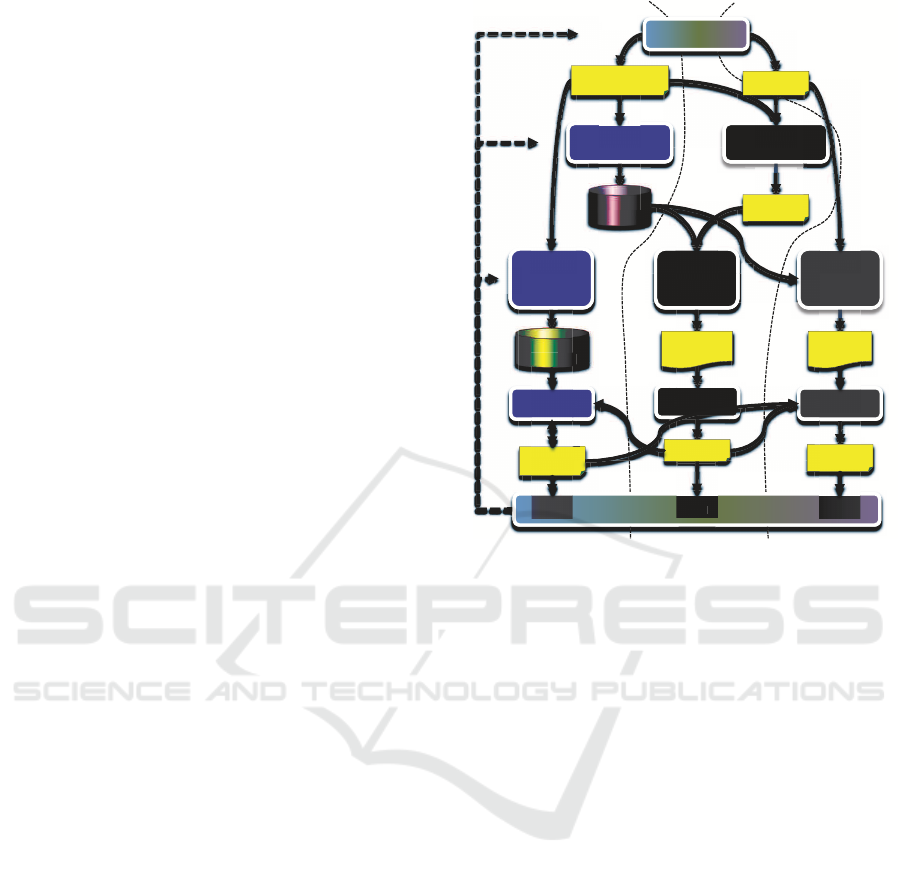
The iterative methodology we have proposed in
(Francia et al., 2014) (see Figure 5) is aimed at letting
harmoniously coexist all the activities involved in an
SBI project. These activities are to be carried out in
tight connection one to each other, always keeping in
mind that each of them heavily affects the overall sys-
tem performance and that a single problem can easily
neutralize all other optimization efforts.
Besides speeding up the initial design of an SBI
process, the methodology is aimed at maximize the
effectiveness of the user analyses by continuously op-
timizing and refining all its phases. These mainte-
semantic track
ETL &
OLAP
Design
Source
Selection
ontology/
dictionary
ETL &
reports
Macro-Analysis
Ontology
Design
Crawling
Design
Execution
So
ur
ce
Selectio
Crawling
Design
mantic track
ntic t ck
Semantic
Enrichment
Design
Semantic
data track
crawling track
ng
ck
ck
Crawling
Crawling
sources
domain
ontology
ETL
&
L
inquiries
Ontology
Desi
subj. area,
threads, topics
templates,
queries
Execution Execution
Execution
Execution
clips
enriched
clips
key
figures
Test
Te
st
Ex
n
Execution
Ex
Ex
clips
n
ed
Execution
enriched
clips
n
ed
what how
where
Figure 5: Functional view of our methodology for SBI de-
sign.
nance activities are necessary in SBI projects because
of the continuous environment variability which asks
for high responsiveness. This variability impacts ev-
ery single activity, from crawling design to semantic
enrichment design, and leads to constantly having to
cope with changes in requirements.
In the following we briefly describe the main fea-
ture of each activity, for a more detailed description
refer to (Francia et al., 2014).
1. Macro-Analysis: during this activity, users are in-
terviewed to define the project scope and the set
of inquiries the system will answer to. An inquiry
captures an informative need of a user; from a
conceptual point of view it is specified by three
components: what, i.e., one or more topic on
which the inquiry is focused (e.g., the Galaxi III);
how, i.e., the type of analysis the user is inter-
ested in (e.g., top related topics); where, i.e., the
data sources to be searched (e.g., the Technology-
related web forums).
Inquiries drive the definition of subject area,
themes, and topics. As said before, the subject
area of a project is the domain of interest for the
users (e.g., Mobile Technology), meant as the set
of themes about which information is to be col-
lected. A theme (e.g., Tablet reputation) includes
a set of specific topics (e.g., Touchscreen). Lay-

ing down themes and topics at this early stage is
useful as a foundation for designing a core taxon-
omy of topics during the first iteration of ontol-
ogy design; themes can also be used to enforce
an incremental decomposition of the project. In
practice, this activity should also produce a first
assessment of which sources cannot be excluded
from the source selection activity since they are
considered as extremely relevant (e.g., the corpo-
rate website and Facebook pages).
2. Ontology Design: during this activity, customers
work on themes and topics to build and refine
the domain ontology that models the subject area.
Noticeably, the domain ontology is not just a list
of keywords; indeed, it can also model relation-
ships (e.g., hasKind, isMemberOf) between top-
ics. Once designed, this ontology becomes a key
input for almost all process phases: semantic en-
richment relies on the domain ontology to better
understand UGC meaning; crawling design ben-
efits from topics in the ontology to develop bet-
ter crawling queries and establish the content rel-
evance; ETL and OLAP design heavily uses the
ontology to develop more expressive, comprehen-
sive, and intuitive dashboards.
3. Source Selection: is aimed at identifying as many
web domains as possible for crawling. The set
of potentially relevant sources can be split in two
families: primary sources and minor sources. The
first set includes all the sources mentioned during
the first macro-analysis iteration, namely: (1) the
corporate communication channels (e.g. the cor-
porate website, Facebook page, Twitter account);
(2) the generalist sources, such as the online ver-
sion of the major publications. The user-base of
minor sources is smaller but not less relevant to
the project scope. Minor sources include lots of
small platforms which produce valuable informa-
tion with high informative value because of their
major focus on themes related to the subject area.
The two main subsequent tasks involved in this
activity are:
• Template design consists in an analysis of the
code structure of the source website to enable
the crawler to detect and extract only the infor-
mative UGC (e.g., by excluding external links,
advertising, multimedia, and so on).
• Based on the templates designed, query design
develops a set of queries to extract the relevant
clips. Normally, these are complex Boolean
queries that explicitly mention both relevant
keywords to extract on-topic clips and irrele-
vant keywords to exclude off-topic clips.
Note that filtering off-topic clips at crawling time
could be difficult due to the limitations of the
crawling language, and also risky because the in-
topic perimeter could change during the analysis
process. For these reasons, the team can choose to
release some constraints aimed at letting a wider
set of clips “slip through the net”, and only fil-
ter them at a later stage using the search features
of the underlying document DBMS (e.g., Mon-
goDB).
4. Semantic Enrichment Design: involves several
tasks whose purpose is to increase the accuracy
of text analytics so as to maximize the process ef-
fectiveness in terms of extracted entities and sen-
timent assigned to clips; entities are concepts that
emerge from semantic enrichment but are not part
of the domain ontology yet (for instance, they
could be emerging topics). The specific tasks
to be performed depend on the semantic engine
adopted and on how semantic enrichment is car-
ried out.
In general, two main tasks that enrich and improve
its linguistic resources can be distinguished:
• Dictionary enrichment, that requires including
new entities missing from the dictionary and
changing the sentiment of entities (polariza-
tion) according to the specific subject area (e.g.,
in “I always eat fried cutlet”, the word “fried”
has a positive sentiment, but in the food mar-
ket area a sentence like “These cutlets taste like
fried” should be tagged with a negative senti-
ment because fried food is not considered to be
healthy).
• Inter-word relation definition, that establishes
or modifies the existing semantic, and some-
times also syntactic, relations between words.
Relations are linguistically relevant because
they can deeply modify the meaning of a word
or even the sentiment of an entire sentence
determining the difference between right and
wrong interpretation (e.g., “a Pyrrhic victory”
has negative sentiment though “victory” is pos-
itive).
Modifications in the linguistic resources may pro-
duce undesired side effects; so, after completing
these tasks, a correctness analysis should be ex-
ecuted aimed at measuring the actual improve-
ments introduced and the overall ability of the
process in understanding a text and assigning the
right sentiment to it. This is normally done, using
regressive test techniques, by manually tagging an
incrementally-built sample set of clips with a sen-
timent.

5. ETL & OLAP Design: The main tasks in this ac-
tivity are:
• ETL design and implementation, that strongly
depends on features of the semantic engine, on
the richness of the meta-data retrieved by the
crawler (e.g., URLs, author, source type), and
on the possible presence of specific data acqui-
sition channels such as CRM.
• KPI design; different kinds of KPIs can be
designed and calculated depending on which
kinds of meta-data the crawler fetches.
• Dashboard design, during which a set of re-
ports is built that captures the user needs ex-
pressed by inquiries during macro-analysis.
6. Execution and Test: has a basic role in the
methodology, as it triggers a new iteration in the
design process. Crawling queries are executed,
the resulting clips are processed, and the reports
are launched over the enriched clips. The specific
tests related to each single activity, described in
the preceding subsections, can be executed sepa-
rately thoughthey are obviouslyinter-related. The
first test executed is normally the one of crawling;
even after a first round, the semantic enrichment
tests can be run on the resulting clips. Similarly,
when the first enriched clips are available, the test
of ETL and OLAP can be triggered.
The analysis of the outcomes of a set of case stud-
ies (Francia et al., 2014) has shown that the adoption
of a proper methodology strongly impacts on the ca-
pability of keeping under control execution time, re-
quired resources and effectiveness of the results. In
particular the key points of the proposed methodol-
ogy are: (1) a clear organization of goals and tasks
for each activity, (2) the adoption of a protocol and a
set of templates to record and share information be-
tween activities and (3) the implementation of a set of
tests to be applied during the methodology phases.
5 CONCLUSIONS
In this paper we discussed some of the key issues
related to the emerging area of SBI. Although some
commercial solutions is already available, this types
of applications deserve further investigations. SBI
is at the crossroad between different disciplines, this
makes researches more challenging but it potentially
opens to more interesting results.
REFERENCES
Castellanos, M., Dayal, U., Hsu, M., Ghosh, R., Dekhil, M.,
Lu, Y., Zhang, L., and Schreiman, M. (2011). LCI:
a social channel analysis platform for live customer
intelligence. In Proc. SIGMOD, pages 1049–1058.
Dayal, U., Gupta, C., Castellanos, M., Wang, S., and
Garc´ıa-Solaco, M. (2012). Of cubes, DAGs and hi-
erarchical correlations: A novel conceptual model for
analyzing social media data. In Proc. ER, pages 30–
49.
Francia, M., Golfarelli, M., and Rizzi, S. (2014). A method-
ology for social bi. In Proc. IDEAS.
Gallinucci, E., Golfarelli, M., and Rizzi, S. (2013). Meta-
stars: multidimensional modeling for social business
intelligence. In Proc. DOLAP, pages 11–18.
Garca-Moya, L., Kudama, S., Aramburu, M., and Berlanga,
R. (2013). Storing and analysing voice of the mar-
ket data in the corporate data warehouse. Information
Systems Frontiers, 15(3):331–349.
Garc´ıa-Moya, L., Kudama, S., Aramburu, M. J., and Lla-
vori, R. B. (2013). Storing and analysing voice of the
market data in the corporate data warehouse. Informa-
tion Systems Frontiers, 15(3):331–349.
Lee, J., Grossman, D. A., Frieder, O., and McCabe, M. C.
(2000). Integrating structured data and text: A multi-
dimensional approach. In Proc. ITCC, pages 264–271.
Liu, B. and Zhang, L. (2012). A survey of opinion mining
and sentiment analysis. In Mining Text Data, pages
415–463. Springer.
Pang, B., Lee, L., and Vaithyanathan, S. (2002). Thumbs
up? sentiment classification using machine learning
techniques. In Proc. EMNLP, volume 10, pages 79–
86.
Pedersen, T. B., Jensen, C. S., and Dyreson, C. E. (2001). A
foundation for capturing and querying complex multi-
dimensional data. Inf. Syst., 26(5):383–423.
Ravat, F., Teste, O., Tournier, R., and Zurfluh, G. (2008).
Top keyword: An aggregation function for textual
document OLAP. In Proc. DaWaK, pages 55–64.
Rehman, N., Mansmann, S., Weiler, A., and Scholl, M.
(2012a). Building a data warehouse for twitter stream
exploration. In Advances in Social Networks Analy-
sis and Mining (ASONAM), 2012 IEEE/ACM Interna-
tional Conference on, pages 1341–1348.
Rehman, N. U., Mansmann, S., Weiler, A., and Scholl,
M. H. (2012b). Building a data warehouse for Twitter
stream exploration. In Proc. ASONAM, pages 1341–
1348.
Taboada, M., Brooke, J., Tofiloski, M., Voll, K. D., and
Stede, M. (2011). Lexicon-based methods for senti-
ment analysis. Computational Linguistics, 37(2):267–
307.
Zhang, D., Zhai, C., and Han, J. (2009). Topic Cube:
Topic modeling for OLAP on multidimensional text
databases. In Proc. SDM, pages 1123–1134.

BRIEF BIOGRAPHY
Matteo Golfarelli received the Ph.D. degree for his
work on autonomous agents in 1998 from the Uni-
versity of Bologna. Since 2005, he is an associate
professor in the same University, teaching informa-
tion systems, database systems, and data mining. He
has published more than 90 papers in refereed jour-
nals and international conferences in the fields of pat-
tern recognition, mobile robotics, multi-agent sys-
tems, and business intelligence that is now his main
research field. Within this area, in the last 15 years he
explored many relevant topics such as collaborative
and pervasive BI, temporal Data Warehouses, phys-
ical and conceptual Data Warehouse design. In par-
ticular he proposed the Dimensional Fact Model a
conceptual model for Data Warehouse systems that is
widely used in both academic and industrial contexts.
His current research interests include distributed and
semantic data warehouse systems, and social business
intelligence and open data warehouses. He joined
several research projects on the above areas and has
been involved in the PANDA thematic network of
the European Union concerning pattern-base manage-
ment systems.
