
ECG Denoising based on PCA and using R Peaks Detection
Talbi Mourad
Research and Technology Center of Energy of Borj Cedria, Tunis, Tunisia
Keywords: Electrocardiogram, R Peaks, Multi-Scale Product, Undecimated Wavelet Transform, Principal Component
Analysis.
Abstract: In this paper, we propose a new Electrocardiogram (ECG) Denoising technique based on Principal
Component Analysis (PCA) and using R peaks detection. This technique consists at first step in cutting the
entire ECG signal into frames then the denoising is performed frame by frame by using PCA. Each frame is
located between two successive R peaks. The R peaks detection is performed by using a new detection
method based on multi-scale product of the undecimated wavelet coefficients. The Reconstructed ECG
signal is obtained by concatenating all the denoised frames. The evaluation of the proposed technique is
performed by comparing it to the denoising technique based on PCA and applied to the entire noisy ECG
signal. The two techniques are tested on four ECG signals taken from MIT-BIH database. The used criteria
in this evaluation of these two techniques are the SNR improvement and the mean square error (MSE). The
obtained results from this evaluation show clearly that the denoising technique based on PCA and applied to
the entire noisy ECG signal, is slightly better than the proposed technique. However this latter has the
advantage of working in real-time because the processing is performed frame by frame and not on the entire
noisy ECG signal. Concerning the new proposed technique of R peaks detection, it is very accurate because
it permits a perfect reconstruction of the ECG signal when concatenating all the frames.
1 INTRODUCTION
The Electrocardiogram (ECG) signal is a graphical
representation of cardiac activity and it is used for
the identification of heart abnormalities and different
heart diseases. Generally, an ECG signal has unique
morphological characteristics (P-QRS-T complex)
and it is highly significant than other biological
signals (P. Karthikeyan, 2012; Er. Manpreet Kaur,
2014; Lei Lei, 2013). This high significance is
justified by the fact that it is possible to diagnose
many cardiac diseases by analyzing the variations of
this morphology visually. While ECG results have
made major contributions to cardiac diagnosis (B.
Babloyantz, 1996), the electroencephalogram (EEG)
is useful in neurological diagnosis, but to a lesser
degree (A. Blanco, 1997).
It is possible to have diagnostics of various
cardiac diseases through the analysis of the
morphology visually variations.The presense of
noises in an elctrocardiogram signal, will however
severely affect features extraction and visual
diagnosis of various application such as emotion
estimation and stress measurement (P. Karthikeyan,
2012). For suppressing noises and extracting the
efficient morphology of an electrocardiogram signal,
various processing techniques have been recently
proposed (M. Benmaiekl, 2010; K. M. Chang, 2011;
M. P. S. Chawla, 2008; S. C. Mahesh, 2008; S. M.
M. Martens, 2006). Many research works have used
digital Infinite Impulse Response (IIR) filter in order
to remove the effects of baseline wander and power
line interference from the ECG signal (S. C.
Mahesh, 2008; Mbachu C.B, 2011). Thanks to the
simplicity of the IIR filter design, higher order IIR
filters are performing well for removing the noises
from ECG signals. However, it has the drawback of
increased filtering time, memory and unable to filter
the highly non linear signals in the entire ECG range
(P. Karthikeyan, 2012). Recently, adaptive filtering
techniques are used for suppressing the power line
interference and other noises from an ECG signal (S.
M. M. Martens, 2006; F. Chang, 2007; D. Dobrev,
2008). This technique is more well-known due to its
smaller residual errors and faster filtering response
(P. Karthikeyan, 2012; S. G. Tareen, 2008).
However, this technique needs the reference signal
(either noise or signal characteristics) information
for the efficient filtering process (P. Karthikeyan,
119
Mourad T..
ECG Denoising based on PCA and using R Peaks Detection.
DOI: 10.5220/0004998201190125
In Proceedings of the International Conference on Bio-inspired Systems and Signal Processing (BIOSIGNALS-2015), pages 119-125
ISBN: 978-989-758-069-7
Copyright
c
2015 SCITEPRESS (Science and Technology Publications, Lda.)

2012). In reference (Taigang He, 2006), the
temporal averaging filter is adopted for noise
cancellation and it needs a large number of time
frames for efficient noise reduction (P. Karthikeyan,
2012). Independent Component Analysis (ICA) is
for suppressing the noises from physiological signals
in reference (S. G. Tareen, 2008). On the other hand,
the linear filtering is also adopted for concelling the
baseline wander from an ECG signal in the
frequency range of 0.5Hz (E.-S. El-Dahshan, 2010).
This technique introduces the ringing effect (Gibbs
phenomenon) on the ECG signal analysis (P.
Karthikeyan, 2012). For rectifying this limitation,
polynomial fitting (PF) or namely cubic spline filter
was introduced for suppressing noise from an ECG
signal. P. Karthikeyan (P. Karthikeyan, 2012) has
used the Principal Component Analysis (PCA) for
ECG signal denoising and in this work we have also
used PCA for the same goal. Our proposed
denoising technique exploits the R-peaks detection
in ECG denoising and the processing of denoising is
performed frame by frame. Each frame is located
between two consecutive R-peaks. In the rest of this
paper, we will detail with the proposed technique
and we will study the Principal Component Analysis
(PCA). We will also expose our new proposed
technique of R-peaks detection which is based on
multi-scale product of the undecimated wavelet
coefficients. Then we will give some simulation
results obtained from the application of the proposed
technique to four ECG signals taken from MIT-BIH
database. Finally we will interpreted these results
and give the conclusion.
2 MATERIAL AND METHODS
As mentioned previously, in this paper, we propose
a new method of ECG denoising based on Principal
Component Analysis (PCA). This technique consists
at first step in cutting the noisy ECG signal into
frames where each frame is located between two
consecutive R-peaks. Then the denoising is
performed frame by frame by using PCA. The
denoised ECG signal is finally obtained by
concatenating all the denoised frames. For detecting
R peaks, we propose in this paper, a new technique
of R-peaks detection based on undecimated wavelet
transform and computing multi-scale product and
then computing the modulus maxima.
2.1 Principal Component Analysis
Principal Component Analysis (PCA) is a method
that is usually employed in multivariate statistical
analysis (I Romero). Its aim is to reduce the number
of dimensions from a numerical measurement of
several variables (I Romero). With this dimensional
reduction, this technique looks for simplifying a
statistical problem with the minimal lost of
information. This technique is also used in signal
processing for separating a linear combination of
signals generated from sources that are statistically
independent. This is performed by representing the
data with a new coordinate system where its aim
consists in maximizing the signal, measured by the
variance, and minimizing redundancy, measured by
the covariance magnitude (Shlens Jonathan, 2009;
Joachim.behar). Note that others measures can be
used with such statistically based techniques for
discovering the axes. For example in the case of
ICA, the measure is based on non-Gaussianity
(Joachim.behar). The final PCA aim consists in
decorrelating the signal by projecting data onto a
particular orthogonal basis (Joachim.behar). PCA is
completely non-parametric and there is no
assumption on the structure of a model. We will say
that the new axis set is discovered in the case of
PCA. Note that this is different from Fourier based
techniques where the axes onto which the data are
projected, are fixed. Therefore with PCA, the new
basis depends completely on the structure of the data
being analyzed and the founded basis function with
PCA may overlap in the frequency domain (
Gari D.
Clifford). PCA and ICA are named techniques
of blind source separation (BSS). 'Blind' expresses
that the new axes on which the data are projected are
completely determined by the data i.e without prior
knowledge of the data structure (
Gari D. Clifford).
Joachim et al (Joachim.behar) have projected the
ECG sample onto the new set of axes determined by
PCA, separate signal and noise component within
this new domain before projecting back the signal to
the original space.
PCA identifies the most 'meaningful' basis in
which to re-express our data set; the aim consists in
minimizing redundancy, measured by the covariance
magnitude, and to maximize the signal that is
measured by the variance (
Shlens, Jonathan, 2009).
PCA assumes (Joachim.behar):
Linearity.
Large variance represents interesting
structure; which means that we suppose
that the SNR is high enough such that the
signal is associated with principal
components having a high variance and
noise with components having a lower
BIOSIGNALS2015-InternationalConferenceonBio-inspiredSystemsandSignalProcessing
120
variance.
Principal components are orthogonal.
In order to find the principal components of a
multidimensional signal, one can use singular value
decomposition (SVD). Suppose X is an NM real
observation matrix that can be decomposed as
follow:
XUSV
(1)
Where is an diagonal matrixwith
nonnegative real numbers on the diagonal;
,
,
,…,
with
and where a
common convention is to list the singular values
in descending order. The smallers the
are, the
smaller the amount of energy carried along the
corresponding eigenvector. Therefore, small
eigenvalues are frequently associated with the noise
(Gari D. Clifford, 2006). is an matrix of
column vectors corresponding to the eigenvectors of
the covariance matrix
and which constitutes a
new Basis
(Joachim Behar). The matrix is of
dimension and it is a matrix of projections of
onto the eigenvectors of (Golub, G. H., 1989).
In this section we start with an example taken
from (Joachim Behar) where N2 (in other word,
just two ECG cycles are considered) and M 240
(i.e we have 240 data points per ECG cycle). The
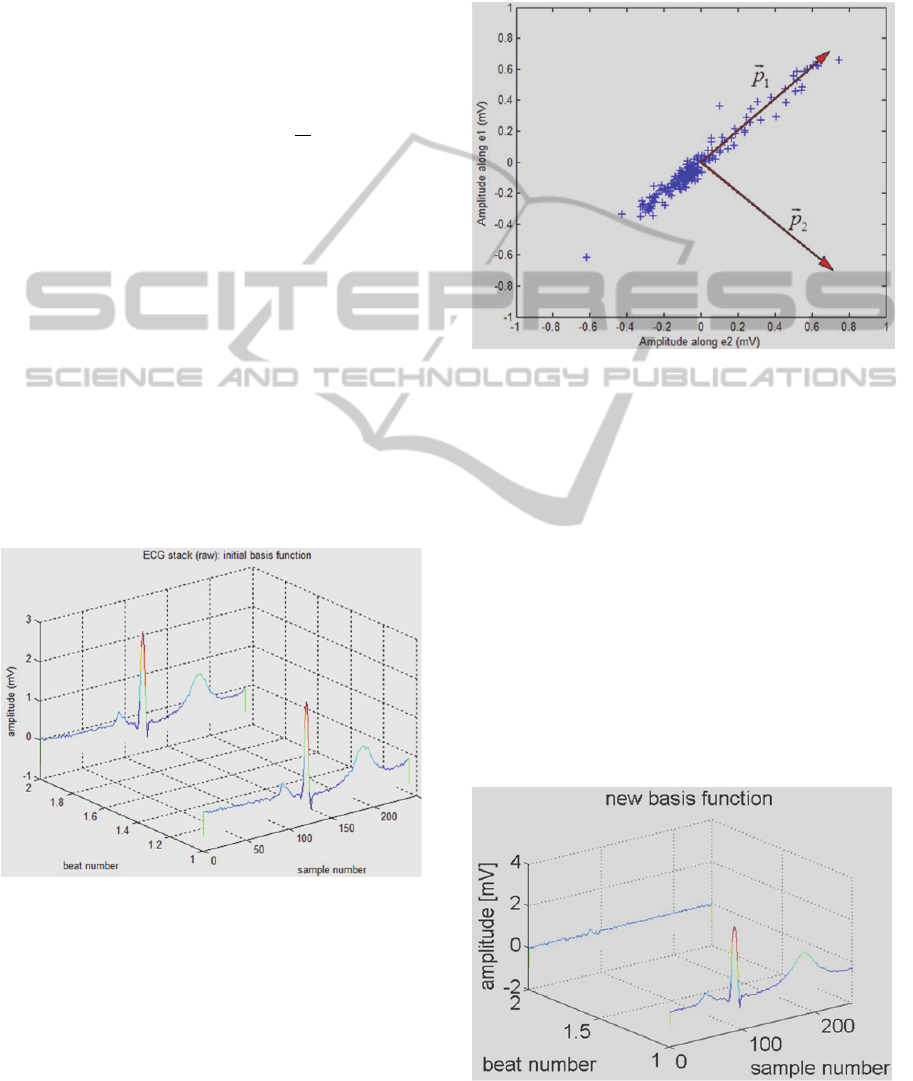
cycles are represented as a stack (Fig.1.).
Figure 1: Plot of the basis functions expressed in B
(joachim.behar).
For building this stack, QRS detection is
performed on the initial ECG sample (this detection
was performed by using a Pan and Tompkins
algorithm for example (Pan, Jiapu,
1985
) which is
then 'cut' into its different cycles. The initial ECG
stack can be seen as observations (over time) of the
same state
variable but along two different axes. The
initial basis is B
e
,e
and the basis
found by
PCA
is B
p
,p
. If we represent the initial data
onto a plot which axis are directed
against e
and e
respectively then the blue points
are obtained on Fig.2.
Figure 2: Plot of the first ECG cycle against the second
ECG cycle (joachim.behar).
Note that if the two cycles were precisely the
same then all the points would be aligned. Then the
PCA is applied for finding the most representative
manner of the data representing:
The red arrows on the plot represent the principal
components that PCA finds (2 in our case since
N2). Note that the founded axis for B′ are
orthogonal as expected. Again the purpose with
PCA consists in minimizing redundancy, measured
by the covariance magnitude, and maximizing the
signal, measured by the variance. As we can see this
is what we can obtain by determining p
and p
.
The data are now represented within this new set
of axis directed along p1 and p2 (i.e the observations
are projected onto the new basis B′) to obtain Fig.3.
Figure 3: Plot of the basis functions in B′ (joachim.behar).
ECGDenoisingbasedonPCAandusingRPeaksDetection
121
The first basis function (along p1) carries the signal
information while the second basis function
(along p2) would be considered as carrying the
residual information which in our case will be
attributed to process and observation noise. Note
that each slice of the initial stack (here N=1 or N=2)
is a linear combination of the slices expressed in B′.
The next step consists in suppressing the noisy
component(s) in the domain found by PCA and then
project back the signal to the original space B. It is
therefore expected that the signal will be retrieved in
the original space will be 'cleaner'. On this example
(Joachim behar) and as we are only dealing
with N=2 then we only keep the first principal
component in B′ before projecting back onto B. As
this is not very representative with N=2, we will see
what kind of results are obtained on an example with
higher dimensionality.
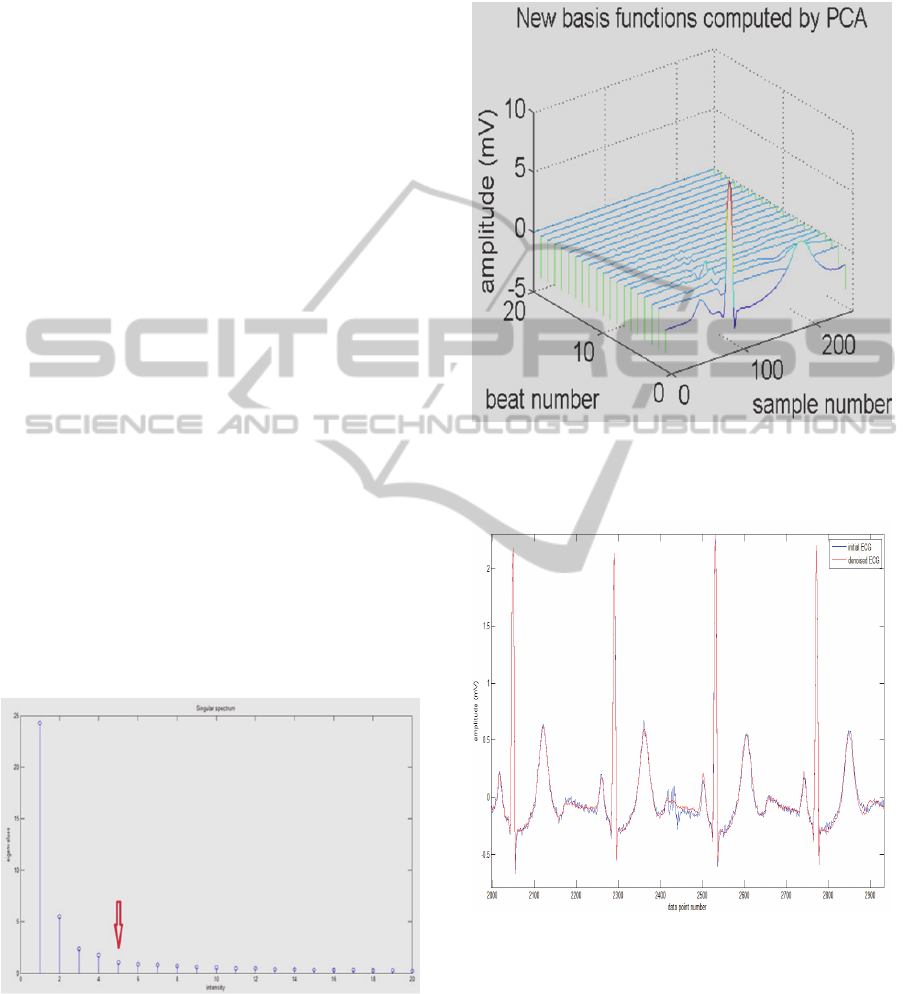
A stack of 20 ECGs cycles is considered and
represented in Fig.4. PCA is applied in order to find
the new basis B′ which cardinality is equal to 20. A
singular value is associated to each vector which
constitutes the basis and represents the energy
amount that is carried out by the corresponding
vector (Fig.4.). Suppose that the signal is
represented by the vectors having the highest
singular values we filter our data in the B′ domain
by just conserving the five most representative
principal components. Generally the signal/noise
boundary will be taken to be at the knee of the
eigenspectrum (P. Karthikeyan, 2012). Fig.4.
indicates 'how much' those vectors contribute to the
raw signal and Fig.5. shows the data projected onto
the new axis.
Figure 4: Discovered principal components
(joachim.behar).
The only the first five principal components are
kept in this case since they contain most of the
energy (fig.4).
As we can see the signal is cleaner than what it
was initially. Finally Fig.6. shows a few ECG cycles
from the initial sample and the corresponding PCA
filtered cycles.
Figure 5: ECG stack after filtering by keeping only the
first 5 principal components within the B′ domain
(Joachim Behar).
Figure 6: A few ECG cycles after backprojection and
reconstruction from the ECG stack (Joachim Behar).
2.2 Modulus Maxima
Wavelet modulus maxima are used to locate
characterizing singularities in the signal. Let wf
x
is the wavelet transform of a function f
x
then we
have:
BIOSIGNALS2015-InternationalConferenceonBio-inspiredSystemsandSignalProcessing
122
Any point
such that
has a zero
crossing at
is named a local
extremum; when varies.
Any point
such that
|
|
|
|
when belongs to the other side
of the neighborhood of
and
|
|
|
|
when belongs to either a right
or left neighborhood of
is named
modulus maximum.
Any corrected curve in the scale space
along which all points are modulus maxima
is called maxima line (
Samar Krimi, 2005
).
2.3 Multiscale Products
The singularity detection can be performed via the
product of the wavelet coefficients instead of local
maxima of the wavelet coefficients. Rosenfeld and
Cowoerkers suggested forming multiscale pointwise
products (A. Rosenfeld, 1970; B. M. Sadler, 1999).
This is intended to enhance multiscale peaks due to
edges, while cancelling noise, by exploiting the
multiscale correlation due to the desired signal
presence. The multiscale product of the first k scales
is expressed as follow:
∏
∏
(2)
The maxima in W
x
n
due to edges in x
n
will tend to propagate across scales; so that p
n
will tend to reinforce the signal response and not the
noise.
2.4 R Peaks Detection
In this paper, we propose a new method of R-peaks
detection based on undecimated wavelet transform
by using multi-scale product and modulus maxima.
The different steps of this method are:
Apply the undecimated wavelet transform
to the ECG signal.
Compute a multi-scale product,
from
the product of undecimated wavelet
coefficients,
,
,
of successive scales
(scale 1, scale 2, scale 3) as follow:
∙
∙
(3)
Compute the modulus maxima of p
.
Extract the R peaks of the
ECG signal.
For determining the modulus maxima of the
multi-scale product p
, we need to compute a
threshold thr. For this, we have applied in this work
the rule of Donho (D. L. Donoho, I. M. Johnstone,
G. Kerkyacharian, 1995
,
D. L. Donoho and I. M.
Johnstone, 1995) which is used for calculating the
global threshold. Hence, we have used in this work,
the following expression to compute this thr:
∙
2 ∙ log
(4)
With:
/0.6745
(5)
where MAD represents the median.
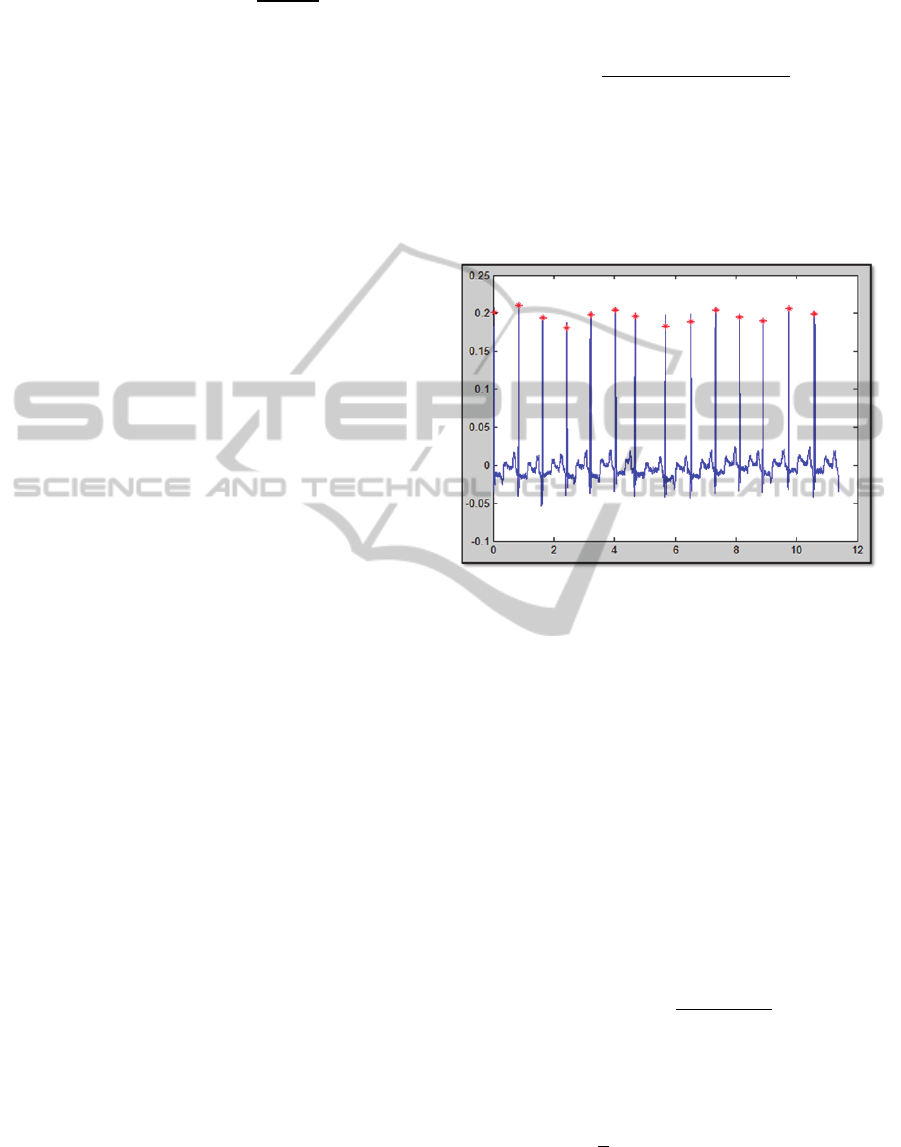
Here is an example of R peaks detection using
the proposed technique (Fig.8.).
Figure 8: An example of R peaks detection using the
proposed technique.
This figure shows the marked R-peaks using the
proposed technique.
2.5 Evaluation Criteria
The evaluation of the proposed ECG denoising
technique is performed by comparing it to the
denoising technique based on PCA which applied to
the entire noisy ECG signal. The two techniques are
tested on four noisy ECG signals taken from MIT-
BIH database. The used criteria in this evaluation are
the SNR improvement and the mean square error
(MSE). These criteria are expressed as follow:
imp
dB
SNR
SNR
10∙log
∑|
|
∑|
|
(6)
Where s, s
and s
are respectively the clean, the
noisy and the denoised signals.
MSE Es
n
s
n
∑
s
n
s
n
(7)
Where s
n
and s
n
are respectively the clean and
the denoised signal.
ECGDenoisingbasedonPCAandusingRPeaksDetection
123
3 RESULTS AND DISCUSSION
In Tables 1 and 2, are reported the results obtained
from SNR improvement and MSE computation and
this for the two techniques (the proposed technique
and the denoising technique based on PCA applied
on the entire ECG).
Table 1: SNR improvement computation in case of ECG
signal 103.
Signal: 103
imp
dB
SNRi
(dB)
The proposed
Technique
Entire ECG
denoising technique
based on PCA
-5 10.1452 9.5192
0 11.9834 12.2626
5 12.8148 12.8499
10 13.1325 13.5676
15 12.1903 13.8807
Table 2: MSE computation in case of ECG signal 103.
Signal: 103
MSE
SNRi
The proposed
Technique
Entire ECG
denoising using
PCA
-5 0.0064 0.0074
0 0.0012 0.0013
5 3.3973e-04 3.2636e-04
10 1.0164e-04 9.3075e-05
15 3.9933e-05 2.7020e-05
These obtained results (Tables 1 and 2) show
clearly that the denoising technique based on PCA
and applied to the entire noisy ECG, is slightly
better than the proposed technique. However, the
advantage of the proposed technique consists in
working in real time.
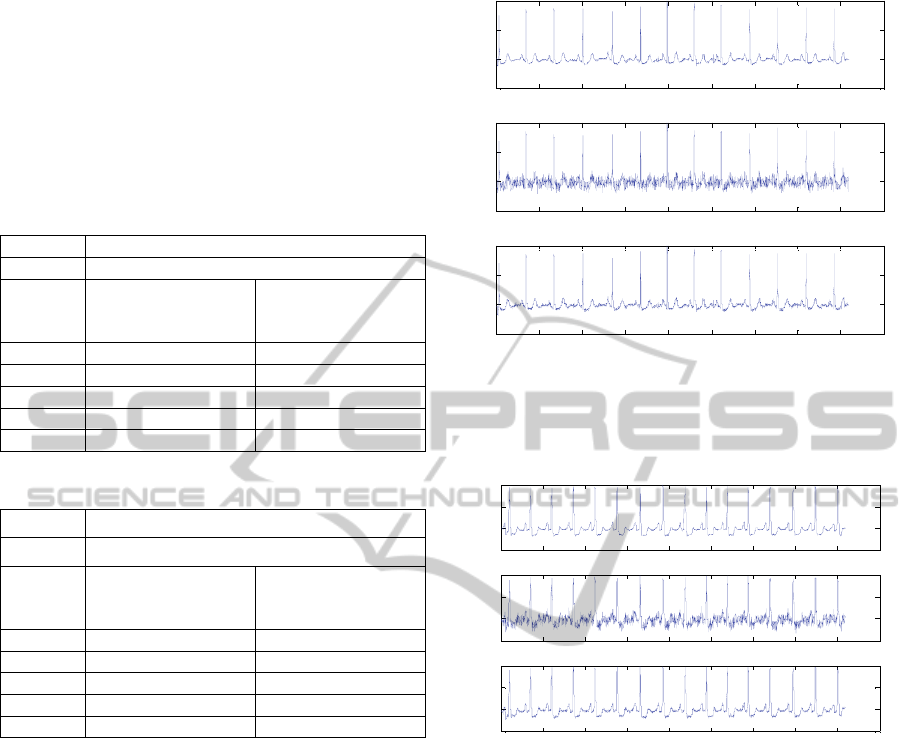
Figures 9 and 10 illustrates two examples of
ECG denoising using the proposed.technique.
5 CONCLUSIONS
In this paper, we have proposed a new ECG
denoising technique based on Principal Component
Analysis (PCA). This technique consists at first step
in cutting the noisy ECG signal into frames where
each frame is located between two successive R-
peaks. Then the denoising is performed frame by
frame and the denoised ECG signal is obtained by
concatenating the different denoised frames. In our
evaluation, we have compared the proposed
Figure 9: Noisy ECG signal (101 corrupted by Gaussian
White Noise with SNR= 7.3835) denoised by the proposed
technique to obtain a denoised ECG signal with SNR=
19.2953.
Figure 10: Noisy ECG signal (105 corrupted by Gaussian
White Noise with SNR= 10.6282) denoised by the
proposed technique to obtain a denoised ECG signal with
SNR= 21.3125.
technique to the denoising technique based on PCA
and applied to the entire noisy ECG signal. This
comparison is performed by the SNR improvement
(imp(dB)) and the Mean Square Error (MSE)
computations. The obtained results from this
evaluation show clearly that the denoising technique
based on PCA and applied to the entire noisy ECG,
is slightly better than the proposed technique but the
advantage of the proposed technique lies in working
in real-time.
REFERENCES
A. Rosenfeld, “A nonlinear edge detection techniques,”
Processing of the IEEE, pp. 814–816, 1970.
0 500 1000 1500 2000 2500 3000 3500 4000 450
0
-0.5
0
0.5
1
0 500 1000 1500 2000 2500 3000 3500 4000 450
0
-0.5
0
0.5
1
0 500 1000 1500 2000 2500 3000 3500 4000 450
0
-0.5
0
0.5
1
0 500 1000 1500 2000 2500 3000 3500 4000 4500
-0.5
0
0.5
1
0 500 1000 1500 2000 2500 3000 3500 4000 4500
-0.5
0
0.5
1
0 500 1000 1500 2000 2500 3000 3500 4000 4500
-0.5
0
0.5
1
BIOSIGNALS2015-InternationalConferenceonBio-inspiredSystemsandSignalProcessing
124

A. Blanco, S. Kochen, O.A. Rosso, P. Salgado, Applying
time-frequency analysis to seizure EEG activity, IEEE
EMBS Magazine, 16(1):64-71, 1997.
B. Babloyantz, P. Maurer, A graphical representation of
local correlations in time series - assessment of cardiac
dynamics, Physics Letters A, 221:43-55, 1996.
B. M. Sadler and A. Swami, “Analysis of multiscale
products for step detection and estimation,” IEEE
Transactions on Information Theory, vol. 45, no. 3,
pp. 1043–1051, 1999.
D. L. Donoho, I. M. Johnstone, G. Kerkyacharian, and D.
Picard, “Wavelet shrinkage: Asymptopia?,” Journal of
the Royal Statistics Society, vol. 57, pp. 301–369,
1995.
D. L. Donoho and I. M. Johnstone, “Adapting to unknown
smoothness via wavelet shrinkage,” Journal of the
American Statistical Association, vol. 90, no. 432, pp.
1200–1224, 1995.
D. Dobrev, et al., "Digital lock-in techniques for adaptive
power-line interference extraction," Physiol. Meas.
,Vol. 29 pp. 803–816, 2008.
E.-S. El-Dahshan, "Genetic algorithm and wavelet hybrid
scheme for ECG signal denoising,"
Telecommunication Systems, vol. 46, pp. 209-215,
2010.
Er. Manpreet Kaur, ‘‘Adaptive Wavelet Thresholding for
Noise reduction in Electrocardiogram (ECG)
Signals,’’International Journal of Communication and
Networking System,Vol: 03, June 2014, Pages: 261-
266.
F. Chang, et al., "Evaluation Measures for Adaptive PLI
Filters in ECG Signal Processing," Computers in
Cardiology, vol. 34, p. 529−532, 2007.
Gari D. Clifford. Singular Value Decomposition and
Independent Component Analysis for Blind Source
Separation. Online resource:
http://www.mit.edu/~gari/teaching/6.222j/ICASVDnot
es.pdf.
Gari D. Clifford, Francisco Azuaje and Patrik McSharry.
Advanced Methods and Tools for ECG Data Analysis.
Artech House. 2006.
Golub, G. H., and C. F. Van Loan, Matrix Computation,
2nd ed., Oxford, U.K.: North Oxford Academic, 1989.
I. Romero, ‘‘PCA-based Noise Reduction in Ambulatory
ECGs,’’ IMEC, Eindhoven, the Netherlands,
http://cinc.mit.edu/current/preprints/112.pdf.
Joachim Behar.
http://joachim.behar.perso.neuf.fr/Joachim/ECG_tuto_3.p
hp.
K. M. Chang and S. H. Liu, “Gaussian noise filtering from
ECG by Wiener filter and ensemble empirical mode
decomposition,” Journal of Signal Processing
Systems, vol. 64, no. 2, pp. 249–264, 2011.
Lei Lei, Chao Wang, and Xin Liu, ‘‘Discrete Wavelet
Transform Decomposition Level Determination
Exploiting Sparseness Measurement,’’ World
Academy of Science, Engineering and Technology,
International Journal of Electrical, Robotics,
Electronics and Communications Engineering Vol:7
No:9, 2013.
M. Benmaiekl, et al. (2010 Preprocessing of the ECG
Signals Using the His-Purkinje Fractal System. IEEE,
7th International Multi-Conference on Systems,
Signals and Devices.
M. P. S. Chawla, H. K. Verma, and V. Kumar, “Artifacts
and noise removal in electrocardiograms using
independent component analysis,” International
Journal of Cardiology, vol. 129, no. 2, pp. 278–281,
2008.
M. C.B, et al., "Processing ECG Signal with Kaiser
Window- Based FIR Digital Filters " International
Journal of Engineering Science and Technology
(IJEST), vol. 3, pp. 6775 - 6783, 2011.
P. Karthikeyan, M. Murugappan, and S.Yaacob, ‘‘ECG
Signal Denoising Using Wavelet Thresholding
Techniques in Human Stress Assessment,’’
International Journal on Electrical Engineering and
Informatics, Volume 4, Number 2, July 2012.
Pan, Jiapu, Tompkins, Willis J. A, ‘‘Real-Time QRS
Detection Algorithm,’’ Biomedical Engineering, IEEE
Transactions on Volume: BME-32 , Issue: 3
Publication Year: 1985 , Page(s): 230 - 236.
S. C. Mahesh, et al., "Suppression of noise in the ECG
signal using digital IIR filter," presented at the
proceedings of the 8th WSEAS International
Conference on Multimedia systems and signal
processing, Hangzhou, China, 2008.
S. M. M. Martens, et al., "An Improved Adaptive Power
Line Interference Canceller for Electrocardiography,"
IEEE Transactions on Biomedical Engineering, vol.
53, pp. 2220-2231 2006.
S. G. Tareen, "Removal of Power Line Interference and
other Single Frequency Tones from Signals," MSc,
Computer Science and Electronics, Mälardalen
University, sweedan, 2008.
Shlens, Jonathan. 2009. “A tutorial on principal
component analysis.” Online N ote:
http://www.snl.salk.edu/"shlens/pca.pdf. Accessed
June 2010. http://www.snl.salk.edu/~shlens/pca.pdf.
Samar Krimi, kais ouni, and Noureddine Ellouze, “TWave
Detection Based on an An Adjusted Wavelet
Transform Modulus Maxima”, International Journal of
Biological and Life Sciences, v1, 2005, pp. 128-132.
Taigang He, Gari Clifford and Lionel Tarassenko,
"Application of independent component analysis in
removing artefacts from the electrocardiogram,"
Neural Computing & Applications, Vol. 15, pp.
105-116, 2006.
ECGDenoisingbasedonPCAandusingRPeaksDetection
125
