
Entry Point Matters
Effective Introduction of Innovation in Social Networks
Ramón Hermoso
1
and Maria Fasli
2
1
Department of Computer Science and Systems Engineering, University of Zaragoza,
María de Luna 1, 50018, Zaragoza, Spain
2
School of Computer Science and Electronic Engineering, University of Essex Wivenhoe Park, Colchester CO4 3SQ, U.K.
Keywords:
Artificial Societies, Social Networks, Innovation, Entry Point.
Abstract:
Social networks have grown massively in the last few years and have become a lot more than mere message
exchange platforms. Apart from serving purposes such as linking friends and family, job linking or news
feeding, their nearly pervasive nature and presence in day-to-day activities make them the biggest potential
market and access platform to hundreds of millions of customers ever built. Faced with such a complex
and challenging environment, we claim that introducing innovation in an efficient way in such networks is
of extreme importance. In this paper, we put forward a mechanism to select suitable entry points in the
network to introduce the innovation, so fostering its acceptance and enhancing its diffusion. To do this, we
use the underlying structure of the network as well as the influencing power some users exercise over others.
We present results of testing our approach with both a Facebook dataset and different examples of random
networks.
1 INTRODUCTION
Social networks have grown to become very complex
systems in which individual users, groups, compa-
nies and other organisations are represented as enti-
ties, and relationships among them denote a certain
affinity, e.g. friendship, co-working, similar prefer-
ences and tastes, and so on. Hundreds of millions of
people are involved in these networks and they prob-
ably form the largest potential market ever to have
emerged. It is for this reason that introducing inno-
vation in such networks turns out to be fundamental
for boosting firms’ income and profits or, at least, for
maintaining them. Nevertheless, despite the poten-
tial to provide access to hundreds of millions of cus-
tomers, due to their complex nature, social networks
have not shown yet their full potential as a market-
place.
Innovation is considered as a key point for the es-
tablishment and growth of any firm (Calantone et al.,
2002). However, the introduction of innovation in
a market has typically been considered as a leap of
faith, since no technique can guarantee its success.
Although there exist different market techniques and
models that help to shed light on the process, the ma-
jority of them are mostly ad-hoc solutions that may
apply to particular types of products or specific mar-
kets. There is considerable literature on this topic,
with most opinions agreeing on the two main charac-
teristics that more significantly and effectively affect
an innovation’s success: adoption and diffusion. Sem-
inal works by Bass (Bass, 1969) and Rogers (Rogers,
1995) have progressed on the field, but they are ori-
ented towards traditional markets. The emphasis of
these works is on what happens once innovation is
introduced in a market, but they do not examine what
could be the best entry points to initiate product adop-
tion and diffusion or how a firm would be able to iden-
tify these and/or choose among them.
With the emergence of the Internet, the nature
of markets has changed dramatically and new ways
of introducing innovations in a market have been
brought into play. In particular, introducing innova-
tion through social networks requires a more effec-
tive way of introducing new products by identifying
the best or more appropriate entry points for doing
so. In this paper, we suggest that in addition to de-
veloping and analysing new techniques for innovation
diffusion for different types of products and markets
– which has been the subject of work over the last
decades – it is also important to focus on identifying
the best or key entry points from which the innovation
adoption and diffusion processes can be initiated. For
social networks, this means looking at their inherent
17
Hermoso R. and Fasli M..
Entry Point Matters - Effective Introduction of Innovation in Social Networks.
DOI: 10.5220/0005172700170026
In Proceedings of the International Conference on Agents and Artificial Intelligence (ICAART-2015), pages 17-26
ISBN: 978-989-758-074-1
Copyright
c
2015 SCITEPRESS (Science and Technology Publications, Lda.)

structure and other characteristics that may enable us
to identify key entry points that we would want to use
to introduce the innovation into.
The aim of this paper is to provide a mechanism
able to identify suitable entry points for the innova-
tion in the social network in order to achieve a more
efficient early adoption of the innovation, in terms of
cost, rate of adoption and subsequent benefits to the
firm introducing it. We claim that the network’s un-
derlying structure can be analysed in order to deter-
mine the most promising entry points for introduc-
ing an innovation; that is, which individuals would
be the first ones in adopting the innovation and also
which of them will contribute to its more effective
and wide diffusion. Our mechanism relies on min-
ing the underlying structure of the network, as well as
on the power of influence some users have on others.
We present a set of experiments based on a Facebook
dataset (McAuley and Leskovec, 2012) that shows the
effects of deploying our mechanism when applied to
it. Moreover, we also present the results of applying
the mechanism to different random networks with dif-
ferent properties.
The paper is structured as follows: Section 2 de-
scribes the model of the network. Then we present
our mechanism in Section 3. In Section 4, we show
an empirical evaluation of our approach. We review
the work in the literature and compare to our approach
in Section 5. Finally, we sum up our work and sketch
different lines of future work in Section 6.
2 NETWORK AND INDIVIDUAL
MODEL
This section presents a model for the social network,
as well as a model for the innovation adoption of the
user.
2.1 Social Network Model
A social network Ω can be modelled as a directed
graph G
Ω
= (V,E), in which V corresponds to a set
of users and E is a set of edges representing rela-
tionships in Ω. Let (v
i
,v
j
) ∈ E, with v
i
,v
j
∈ V, an
edge in G
Ω
representing a relationship from v
i
to
v
j
. These relationships might denote, for example,
follower-followee relations (e.g. Twitter), friendship
(e.g. Facebook), job links (e.g. LinkedIn), and so on.
The neighbourhood of a user is denoted as a function
neigh(v
i
) = {v
j
} iff. ∀v
j
∃(v
i
,v
j
) ∈ E.
We assume that neighbours can communicate with
each other if there exists a link between them. As we
are dealing with directed graphs to represent the net-
work structure, if user v
i
wants to communicate with
v
j
then there must exist a link (v
i
,v
j
) ∈ E. Users com-
municate the innovations they adopt to the users they
are connected to, that is, to their neighbours. We call
this communication a signal. Users communicate sig-
nals right after they have adopted an innovation. A
signal sent by user v
i
- right after adopting a certain
innovation k - to another user v
j
is denoted by σ
k
v
i
→v
j
.
We assume a signal σ
k
is broadcasted by the user to
all its neighbours when adopting the innovation k.
There are concrete examples of this direction in
real world networks. For instance, in Twitter, when
users tweet messages, these are broadcasted to every
follower the user has, while in Facebook, messages
left by a user on his/her wall are typically visible, at
least, to his/her friends. Figure 1 depicts this process.
Thus, signals may cover a wide range of types of in-
formation, from text messages to videos, SMS mes-
sages, and so on, depending on the social network un-
der study.
σ
k
σ
k
σ
k
σ
k
Figure 1: Signal propagation after innovation adoption.
2.2 Agents in Play
There are three different types of stakeholders in our
model.
• Users (S): are typical agents in a social network
that may or may not adopt an innovation and, if
so, spread it through to their neighbours.
• Innovation creators (IC): are agents that create
innovation (e.g. companies).
• Network explorers (NE): these agents are man-
aged and deployed by the ICs and they are respon-
sible for exploring the network to identify promis-
ing users through which to introduce the innova-
tion into the network.
2.3 User behavioural Model
When a user receives a signal about an innovation, it
ICAART2015-InternationalConferenceonAgentsandArtificialIntelligence
18

reasons about the opportunity of adopting it and even-
tually has to come to a decision: adopt or not adopt.
We consider users as rational entities. In order to
model this reasoning process of adoption, we adapt
the model proposed by Bass (Bass, 1969). In the Bass
Model (BM), the probability of innovation adoption
of a user is calculated as follows:
A
k
(t) = p +
q
N
· N
k
(t) (1)
where, p is the coefficient of innovation or how inno-
vative the user is, q stands for the coefficient of imita-
tion or how the user is affected by others’ adoptions,
N
k
(t) is the total number of adopters up to time t, and
N is the total number of potential product buyers.
In our case, we regard users as only having a par-
tial view of the network, i.e. they only have knowl-
edge about their neighbours. Note that since we con-
sider that different innovations may take place at the
same time, A
k
denotes the probability of adopting in-
novation k, while N
k
is the number of neighbours that
have already adopted the specific innovation k.
We assume that any link in the social network en-
tails some sort of influencing power among the users.
For instance, in Twitter, the action of following some-
one means the followed has power over the follower,
the former is somehow appealing to or influential on
the latter. However, there exist other types of social
networks in which this is not so clear. An example
of this is Facebook, in which friendship acceptance
brings about two new links in the network (recall that
links are unidirectional). Although, in this case, it is a
bit blurrier what type of power holds behind a virtual
friendship, it must exist in both directions, otherwise
the friendship link would not have been established.
In some social networks, users may be analysed in
terms of profile features. For example, in Facebook,
there is a check list of different preferences, regarding
sentimental status, political view, religion, and so on,
that users fill in to complete their profiles.
Besides the inherent relation given by the link be-
tween two users in the social network, profiles could
be utilised to obtain similarity measures among in-
dividuals since common interests usually foster the
innovation adoption. In order to include similarity
between users into the model, we extend equation 1
to represent the probability of adoption. Given a re-
ceived signal σ
k
v
i
→·
the resulting function is presented
in equation 2.
A
k
(t) = α· p+β·
q
|neigh(·)|
· N
k
neigh(·)
(t)
+γ·sim(·,v
i
)
(2)
where N
k
neigh(·)
(t) is the number of neighbours that al-
ready adopted the innovation up to time t
1
. Param-
1
The notation (·) refers to the user doing the calculation.
eter α determines the sensitivity of the user to inter-
nal forces (coefficient of innovation) versus external
forces (coefficient of imitation) to adopt the innova-
tion (parameter β). γ represents the degree of belief
the user has on the importance of the similarity re-
garding his/her neighbours. Note that α+β+γ = 1 is
a requirement of the model.
We call this the Adapted Bass Model (A-BM)
which attempts to add similarity between users into
the probability of adopting the innovation. Note that
this function can cover different types of social net-
works. While in Facebook similarity is easily ob-
tained if we have access to the users’ profiles, in Twit-
ter there is no such notion of profile features (γ = 0).
User profiles can be represented as an n-
dimensional preference vector ρ
v
i
= (ρ
v
i
1
,ρ
v
i
2
,...,ρ
v
i
n
)
with ρ
v
i
j
∈ {0,1} denoting the user v
i
presents this
feature (with 1) or it does not (with 0). We calculate
similarity (sim function in eq. 2) by using the Tani-
moto similarity index (Tanimoto, 1958). This func-
tion is typically used to compare chemical molecules
that can be represented with an array of binary ele-
ments in chemical processes. Since ρ
v
i
profiles are
binary arrays, this index appears to be an efficient way
to calculate similarity, but other methods could be po-
tentially used here depending on the complexity and
representation of the profile. Let users u and v be rep-
resented by bitmaps ρ
u
and ρ
v
, ρ
u
i
and ρ
v
i
be the i-th
bit of ρ
u
and ρ
v
, respectively. Let ∧ , ∨ be bitwise
and and or operators respectively. Thus the Tanimoto
similarity index is given by equation 3.
sim(u,v) =
∑
i
ρ
u
i
∧ ρ
v
i
∑
i
ρ
u
i
∨ ρ
v
i
(3)
We assume that the contact between an IC and a
user to introduce a certain innovation k into the net-
work has an associated cost for the IC given by equa-
tion 4:
c(k) = c
1
+ c
2
(4)
c
1
∈ R represents the cost for advertising the inno-
vation (send the signal to a user) and c
2
is the cost
associated with the consumed resources, i.e. the cost
of the incentive, used by the IC to persuade a user to
adopt the innovation. c
2
= 0 represents no need for
incentives. c
2
may be obtained with a function taking
into account the relative importance of the user in the
network. We define an example of this type of func-
tion in Section 4 when setting up a test scenario for
empirical evaluation. Note that the cost is only ap-
plicable when there exists any sort of communication
between the IC and a user selected as entry point; the
diffusion phase does not have any cost for the IC.
EntryPointMatters-EffectiveIntroductionofInnovationinSocialNetworks
19

3 SISM MECHANISM
This section presents a novel mechanism that aims to
identify and choose suitable entry points for innova-
tion in a social network. Given an innovation issued
by an IC, the mechanism will address the problem of
how to identify promising entry points for the innova-
tion into the network, in order to achieve an as wide
as possible diffusion of it. To this end, the mechanism
relies on the identification of well positioned users in
the network (from a structural perspective), as well as
on the power that users exhibit when influencing oth-
ers. The former is related to the position a user has in
the network (from a structural point of view) (Gold-
enberg et al., 2009), while the latter is related to the
ability a user has to exercise influence over another
user to make her adopt an innovation (Fasli, 2006).
Since diffusion depends on the users’ acceptance of
the innovation, in this paper we focus on the inno-
vation seeding, which is the only process the IC has
control over. We call our approach Social Innovation
Seeding Mechanism (from now on SISM).
3.1 Identifying Hubs
We use different measures from social networks to in-
fer which are the most promising users to introduce
the innovation into the network. These measures are
related to the well-studied property of centrality in the
literature. The concept of centrality encapsulates “mi-
cro” measures that allow us to compare nodes and to
say something about how a given node relates to the
overall network (Jackson, 2008). The centrality of a
node gives us information about the position an indi-
vidual holds in the network. Many different measures
of centrality have been developed, and they each tend
to capture different aspects of the position that a node
has, which can be useful when working with infor-
mation flows, bargaining power, infection transmis-
sion, influence and other important behaviours in a
network. We use the following centrality measures to
identify hubs:
Degree: it represents the number of links that a node
has. Equation 5 defines this function.
DC
v
i
=
d(v
i
)
|V | − 1
(5)
where d(v
i
) denotes the out-degree of node v
i
in the
network.
Closeness: it is defined as how close a given node is
to any other node in the network. Mathematically it
is represented as the inverse of the average distance
between a user v
i
∈ V and any other user v
j
∈ V . It is
formally defined in equation 6.
CC
v
i
=
|V | − 1
∑
v
i
6=v
j
sp(v
i
,v
j
)
(6)
where sp(v
i
,v
j
) is the shortest path between node v
i
and v
j
.
Betweenness: it is a measure based on how well a
user is situated on the paths it lies on (Freeman, 1977).
Let np(v
j
,v
k
) be the number of paths between v
j
∈ V
and v
k
∈ V and np
v
i
(v
j
,v
k
) the number of paths be-
tween v
j
and v
k
on which v
i
∈ V lies on. Then we
obtain the centrality of node v
i
in terms of connecting
v
j
and v
k
as the ratio
np
v
i
(v
j
,v
k
)
np(v
j
,v
k
)
Generalising to obtain the betweenness centrality of
node v
i
we obtain equation 7.
BC
v
i
=
∑
v
j
6=v
k
6=v
i
np
v
i
(v
j
,n
k
)/np(v
j
,v
k
)
(|V | − 1) · (|V | − 2)/2
(7)
The mechanism will use one of these measures
in order to identify a ranking of “central” users that
essentially comprise hubs in the network. The IC
will then decide which users in the top ranking to
approach in order to introduce the innovation.
3.2 Identifying Power
Now we put forward a method to investigate the
power that a subset of selected hubs (typically the
top ones in the aforementioned ranking) exercise on
others. In this approach, we adhere to the notion of
referent power (Fasli, 2006), as power deriving from
identification. We say a user v
i
has power
2
on user v
j
iff. there exists a connection (v
i
,v
j
) ∈ E and, when
v
i
sends a signal σ
k
v
i
→v
j
user v
j
subsequently always
adopts innovation k. Then, we can say user v
i
some-
how influences v
j
to adopt k.
In order to calculate the power of a user in the
network, we will use the so-called network explorers
(NEs). As we pointed out in Section 2.1, this type of
agent is deployed by innovation creators (ICs) with
the aim of assessing the power that users have on oth-
ers. The IC will add an NE in the network connecting
it to a relevant user in order to monitor and calculate
an estimate of the latter’s power. Note that in some
types of networks this process may be more complex,
2
For clarity we use power to refer to referent power.
ICAART2015-InternationalConferenceonAgentsandArtificialIntelligence
20

since the connection to the network requires the ap-
proval from the other side, i.e. an acceptance from a
user already in the network (e.g. LinkedIn). We as-
sume NEs can always connect to a selected user or,
at least can monitor her signals. Algorithms 1 and
2 provide the steps for the power estimation. In Al-
gorithm 1, in order to examine the power user v
i
has
in the network we add an NE v
exp
and connect it to
v
i
(line 1). Once this initial connection is made, our
algorithm also connects v
exp
to all of v
i
’s neighbours
(lines 2–4). Our intention with this step is for v
exp
to be aware of the signals sent by v
i
when adopting
an innovation but also the signals emanating from its
neighbours so that we can track the power of influence
on them. Algorithm 2 presents a method to calculate
the power of a user v
i
by taking advantage of the con-
nections made in Algorithm 1 (line 1).
Algorithm 1: connectExplorer(·) algorithm that introduces
the explorer into the network.
Require: v
exp
∈ NE, v
i
∈ V the user whose power is
estimated
1: E ← E ∪ (v
i
,v
exp
)
2: for each v
j
in neigh(v
i
) do
3: E ← E ∪ (v
j
,v
exp
)
4: end for
Firstly, the explorer v
exp
waits to listen for any
signal (line 2). When v
exp
receives a signal from v
i
(line 5), that necessarily implies that neighbours re-
ceived it as well. Therefore, each neighbour, as ex-
plained in Section 2.3, must decide if it accepts or
not the innovation signalled by v
i
. If the innovation
is accepted, a new signal will be forwarded, and so
received by v
exp
(line 7). Explorer v
exp
will anno-
tate different signals received from v
i
’s neighbours
(line 8). We then calculate the ratio of adopted in-
novations after v
i
’s signal (line 10). Finally the algo-
rithm returns a value of power as a linear combination
of past influence calculated for v
i
and the influence ra-
tio calculated (line 15). Parameter δ represents sensi-
tivity of past influence in contrast to new one. At this
point, an important feature to remark in the approach
is that influence assessment is very much dependent
on the position of the user in the network. That is,
the same user in another location may result in exer-
cising very different influence on its neighbours. This
occurs because it is the recipient user the one that de-
cides whether to adopt or not the innovation. In other
words, the influencer’s power arises from the neigh-
bours around it, which are biased to be influenced,
rather than by a pro-active attitude of the influencer
to exert that power. Once v
exp
has accomplished its
task, it returns the calculated influence to the IC it be-
longs to. The IC may repeat the process with some
Algorithm 2: Power estimation using NEs.
Require: v
exp
∈ NE, v
i
∈ V the user whose power is
estimated
Require: pastIn f luence ← 0
1: connectExplorer(v
exp
,v
i
)
2: while true do
3: positive ← 0
4: newIn f luence ← 0
5: if signalReceived then
6: for each j in neigh(v
i
) do
7: if signalReceived then
8: positive + +
9: end if
10: newIn f luence ← possitive/|neigh(v
i
)|
11: end for
12: if pastIn f luence == 0 then
13: return newIn f luence
14: else
15: return δ · pastIn f luence + (1 − δ) ·
newIn f luence
16: end if
17: end if
18: end while
other users it may consider as being promising en-
try points for introducing the innovation. The IC will
eventually decide on the best entry points and send a
signal to the selected user(s).
4 EMPIRICAL EVALUATION
4.1 Basic Workings
We are interested in exploring whether SISM helps
the IC identify the best entry point for its innova-
tion and also the potential impact that the underlying
structure of the network may have on the performance
of the algorithm. In the experiments that follow, and
for simplicity and clarity, we only follow through and
show in action one IC trying to introduce sequentially
multiple innovations. Moreover we assume an IC typ-
ically deploys one NE per hub to be studied, in our
case the top 10% of ranked users returned from the
hub identification phase.
In the first time step, the IC uses one of the meth-
ods to select an entry point in the network. It then
sends a signal to the selected user with the new inno-
vation. The signalled user decides to accept the inno-
vation or not. If it accepts it (following the adoption
function in eq. 2), the user will send a signal to its
neighbours (to be considered at the next time step).
If the entry point user does not accept the innovation,
then it will be incentivized by the IC. The incentive
EntryPointMatters-EffectiveIntroductionofInnovationinSocialNetworks
21

the IC will be willing to pay is calculated following
equation c
2
=
C
pos(·)
, where pos(·) is the position of
the user in the ranking of hubs calculated by the sys-
tem, and C is a constant that may vary in different do-
mains. We set C = 1000 for this set of experiments.
So better connected users (how well-connected a user
appears to be depends on the measure used to calcu-
late this – see Section 3) will have to be paid more
since they are supposed to be more effective entry
points.The next time step starts with users process-
ing the received signals. This is repeated every time
step until no new signals are sent out, at which point
the diffusion converges.
We use two different measures in order to evalu-
ate our approach. Firstly, we are interested in measur-
ing the number of users adopting the innovation. Sec-
ondly, we attempt to measure the associated benefit of
introducing the innovation into the network following
B(k) = r × |adopters| − c(k). The r value stands for
the reward obtained by the IC after every adoption.
Although the value of r is domain dependent, as this
scenario is generic we set r = 10 for all experiments;
any other constant would have been valid as well. In
eq. 4, c
1
is a domain-dependent constant. As innova-
tions in our experiments are generic, we decided not
to include this value in the cost function (c
1
= 0). In
each experiment, we show average results from 10 ex-
ecutions using different random seeds.
We assume that it would be of interest to apply
the algorithm for power estimation (Alg. 2) only to a
few of the hubs obtained using the policies presented
in Section 3. In this set of experiments, we will use
the best 10% of hubs to calculate their power. We
will connect a NE to each one of these hubs and also
to their neighbours, as explained in Alg. 1 and then
SISM will apply Alg. 2. δ is set to 0.8.
4.2 Experiment 1. SISM Performance
First, we put forward how the social network for this
block of experiments is generated. We have used a
dataset based on Facebook (McAuley and Leskovec,
2012) which consists of ‘circles’ (or ‘friends lists’).
The data was collected from survey participants using
a Facebook application. This network contains 333
users and 5038 links among them denoting reciprocal
friendship (all edges in the graph are bi-directional).
The dataset also includes node features (profiles) that
allow SISM to work with similarities (as explained
in Section 2.3). Figure 2(a) shows the graph of the
initial network. The node size represents the degree
of users’ connectivity (bigger representation means
a higher degree). Here we intend to compare the
SISM approach with a traditional broadcasting ap-
proach for innovation introduction, in which the net-
work is flooded with attempts to introduce the inno-
vation. As far as we know, this is the most com-
mon manner of deploying marketing campaigns, es-
pecially the ones based on press ads or TV commer-
cials. For the sake of simplicity, we simplify the prob-
lem comparing the consequences of selecting a single
entry point using SISM against the selection of an en-
try point randomly. Furthermore, we test SISM with
different features: varying parameters for α, β and γ
in the A-BM probability of adoption function and also
the different policies to identify hubs, namely degree
centrality (SISM-DC), closeness centrality (SISM-
CC) and betweenness centrality (SISM-BC). The ini-
tial population is generated from the dataset, endow-
ing each user with random coefficients of innovation
and imitation, respectively. In Figures 3(a), 3(b) and
3(c), the SISM mechanism (fixed to SISM-DC) out-
performs a random policy for selecting entry points
(RandomEP). However, different populations gener-
ated with variations in the function for the innovation
adoption bring about different results. When α is set
to a high value (3(a)), denoting a tendency to follow
internal forces to accept the innovation, a wide cover-
age in adoption is achieved (around 94% of the users).
Even when the coefficients of innovation are
relatively low (as in Figure 3(c)), the repetitive-
ness/accumulation of the signal increases the chances
for adopting the innovation due to the longer period
that one can be influenced by neighbours’ adoption
(as it occurs in Figure 3(c)). Here we observe a poor
performance for the random entry point selection pol-
icy, since isolated and with low influence users do not
have enough power to influence their neighbours to
adopt the innovation. Note that in the case of a neu-
tral population – 3(b) – users are sensitive to different
forces: internal, external and profile similarity.
Figure 4 presents the benefit – calculated as ex-
plained in Section 4.1 – obtained by both approaches
in the latter experiments. It is worth noting that SISM
achieves high benefits regardless the type of popu-
lation in the network. This is a consequence of the
wider spread that the innovation reaches. Even when
the use of the SISM mechanism results in higher in-
centive costs – on average – when the entry point user
does not accept the innovation for free, this payment
entails an innovation introduction at a suitable point to
foster the diffusion. An approach is said to converge
when there are no more signals to be processed by
the users; i.e., the innovation reaches its maximum in
terms of adoption. In the case of the RandomEP, low
performance consequently means a low convergence
rate, since diffusion gets easily trapped. However,
convergence in SISM is not affected by the type of
ICAART2015-InternationalConferenceonAgentsandArtificialIntelligence
22
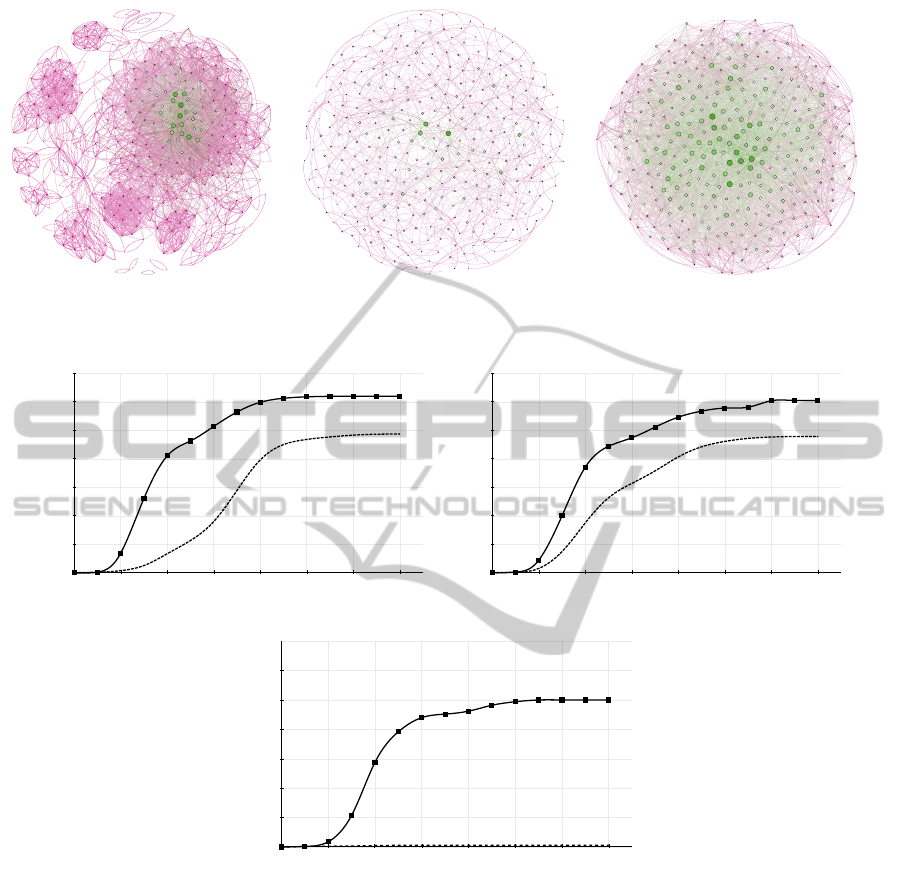
(a) Facebook dataset (b) Poor-connected network (c) Well-connected network
Figure 2: Different networks used in the experiments.
0 2 4 6 8 10 12 14
350
0
50
100
150
200
250
300
Time
Number of adopters
RandomEP
SISM
(a) α = 0.9,β = 0.1,γ = 0.0
0 2 4 6 8 10 12 14
350
0
50
100
150
200
250
300
Time
Number of adopters
RandomEP
SISM
(b) α = 0.4,β = 0.3,γ = 0.3
0 2 4 6 8 10 12 14
0
50
100
150
200
250
300
Time
Number of adopters
RandomEP
SISM
350
(c) α = 0.1,β = 0.9,γ = 0.0
Figure 3: Number of adopters for different values of α, β and γ.
population, it always outperforms RandomEP, since
it chooses a suitable entry point and so spreads the
innovation in a shorter time.
4.3 Experiment 2. Network Topology
Effect
We created two different networks with different
topologies with the same size as in the previous block.
The first instance, represents a poor-connected ran-
dom network (Fig. 2(b)) while the second one stands
for a well-connected random network (Fig. 2(c)). We
intend to benchmark the effectiveness and suitability
(in terms of the number of adopters) of SISM on them.
We assume that in such networks there are no publicly
available profiles from which we can draw on similar-
ity measures, hence profile vectors cannot be calcu-
lated (γ = 0 in eq. 2). We set up α = β = 0.5. From
the study of the results of the poor-connected network
(Fig. 5) we conclude that SISM-BC outperforms the
other mechanisms. This is explained by the fact that
SISM-BC estimates how present a user is in any pos-
sible path between two different users. This infor-
mation is then used by SISM as a relevant heuristic
EntryPointMatters-EffectiveIntroductionofInnovationinSocialNetworks
23

0"
2"
4"
6"
8"
10"
12"
14"
16"
18"
0"
500"
1000"
1500"
2000"
2500"
α=0.1,"β=0.9,"γ=0.0" α=0.4,"β=0.3,"γ=0.3" α=0.9,"β=0.1,"γ=0.0"
!"#$%&'%#(%)*+,%)-.%/0)
1%#%2.)
RandomEP" SISM"
SISM"
RandomEP"
Figure 4: Average benefit and convergence.
to start the innovation diffusion. Similarly, in SISM-
CC the closeness centrality is used also as a suitable
heuristic. However, in the latter, this measure only fo-
cuses on how close a user is from any other user, but
does not take into account the number of paths be-
tween any pair of users. This is rather more relevant
since once the innovation is introduced, the path that
it follows in the network depends on the adoption of
every individual user. In the case of the SISM-DC,
as one might expect, this reaches a lower number of
adopters. Note that the number of users that adopt
the innovation is around the 65% mark of the whole
population in the best case (220/333). This is a con-
sequence of the limitations in the connectivity of the
network and in the users’ adoption as well. Regarding
the convergence of the different approaches, we con-
clude that SISM-BC converges first, as a consequence
of the suitability of the entry point found by the mech-
anism, facilitating innovations reaching any potential
adopter in a shorter time.
Figure 6 puts forward the results of the exper-
iments carried out with the well-connected random
network. From those results we must conclude that
there is no significant difference among the various
mechanisms. They all converge to the same perfor-
mance level in a similar period of time. This is due to
the nature of the network, as input signals for accept-
ing the innovation are sent to the same user repeat-
edly, given the high average degree of any node in the
network. The convergence rate in this case is (approx-
imately) the same for any mechanism. We have also
performed experiments with random networks of 10k
users (with different average degree) and the results
remain the same.
5 RELATED WORK
Little attention has been paid to the problem of inno-
vation seeding in social networks. A new work in this
area is (Seeman and Singer, 2013), in which the au-
thors present an algorithm which provides a constant
factor approximation to the optimal adaptive policy
350 5 10 15 20 25 30
350
0
50
100
150
200
250
300
Time
Number of adopters
RandomEP
SISM-DC
SISM-BC
SISM-CC
Figure 5: Number of adopters for the poor-connected net-
work.
90 1 2 3 4 5 6 7 8
350
0
50
100
150
200
250
300
Time
Number of adopters
SISM-DC
RandomEP
SISM-CC
SISM-BC
Figure 6: Number of adopters for the well-connected net-
work.
for any influence function in the triggering model. In
(Luu et al., 2012), a probabilistic model for the diffu-
sion process is presented and the authors conclude the
degree distribution may dynamically change.
Another relevant approach is the one by
Deroïan (Deroïan, 2002), in which the author
explains how the formation of the network affects
the diffusion process of the innovations. Although
in this paper we do not cover the dynamics of the
social network, this is a necessary and natural step
for our future research. Another trend in the research
on diffusion in social networks is to investigate when
innovations become persistent in the population.
Several threshold-based approaches can be found
in the literature. For example, (López-Pintado,
2008) presents a method to find the threshold for
the spreading rate above which a behaviour spreads
and becomes persistent in a certain population. The
paper concludes that this threshold depends on the
connectivity distribution of the social network; this
is what we have shown in our experimental section
as well. Similarly, Valente (Valente, 1996) is focused
on threshold models of collective behaviour which
explain how users can eventually have different
rates of adoption. This work also postulates that
there exist two levels of innovation rates for a user:
one macro, relative to the system, and one micro,
relative to her personal network. In (Kempe et al.,
ICAART2015-InternationalConferenceonAgentsandArtificialIntelligence
24

2003)(Bakshy et al., 2011), the authors conclude that
there exist some influential nodes that foster diffusion
of innovation throughout the network. They show
this by presenting different probabilistic models that
allow estimating the node activation from the signals
received by other users. In (Aral and Walker, 2012),
the authors show that influential individuals tend
not to be susceptible to influence from others, while
susceptible individuals tend not to be influential.
Our work is different and adds to the works above.
Our interests are not in studying the adoption or dif-
fusion processes per se in social networks. The focus
of our work is on identifying the most appropriate en-
try points to deploy in order to initiate product adop-
tion and diffusion. In particular, in social networks,
we aim to mine the underlying network structure
and utilise characteristics of individual nodes such as
influencing (referent) power to determine the most
promising entry points for seeding the innovation.
The contribution of this work is in providing a mech-
anism able to identify suitable entry points for the in-
novation in the social network in order to achieve a
more efficient early adoption, in terms of cost, rate of
adoption and subsequent benefits to the firm introduc-
ing it. Moreover, since the mechanism needs a global
view of the social network it must be deployed by the
network owner; that is, social network firms (Face-
book Inc., Twitter Inc, etc.) might offer the use of
the mechanism as a service for other companies inter-
ested in advertising and spreading their services and
products.
6 CONCLUSIONS
In this paper, we have presented a mechanism to se-
lect suitable entry points in a social network to intro-
duce innovation, so fostering its acceptance and its
diffusion. For that purpose we have used the under-
lying structure of the network, as well as the power
some users exercise on others. We have empirically
validated the theoretical approach with a set of exper-
iments over a Facebook dataset and two examples of
random networks. As future work we intend to study
an extension of the mechanism in order to deal with
dynamic social networks, in which structural proper-
ties change quickly due to the evolution of the links
in the network. Another interesting avenue for future
work is to build a macro model for using the mecha-
nism in an inter-network environment; i.e. to be able
to use the mechanism to estimate the centrality and
the power of users in different networks. This may be
of relevance especially when new users connect to a
network.
ACKNOWLEDGEMENTS
This work has been partially supported by the Spanish
Ministry of Economy and Competitiveness through
grants CSD2007-00022 ("Agreement Technologies",
CONSOLIDER-INGENIO2010), TIN2012-36586-
C03-02 ("iHAS") as well as by the Autonomous
Region of Madrid through grant P2013/ICE-3019
("MOSI-AGIL-CM", co-funded by EU Structural
Funds FSE and FEDER").
REFERENCES
Aral, S. and Walker, D. (2012). Identifying Influential and
Susceptible Members of Social Networks. Science,
337(6092):337–341.
Bakshy, E., Hofman, J. M., Mason, W. A., and Watts, D. J.
(2011). Everyone’s an influencer: Quantifying influ-
ence on twitter. In Proceedings of the Fourth ACM In-
ternational Conference on Web Search and Data Min-
ing, pages 65–74, New York, NY, USA. ACM.
Bass, F. (1969). A new product growth model for consumer
durables. Management Science, 15.
Calantone, R. J., Cavusgil, S., and Zhao, Y. (2002). Learn-
ing orientation, firm innovation capability, and firm
performance. Industrial Marketing Management,
31(6):515 – 524.
Deroïan, F. (2002). Formation of social networks and dif-
fusion of innovations. Research Policy, 31(5):835 –
846.
Fasli, M. (2006). On the relationship between roles and
power: preliminary report. In Proceedings of the
2006 ACM symposium on Applied computing, SAC
’06, pages 313–318, New York, NY, USA. ACM.
Freeman, L. C. (1977). A Set of Measures of Centrality
Based on Betweenness. Sociometry, 40(1):35–41.
Goldenberg, J., Han, S., Lehmann, D. R., and Hong, J. W.
(2009). The role of hubs in the adoption process. Jour-
nal of Marketing, 73(2):1–13.
Jackson, M. O. (2008). Social and Economic Networks.
Princeton University Press, Princeton, NJ, USA.
Kempe, D., Kleinberg, J., and Tardos, E. (2003). Maximiz-
ing the spread of influence through a social network.
In Proceedings of the Ninth ACM SIGKDD Interna-
tional Conference on Knowledge Discovery and Data
Mining, pages 137–146, New York, USA. ACM.
López-Pintado, D. (2008). Diffusion in complex social net-
works. Games and Economic Behavior, 62(2):573 –
590.
Luu, D. M., Lim, E.-P., Hoang, T.-A., and Chua, F. C. T.
(2012). Modeling diffusion in social networks using
network properties. In Proceedings of the 6th ICWSM.
McAuley, J. J. and Leskovec, J. (2012). Learning to dis-
cover social circles in ego networks. In 26th Annual
Conference on Neural Information Processing Sys-
tems, pages 548–556.
EntryPointMatters-EffectiveIntroductionofInnovationinSocialNetworks
25

Rogers, E. (1995). Diffusion of innovations, chapter Ele-
ments of diffusion, pages 1–37. The Free Press.
Seeman, L. and Singer, Y. (2013). Adaptive seeding in so-
cial networks. 2013 IEEE 54th Annual Symposium on
Foundations of Computer Science, pages 459–468.
Tanimoto, T. (1958). An elementary mathematical theory
of classification and prediction. IBM Internal Report.
Valente, T. W. (1996). Social network thresholds in the dif-
fusion of innovations. Social Networks, 18(1):69 – 89.
ICAART2015-InternationalConferenceonAgentsandArtificialIntelligence
26
