
Discrimination of Healthy and Post-partum Subjects using Wavelet
Filterbank and Auto-regressive Modelling
Rolf Vetter
1
, Jonas Schild
1
, Annette Kuhn
2
and Lorenz Radlinger
3
1
Institute for Mobile Communication, Bern University of Applied Siences, Jlcoweg 1, Burgdorf, Switzerland
2
Women’s Hospital, Urogynaecology, Bern University Hospital and University of Bern, Bern, Switzerland
3
Applied Research and Development Physiotherapy, Bern University of Applied Sciences, Health Bern, Switzerland
Keywords: Wavelet, Autoregressive Modelling, Patient Discrimination, Pelvic Floor Muscle.
Abstract: Rehabilitation therapies to treat female stress urinary incontinence focus on the reactivation of pelvic floor
muscle (PFM) activity. An objective measure is essential to assess a subject’s improvement in PFM
capabilities and increase the success rate of the therapy. In order to provide such a measure, we propose a
method for the discrimination of healthy subjects with strong PFM and post-partum subjects with weak
PFM. Our method is based on a dyadic discrete wavelet decomposition of electromyograms (EMG) that
projects slow-twitched and fast-twitched muscle activities onto different scales. We used a parametric auto-
regressive (AR) model for the estimation of the frequency of each wavelet scale to overcome the poor
frequency resolution of the dyadic decomposition. The feature used for discrimination was the frequency of
the wavelet scale with the highest variance after interpolation with the nearest neighboring scales. Twenty-
three healthy and 26 post-partum women with weak PFM who executed 4 maximum voluntary contractions
(MVC) were retrospectively analysed. EMGs were recorded using a vaginal probe. The proposed method
has a lower rate of false discrimination (4%) compared to the two classical methods based on mean (9%)
and median (7%) frequency estimation from the power spectral density.
1 INTRODUCTION
Involuntary urinary leakage during effort or
exertion, such as jogging, coughing or sneezing is
often related to insufficient pelvic floor muscle
(PFM) function and strength (Bø and Sherburn,
2005). It constitutes an embarrassing condition,
which can lead to social exclusion. Modern
rehabilitation therapies such as stochastic resonance
whole body vibration (Lauper et al., 2009) focus on
the reactivation of PFM activity. In such therapies it
is necessary to dispose of an objective measure to
assess a subject’s improvement. Such a measure,
when used as direct feedback, could reinforce the
efficiency and success rate of the therapy. In an
attempt to construct such a measure, we present in
this paper a method for the discrimination of healthy
subjects with strong PFM capabilities and post-
partum subjects with weak PFM capabilities.
In clinical practice, various methods are under
investigation for the assessment of PFM capabilities
(Bø and Sherburn, 2005). A promising method is
based on ElectroMyoGraphy (EMG) signals
recorded from surface electrodes embedded on
vaginal probes (Bø and Finckenhagen, 2001). This
method estimates descriptive statistics of EMG
signals to quantify the dynamics and intensity of the
PFM activity. Signal variance is often used as an
indicator of the muscle contraction intensity while
mean or median frequency of the Fast Fourier
Transform (FFT) spectrum of the signal is used to
quantify the muscle dynamics (Auchincloss and
McLean, 2009).
However, it is well established that EMG signals
are stochastic and non-stationary with intermittent
burst-like activities. Various studies on EMG signals
have put forward the superiority of wavelet-based
signal analysis over FFT-based methods for
handling the burst-like EMG activity (Croce et al.,
kein Datum) in the frequency range 10-400Hz.
Tscharner et al. used 10 non-linearly scaled wavelets
to cover this frequency band (Tscharner et al., 2003).
In a discrimination application it would be
preferable to have a lower number of wavelets for a
better capturing of the physiological phenomena
under investigation (Vaseghi, 2008). Wavelet scales
132
Vetter R., Schild J., Kuhn A. and Radlinger L..
Discrimination of Healthy and Post-partum Subjects using Wavelet Filterbank and Auto-regressive Modelling.
DOI: 10.5220/0005176301320137
In Proceedings of the International Conference on Bio-inspired Systems and Signal Processing (BIOSIGNALS-2015), pages 132-137
ISBN: 978-989-758-069-7
Copyright
c
2015 SCITEPRESS (Science and Technology Publications, Lda.)

should be chosen in such a way that signal
components related to different physiological
phenomena are projected onto different scales.
Indeed, it has been shown in numerous biomedical
applications that signal separation is an important
first step to relevant signal analysis and
discrimination (Vetter, 1999).
Urinary continence requires strong and fast
muscle contraction (Shishido et al., 2008). Human
muscles consist of slow-twitched and fast-twitched
muscle fibers and fast contractions with high forces
necessitate a larger recruitment of fast-twitched
muscle fibers (Guyton and Hall, 2011). To provide
optimal signal separation before discrimination we
propose in this paper a dyadic discrete wavelet
decomposition that projects signal components
related to activities of the slow-twitched and the
fast-twitched muscles mainly on different scales
while simultaneously minimizing the number of
scales. This guarantees a minimum of salient
features for subsequent discrimination. To overcome
the poor frequency resolution of the dyadic
decomposition, we use a parametric auto-regressive
(AR) model for the estimation of the frequency of
each wavelet scale.
2 METHODS
2.1 Subjects and Protocol
Data from a cross sectional study including 49
women (Lauper et al., 2009) was retrospectively
analyzed. The study included 23 healthy women
with strong PFM capabilities and 26 post-partum
women with pelvic floor muscle weakness. In a first
step, the PFM‘s weakness was assessed digitally
during a maximal voluntary contraction (MVC) in a
sitting position and graded according to the Oxford
scale (Bø and Finckenhagen, 2001) with six
categories: M
0
=no contraction, M
1
=flicker,
M
2
=weak, M
3
=moderate, M
4
=good, M
5
=strong.
Then, each subject underwent four 5 seconds-MVC
split over 2 days (2 each day), during which EMG
signals were recorded.
For the discrimination study presented herein, a
subset of subjects was selected according to the
following criteria: (1) healthy subjects had a grading
on the Oxford scale larger than M
4
and (2) weak
PFM subjects had a grading on the Oxford scale of
maximally M
3
. This reduced the original database to
136 recordings. Thirty-four recordings were used for
the development phase of the algorithm and the
remaining 102 recordings were used for the
validation phase. Both, development and validation
databases were equilibrated with an equal number of
healthy and weak PFM subjects.
2.2 Data Acquisition
The EMG of PFM was obtained from a vaginal
probe (Periform, Parsenn-Produkte AG,
Switzerland). These EMG signals were recorded
using a 16-channel telemetric system (TeleMyo
2400 G2, Noraxon U.S.A. Inc., Scottsdale, AZ,
USA). The reference electrode (Ambu Blue Sensor
N, Ambu A/S, Ballerup, Denmark) was applied
according to the recommendations of SENIAM on
the crista iliaca after preparation of the skin
(Hermens et al., 2000). The impedance was
controlled to be lower than 5 kΩ. The vaginal probe
was connected to the transmitter of the telemetric
system via a flexible cord with an integrated pre-
amplifier (baseline noise: <1 μV RMS; input
impedance: >100 MΩ; CMMR: >100 dB; input
range: +/−10 mV; base gain: 500; integrated band-
pass filter: 10–500 Hz).
Finally, all signals were sampled and recorded at
a rate of 1 kHz using a 12-bit analog-digital
converter (Meilhaus ME-2600i; SisNova
Engineering; Zug, Switzerland) and the software
package “ads” (version 1.12, uk-labs, Kempen,
Germany).
The EMG signals were visually controlled for
artifacts and additionally corrected for baseline
offset by high pass filtering with a cut off frequency
of 0.1 Hz via ads-software.
2.3 Algorithm Development
2.3.1 Wavelet Transform
The proposed algorithm is based on the hypothesis
that there is shift in muscle contraction dynamics
between healthy subjects and weak PFM subjects
undergoing a MVC protocol measured with EMG
signals.
A wavelet approach was chosen in numerous
previous studies on EMG due to the non-stationary
nature of EMG and their burst-like structure
(Tscharner et al., 2003). This is also the approach we
chose. In a wavelet transform the signal is locally
projected on a scaled and translated wavelet
function
,
:
dt ttx (a,b)=W
baz
)()(
,
(1)
where ∈
and ∈ are the scaling and
DiscriminationofHealthyandPost-partumSubjectsusingWaveletFilterbankandAuto-regressiveModelling
133
translation parameters. The wavelet function
,
is obtained by translating the mother wavelet scaled
by a factor at the time , namely
abtat
ba
/)()(
5.0
,
(2)
The factor
|
|
.
is introduced to guarantee energy
preservation. An analysis of the Equation 2 shows
that larger values of stretch the basic wavelet
function and allow the analysis of low-frequency
components with low temporal accuracy. In contrast,
smaller values of provide contracted versions of
the basic wavelet, which allows the analysis of high
frequency components with high temporal accuracy.
As a result, wavelets are located both in time and
frequency and constitute an important tool for time-
frequency analysis.
The free parameters, which have to be chosen for
each given application, are the mother wavelet
and the range of values for and b. In EMG
analysis, Daubechies, Symlet or Morlet wavelets
have shown promising performance due to their
resemblance with the burst-like EMG signal
structure (Croce et al., kein Datum). We used the
Symlet wavelet due to its symmetric structure.
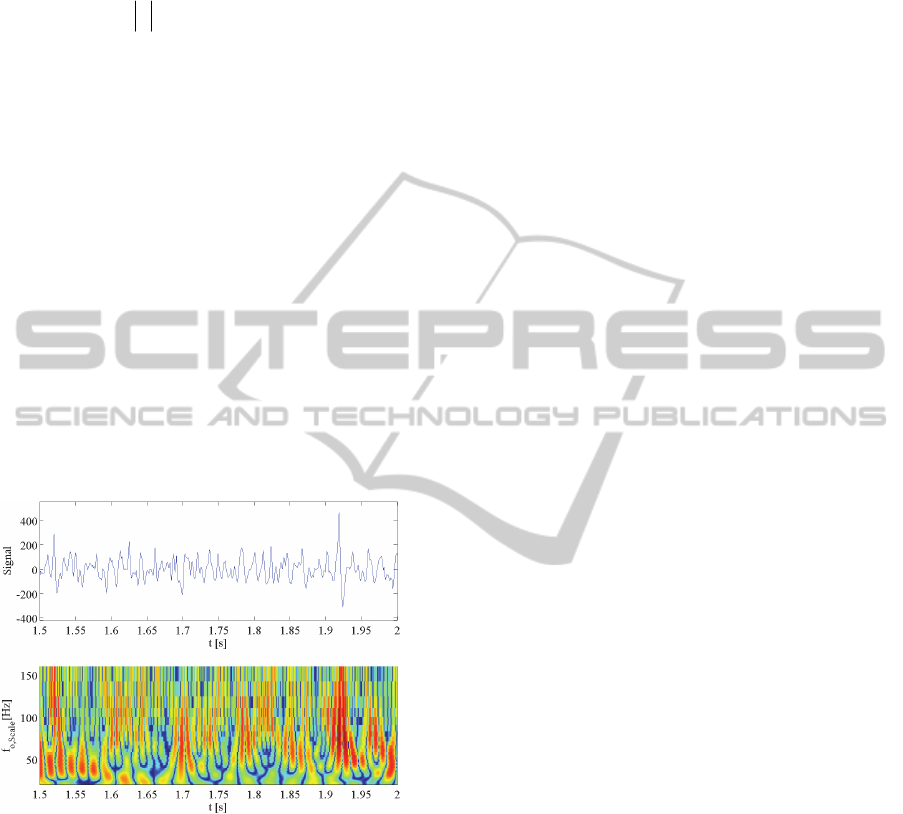
Figure 1: Time signal (top) and CWT (bottom) using
Symlet mother wavelet of EMG signals of PFM activity of
a healthy subject.
If the scaling and translation parameters and
are free to take on all values, one obtains the
Continuous Wavelet Transform (CWT). Figure 1
shows a typical EMG signal and the associated
CWT of EMG signals of PFM activity of a healthy
subject. To give a comprehensive representation we
used center frequency of the scale instead of scale
number as it is usually done. One can clearly
distinguish alternating high signal intensities in the
scales corresponding to frequency bands below (LF)
and above (HF) approximately 60Hz. This
observation may be related to an intermittent change
in recruitment of sow-twitched and fast-twitched
muscle fibers.
The CWT is a tool for visual inspection of data,
but provides in the given application poorer
performance than a more compact representation,
such as the Discrete Wavelet Transform (DWT)
based a dyadic choice of the scaling parameter.
Indeed, in biomedical engineering best
performance is obtained, when the analysis method
mimics as close as possible the phenomenon under
investigation (Vetter et al., 1998). Thus phenomena
of different origins should be projected onto
different wavelet scales. This can be obtained by
choosing discrete values for and in Equation 1,
namely
2
and
,
2
for ,
1, 2, 3, … and yields the DWT. The signal
is decomposed on different scales as follows (Akay,
1995):
knkd
knkanx
L
lZk
l
l
L
Zk
L
l
L
1
2
2
)2 ( )(
)2 ( )()(
(3)
where
2
are discrete, translated, scaled
analysis wavelets and
2
are discrete
scaling functions. This decomposition splits the
signal into low-passed
and band-passed
detailed signals or wavelet coefficients
,
1,2,3, … . A straightforward implementation of the
dyadic DWT can be based on two quadrature mirror
filters, a high-pass filter and a low-pass filter
and appropriate downscaling (Akay, 1995).
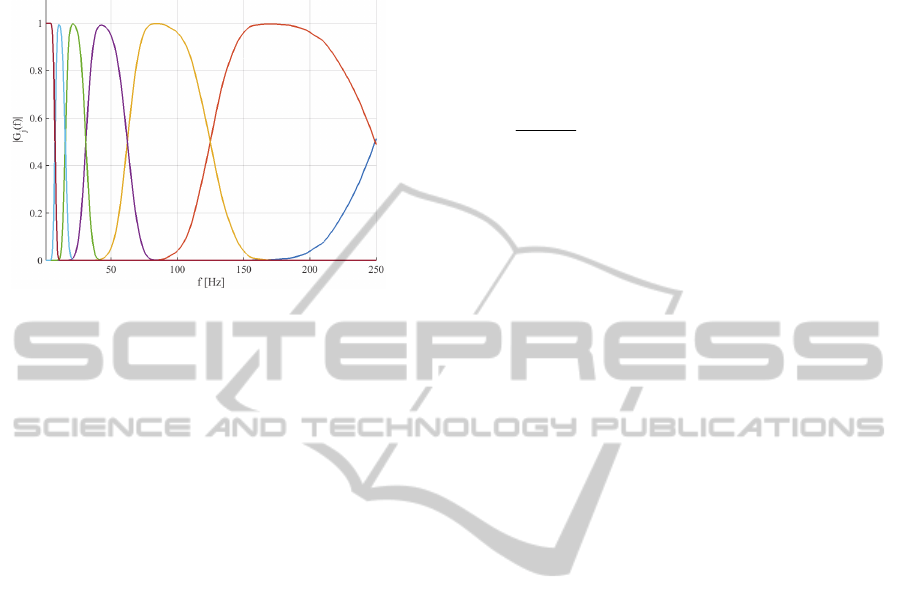
This whole procedure provides an equivalent filter-
bank with transfer functions as shown in Figure 2.
By choosing an appropriate sampling frequency of
1 kHz we obtained an ideally suited approach for the
analysis of EMG signals from PFM with the corner
frequencies of approximately 250 Hz, 125 Hz, 62 Hz
and 32 Hz and 16 Hz.
2.3.2 Feature Extraction
From the detailed signal
at scale 2
we
extracted salient features through a descriptive
statistics related to the intensity of muscle activation.
We used in our algorithm signal variance of the
detailed signals of the scales
, 1,2,3, … to
quantify contraction intensity as proposed in
(Tscharner et al., 2003). Based on the analysis of
Figure 1 we supposed that the variances of the
detailed signals of scale 2 and 3 (frequency range
62 Hz–256 Hz) was influenced mainly by activation
BIOSIGNALS2015-InternationalConferenceonBio-inspiredSystemsandSignalProcessing
134
of fast-twitched muscle fibres, whereas variance of
scale 4 and 5 was mainly related to the activation of
slow-twitched muscle fibres.
Figure 2: Frequency response of different scales of the
dyadic discrete Wavelet Transform.
The quantification of the dynamics of muscle
activation is another important aspect, which was
extracted from the frequency characteristics of the
detailed signals
. In various EMG studies,
interpretation of the wavelet transform in terms of
frequency is achieved through a direct mapping
using the central frequency of a given scale
(Tscharner et al., 2003). This may be appropriate for
a wavelet transform with narrowband characteristics.
In a dyadic decomposition, the upper bands have
larger bandwidths (see Figure 2) which may lead to
considerable inaccuracies in terms of frequency
mapping.
Therefore we applied an AR modelling and
subsequent analysis of root location for the
estimation of the frequency of the detailed signals of
the different scales
,
, 1,2,3, … .
Parametric AR modelling is well known for its
accuracy in terms of frequency estimation of quasi
harmonic oscillations and very efficient algorithms
are proposed in literature (Vaseghi, 2008). We
applied Burg’s algorithm for robust parameter and
accurate central frequency estimation. The last step
in the development of a discrimination algorithm
consists generally in an optimal merging of the
extracted features after discarding unreliable features
and adequate normalization (Vaseghi, 2008). We
tested various approaches to merge the above
extracted variance and frequency features of the
detailed signals, such as for example neural
networks and fuzzy logic. However, the
development data base put forward the superiority of
a simple quasi maximum likelihood approach. The
most important feature was identified though
determination of the scale with the highest variance,
which provided the scale-index
. Refined
frequency estimation was then obtained by including
information of the adjacent scales through classical
weighting as follows:
pf=f
l
l
ll
loo
1
1
,
max
max
(4)
1,,1for
maxmaxmax
1
1
2
2
max
max
llll =p
l
lj
j
l
l
(5)
2.3.3 Statistical Processing and
Optimization
The analysis of features extracted from the
experimental data showed that MVC signals were
highly non-stationary. Subjects were rarely able to
achieve maximal voluntary muscle contraction at the
same level during 5 seconds. The algorithm had
therefore to discard marginal feature values. This
was achieved by estimating
consecutively on
segments of a duration of 1 second with an overlap
of 50% and by processing the median of all resulting
estimations. The discrimination of healthy and
weak PFM subjects was obtained by comparing
to
a critical value
. The proposed algorithm has 3
freely adjustable parameters, which are the mother
wavelet, the sampling frequency and the threshold
for classification
. The optimal tuning of these
parameters was done using the development
database. Receiver Operating Characteristics (ROC)
representing True Positive Rate (TPR) versus False
Positive Rate (FPR) was used to optimize these
parameters. A sampling frequency of 1 kHz and
threshold value of
67 and a Symlet
mother wavelet provided maximal discrimination
performance.
3 RESULTS
In order to show the performance of the proposed
approach, we compared it to classical methods based
on the mean (
PSD
mean
) and median (PSD
median
)
frequency of Welch’s power spectral density
estimation. The following parameters were chosen:
order of FFT 256, Hanning window and a data
overlapping of 50%. The order of the FFT was
chosen to obtain a spectral estimator with low
variance while providing a sufficient frequency
resolution. The performance of these 3 methods was
evaluated on the validation database consisting of 51
DiscriminationofHealthyandPost-partumSubjectsusingWaveletFilterbankandAuto-regressiveModelling
135
recordings of healthy and weak PFM subjects each.
Results of Table 1 show that our method
outperforms the classical methods in terms of
classification error.
Table 2: Discrimination results and estimated central
frequency of the compared methods.
f
o
[Hz] (mean±std)
Classification
Error [%]
Healthy Weak PFM
PSD
mean
85±10 65±7 9%
PSD
median
72±10 52±6 7%
DWT 77±8 53±7 4%
Our method has a lower rate of false
discrimination (4%) compared to the two classical
methods based on mean (9%) and median (7%)
frequency estimation from the power spectral
density. The analysis of the estimated frequency
used for classification underlines the superiority of
the proposed method. For both, healthy and weak
PFM subjects,
PSD
mean
gave the highest values of the
estimated central frequency while
PSD
median
provided
the lowest values. As a good compromise, the
proposed method provided values in between these
lower and upper bounds. The standard deviations of
all three methods were approximately equal. The
superiority of our method is related to the fact that
the gap in mean
between healthy and weak PFM
subjects is larger, which provides a better class
separation. This improvement in terms of class
separation or clustering is also confirmed by the
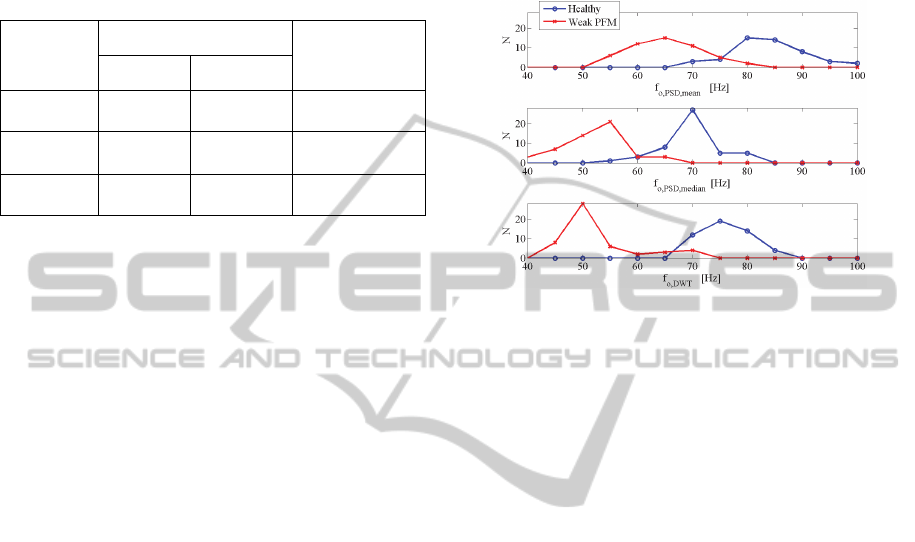
analysis of the histograms of Figure 3. Indeed, the
estimator based on the mean frequency of the PSD
shows very large and flat clusters with large
overlapping. In contrast, our method shows sharper
clusters with a larger gap between the maxima of the
healthy and weak PFM clusters. Our method had
also the lowest cluster overlap which provided in
turn best classification performance.
4 DISCUSSION
Our method outperforms classical methods based on
mean and median frequency estimation from PSD.
The main reason for this improvement may be
related to a feature processing in specific frequency
bands using a wavelet approach. Information from
fast-twitched and slow-twitched fibers contained in
EMG-signals is thus projected on different bands.
Since urinary continence requires strong and fast
muscle contraction (Shishido et al., 2008) and
therefore increased recruitment of the fast-twitched
fibers, the proposed method is ideally suited to
gather this information in the HF-bands (over 60
Hz).
Figure 3: Histogram of estimated central frequency based
on the mean and median frequency of the PSD (top and
middle) and proposed method (bottom).
The wavelet based approach allows a
simultaneous design of the filter-bank in the time-
frequency domain. On one hand, the mother wavelet
can be chosen to obtain highest resemblance with
the EMG-burst activity. On the other hand, the
choice of a dyadic base for the scaling and an
appropriate sampling frequency provides the optimal
location of the frequency bands.
The dyadic filter bank characteristics of the
proposed approach could also have been approached
in the PSD domain though an appropriate choice of
the FFT order in Welch’s method and subsequent
band grouping. Whether FFT band grouping or
wavelet filter bank is to be preferred depends mainly
on application specific implementation requirements
(Tscharner et al., 2003).
Interestingly, we exploit only indirectly the scale
specific signal variance in order to describe dynamic
characteristics in terms of the estimated central
frequency. Throughout the development phase
numerous tests have been performed without success
to include additionally scale specific variances using
for example neural networks or fuzzy logic. The fact
that additional inclusion of scale specific variances
in the discrimination approach failed to improve
performance could be related to the used vaginal
probe, which has lesser sensitivity than more
uncomfortable ones (Bø and Sherburn, 2005).
A normalization of MVC scale specific variance
versus baseline-scale variances could also have
brought along some improvements. Such
BIOSIGNALS2015-InternationalConferenceonBio-inspiredSystemsandSignalProcessing
136

normalization would have bought the feature to a
subject-specific level, which is an important step in a
discrimination method (Vaseghi, 2008).
A limitation of the present validation consists in
the use of the the Oxford scale as validation criteria
for a correct discrimination. The Oxford scale
describes a subject’s ability to contact maximally the
PFM and was assed once. Each subject conducted 4
MVC protocols on 2 different days. Since the
outcome of each protocol has not been rated
separately, unsuccessful completion of the protocols
for healthy subjects may have occurred. The
histogram of the central frequency estimated by the
proposed approach (see Figure 3) shows that healthy
subjects have a very compact cluster. In contrast,
weak PFM subjects have a histogram with a long tail
into the high frequency domain (> 60Hz).
Discrimination errors are due to a misclassification
of weak PFM subjects from this marginal tail of the
histogram as healthy subjects. Thus, the limitation
related to the Oxford scale should not have an
influence on the performance of the proposed
algorithm presented herein.
5 CONCLUSIONS
Wavelet decomposition together with AR-modeling
provides a method for discrimination between
healthy and post-partum subjects with weak PFM
capabilities that outperforms classical FFT-based
methods.
REFERENCES
Akay, M., 1995. Wavelets in biomedical engineering.
Annals of Biomedical Engineering, pp. 531-542.
Auchincloss, C. C. & McLean, L., 2009. The reliability of
surface EMG recorded from the plevic floor muscles.
Journal of Neuroscience Methods, pp. 85-96.
Beck, T. et al., 2007. Does the frequency content of the
surface mechanomyographic signal reflect motor unit
firing rates? A brief review. J Electromyogr Kinesiol.,
pp. 1-13.
Bø, K. & Finckenhagen, H., 2001. Vaginal palpation of
pelvic floor muscle strength: inter-test reproducibility
and comparison between palpation and vaginal
squeeze. Acta Obstet Gynecol Scand., pp. 883-887.
Bø, K. & Sherburn, M., 2005. Evaluation of female plevic
floor muscle function and strength. PHYS THER., pp.
269-282.
Carlo, J., De Luca, L. & Gilmore, D., 2010. Filtering the
surface EMG signal: Movement artifact and baseline
contamination. Journal of Biomechanics, p. 1573–
1579.
Croce, R., Miller, K., Chamberlin, J. & Filipovic, D., kein
Datum Wavelet analysis of Quadriceps power spectra
and amplitude under varying levels of contraction
intensity and velocity. ‘Accepted Article’, doi:
10.1002/mus.24230.
Guyton, A. C. & Hall, J. E., 2011. Textbook of Medical
Physiology. Philadelphia: Elsevier.
Hermens, H. J., Freriks, B., Disselhorst-Klug, C. & Rau,
G., 2000. Developement of recommendations for
SEMG sensors and sensor placement procedures. J
Electromyogr Kinesiol. , pp. 361-74.
Lauper, M. et al., 2009. Plevic floor stimulation: what are
the good virbrations?. Neurourol Urodyn., pp. 405-10.
Shishido, K. et al., 2008. Influence of pelvic floor muscle
contraction on the profile of vaginal closure pressure
in continent and stress urinary incontinent women. J.
Urol., p. 1917–22.
Tscharner, V., 2000. Intensity analysis in time frequency
space of surface myoelectric signals by wavelets of
specified resolution. Journal of Electromyography and
Kinesiology, pp. 433-445.
Tscharner, V., Geopfert, B. & Nigg, B., 2003. Changes in
EMG signals for the muscle tibialis anterior while
running barefoot or with shoes resolved by non-
linearly scaled wavelets. Journal of Biomechanics, pp.
1169-76.
Vaseghi, S. V., 2008. Advanced Digital Signal Processing
and Noise Reduction. s.l.:JOHN WILEY & SONS,
LTD.
Vetter, R., 1999. Extraction of Efficient and Characteristic
Features of Multidimensional Time Series, Lausanne:
PhD Thesis, Swiss Federal Institute of
Technology.Vetter, R. et al., 1998. Subband modeling
of the human neuro-cardiovascular system: new
insights into cardiovascular regulation. Ann. Biomed.
Eng., pp. 293-307.
DiscriminationofHealthyandPost-partumSubjectsusingWaveletFilterbankandAuto-regressiveModelling
137
