
Speech/Non-Speech Detection for Electro-Larynx Speech Using EMG
Anna Katharina Fuchs, Clemens Amon and Martin Hagm¨uller
Signal Processing and Speech Communication Laboratory, Graz University of Technology,
Inffeldgasse 16/EG, Graz, Austria
Keywords:
Speech/Non-Speech Detection (SND), Electro-Larynx (EL), Electromyography (EMG).
Abstract:
Electro-larynx speech (EL) is a possibility to re-obtain speech when the larynx is surgically removed or dam-
aged. As currently available devices normally are hand-held, a new generation of EL devices would benefit
from a hands-free version. In this work we use electromyographic (EMG) signals to investigate speech/non-
speech detection for EL speech. The muscle activity, which is represented by the EMG signal, correlates
with the intention to produce speech sounds and therefore, the short-term energy can serve as a feature to
make a speech/non-speech decision. We developed a data acquisition hardware to record EMG signals us-
ing surface electrodes. We then recorded a small database with parallel recordings of EMG and EL speech
and used different approaches to classify the EMG signal into speech/non-speech sections. We compared the
following envelope calculation methods: root mean square, Hilbert envelope, and low-pass filtered envelope,
and different classification methods: single threshold, double threshold and a Gaussian mixture model based
classification. This study suggests that the results are speaker dependent, i.e. they strongly depend on the
signal-to-noise ratio of the EMG signal. We show that using low-pass filtered envelope together with double
threshold detection outperforms the rest.
1 INTRODUCTION AND
RELATED WORK
In Germany there are around 21000 people without
larynx and about 3000 additional laryngectomy surg-
eries are performed every year (Schiefer and Hagen,
2000). According to (Shute, 2003) the most popular
device is the Servox Inton, which has no possibility to
control on and off automatically. This kind of device
normally is tube like and fits into one hand. While
speaking, people have to hold it against the neck and
press a button to turn the deviceon and off. Therefore,
many electro-larynx (EL) user would benefit from a
new EL device which can be controlled in a hands-
free manner. We assume that the muscles which con-
trol the larynx are partially unimpaired. Hence, using
the EMG signals is a possibility to detect speech and
non-speech parts. We can use this information to con-
trol on and off messages of the EL device.
Our work is strongly encouraged by previous ef-
forts to deal with speech/non-speech detection (SND)
for EL speech (Goldstein et al., 2004), (Pineda-Rico
et al., 2008): In (Goldstein et al., 2004) the EMG
signal was band-pass filtered (10-500 Hz), amplified,
rectified, and low-pass filtered (1-9 Hz corner fre-
quency) for the creation of envelopes that tracked
EMG activity. This approach was implemented in
an EMG-EL prototype and reaction time experiments
were conducted and compared to conventional push-
button EL and normal voice. The developed analog
version of the EMG-EL device had a controllable ac-
tivation threshold. This single threshold was set to
a value of 10% of the amplitude range. The ter-
mination threshold was based on an internal (fixed)
activation-threshold-dependent hysteresis band. The
optimized threshold using recorded sentences and a
minimal cost function was not significantly different
than the threshold they choose in their informal tests.
In follow up work a new wireless version of the EMG-
EL was presented (Heaton et al., 2011). Within this
work the EL could be either manually controlled or
automatically using the EMG signal (same process-
ing as described above). Later, the same group used a
computer based system with two controllable thresh-
olds (double threshold) (Kubert et al., 2009). In this
work it is confirmed that EMG signals can serve as
an intuitive and effective control source for EL voice
activation and termination as well as f
0
modulation.
In (Ooe, 2012) the authors confirmed these find-
ings. They used absolute values of the EMG sig-
nals. After smoothing with a moving average filter,
a single threshold converts the envelope into the ac-
138
Katharina Fuchs A., Amon C. and Hagmüller M..
Speech/Non-Speech Detection for Electro-Larynx Speech Using EMG.
DOI: 10.5220/0005181401380144
In Proceedings of the International Conference on Bio-inspired Systems and Signal Processing (BIOSIGNALS-2015), pages 138-144
ISBN: 978-989-758-069-7
Copyright
c
2015 SCITEPRESS (Science and Technology Publications, Lda.)

tivation/termination signal. The time delay between
EMG signal and speech start/stop was measured and
it was confirmed that EMG signals can be used to con-
trol on/off signals for the EL device.
Also (Pineda-Rico et al., 2008) picks up the EMG
based SND approach. They implemented a switching
capacitor CMOS based device. For activation and ter-
mination the same method as in (Heaton et al., 2011)
was taken: amplified, rectified and low-pass filtered
(c
f
= 3 Hz) envelope and single threshold imple-
mented as voltage comparator. Their focus was on the
implementation and on the advantages of switching
capacitor circuits which are: excellent time constants,
relative precision, simple design elements, minimum
power waste and reduced size on chip.
In this work we developed an EMG signal acqui-
sition hardware to capture EMG signals and recorded
a database consisting of EL speech and EMG signals.
We employed different strategies to smooth the EMG
envelope and developed a threshold based method
(single and double) and a statistical method (GMMs)
to detect voice activity and evaluate its performance.
2 METHODS
2.1 Data Acquisition Hardware
We developed a data acquisition hardware in order to
reduce costs and size. The requirements for the bio-
signal acquisition system were to be small, battery-
operated and real-time capable. It consists of three
main parts: the sensor straps, the bio-signal shield and
an ARDUINO
c
DUE micro-controller board. The
board serves as a host for the connected strap and the
shield (see Figure 1).
The strap is designed to be worn around the neck
to ensure correct electrode position at the surface of
the sternohyoid muscle. This muscle is a long, thin
muscle which is located along the length of the front
of the human neck. The functions of this muscle in-
clude, depression of the hyoid bone, head and neck
movement, and speech. This position is often used
in Automatic Speech Recognition and the relation be-
tween muscle movement and fundamental frequency
was confirmed (Ooe et al., 2010). The strap holds
three silver/silver-chlorideelectrodes, two of them are
used to detect the EMG signal, the third one serves as
a reference electrode to improve the common-mode
rejection ratio. The strap is connected to the instru-
mentation amplifier which is followed by an opera-
tional amplifier. The gain of this amplifier can be
modified manually. After a low-pass filter where high
frequency noise is suppressed, the positive and neg-
ative half-wave are split and fed to two discrete ana-
log inputs of the micro-controller. Using this method,
a higher bit resolution (i.e. 13 bit) of the digitized
signal amplitude can be achieved. Then the signal
is converted from analog to digital. In the following
experiments the micro-controller board is connected
to the computer via USB which serves to power the
shield via the micro-controller board (5V). The sam-
pling rate f
s
of the ARDUINO
c
DUE ADC is set to 8
kHz. This is enough as most of the frequency content
of EMG signals is between 0 and 500 Hz.
The authors are aware that in a real-world appli-
cation, the algorithms need to be implemented on a
DSP and the power supply and the hardware needs to
be summarized such as it can be worn on the body,
e.g. in a pocket.
2.2 Recorded Database
To evaluate different approaches for SND a database
was recorded and simulations were done off-line us-
ing the recordings.
We used around 100 phonetically balanced speech
utterances of a female and a male speaker. The skin
surface EMG sensor are positioned around the neck
and are attached to our processing hardware. EMG
and speech signals are recorded using both, the bio-
signal shield connected to an audio interface (RME
Fireface 800), and a head-mounted microphone AKG
HC 577L with omni-directional pickup pattern. The
audio interface ensures a high quality digital signal.
The sampling rate of the audio interface was set to
44100 Hz. Compared to the used sound card (24 bit),
the micro-controller system is able to convert the in-
put signal with a resolution of 13 bit. This is enough
to perform all processing steps which are proposed
in this work without drawbacks in respect to signal
detection. We analyzed the recordings manually and
annotated speech and non-speech sections in order to
obtain a ground truth.
All in all we recorded 18min45s of data. The
mean signal-to-noise ratio (SNR) for the male EMG
signals was 16.7 dB and for the female 12.6 dB. For
SNR calculations we used first order IIR smoothing.
This difference in SNR will also influence the thresh-
olds for SND. The main energy of the EMG signal is
between 0 Hz and 500 Hz, in fact, over 90% of the
energy can be found in this range. The ratio of speech
to non-speech in the database was 63% to 37%.
Speech/Non-SpeechDetectionforElectro-LarynxSpeechUsingEMG
139

Electrode Strap
Bio-signal Shield
ADC
Instrumentation
Amplifier Stage:
Gain: 120
Operational
Amplifier Stage:
Gain: 10 – 200
Rectification Stage
f < 1 kHz
U
U
t
t
EMG Electrodes
Input 1
Input 2
Ref.
1
2
abs
Shielded Cables
Driven-Right-Leg:
Feedback of the
Common-Mode
Signal
Adjustable Markup Gain +
Active Low-Pass Filter
Section
Precision Half-wave
(HW) Rectifier for
positive and negative
HW.
Neg. HW is
inverted.
Micro-controller
Analog Inputs
Figure 1: Schematic overview: Block diagram of the developed hardware system consisting of the electrode strap, the bio-
signal shield which is compatible to the ARDUINO
c
DUE micro-controller which serves as a host.
2.3 Pre-processing, Envelope
Calculation, Speech/Non-speech
Detection (SND)
In order to clean and prepare the recordedEMG signal
some pre-processing needed to be applied. We used
adaptive noise cancellation to remove crosstalk of the
EL excitation signal and the EMG signal. Afterward
a notch filter reduces interferences from electric hum
caused by magnetic fields close to the sensors and am-
plification unit. The database was split into three parts
in order to perform 3-fold cross validation. The sen-
tences were chosen randomly for each validation set.
We choose three different envelope calculation
methods: 1) root mean square (RMS) , 2.) Hilbert
transform and 3.) low-pass (LP) filtered signal
which was also suggested by (Goldstein et al., 2004).
1) Root mean square: In EMG analysis, the
RMS of the signal is a common envelope calcula-
tion method to get the power of the signal. The RMS
value for a windowed signal x with window length N
is defined as RMS{x} =
q
1
N
∑
N
n=1
x[n]
2
. 2) Hilbert
transform: Another method to get the power of the
EMG signal is to use the Hilbert transformed signal
and rectify it. If we compare the Hilbert envelope to
a simply rectified EMG signal, it can be seen that this
method works as an amplitude follower and provides,
even un-smoothed, an envelope which is not touching
the zero line on the y-axis. Both, RMS and Hilbert
envelope use a moving average filter for smoothing.
This filter can cause oscillation and leakage into the
smoothed output due to the sharp edges in the rect-
angular weighting function. A latency related to the
length of the window is expected in live applications.
3) Low-pass filter (LP): The signal is rectified and
a low-pass filter with a corner frequency of 5 Hz is ap-
plied. A LP smooths the envelope. Implemented as a
3-pole IIR filter it produces a potential delay of up to
150 ms. If a finite impulse response filter is built the
time domain response must be time truncated, there-
fore it can be replaced by a moving average where the
delay time is specified by the block size.
Using the different envelope calculation meth-
ods, we want to find SND messages using a) sin-
gle threshold (ST), b) double threshold (DT) and
c) classification using Gaussian mixture models
(GMM).
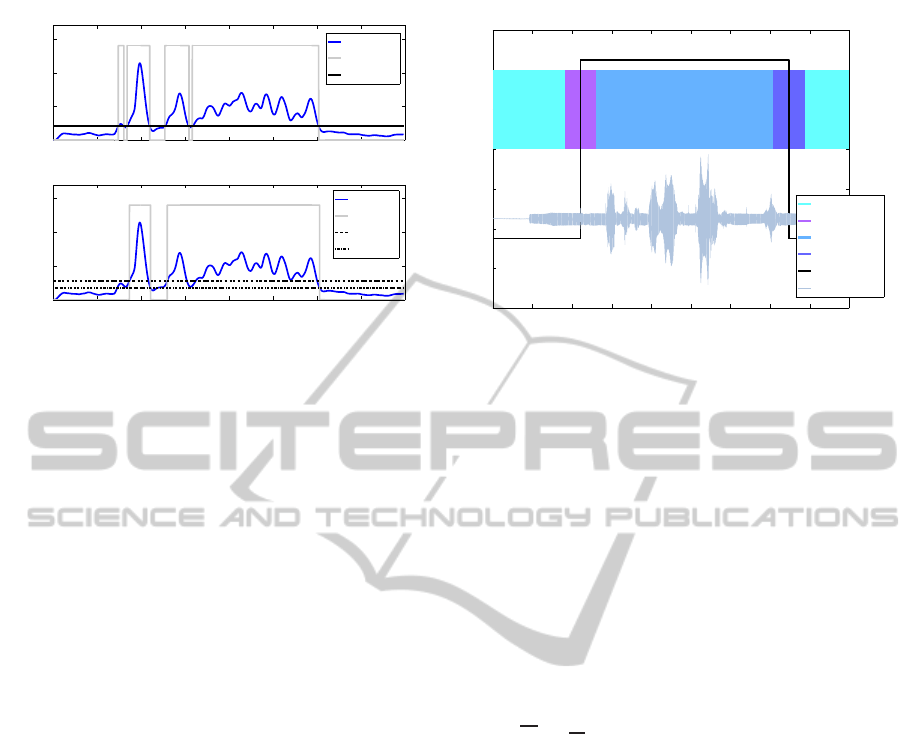
Classification using a) single threshold and b)
double threshold is straight forward. The calculated
envelope is compared with a threshold. As soon as
the envelope exceeds this threshold speech is detected
and vice verse, when the envelope falls below the
threshold we determine the message for non-speech
(see Figure 2 - upper plot). In case of the double
threshold, speech is detected when the envelope sur-
passes the first threshold and non-speech is detected if
the thresholds drops below the second threshold (see
Figure 2 - lower plot).
A GMM is fully described with the parameters
λ = (b
m
, µ
m
, σ
m
);m = 1, 2, ...K. µ is the mean value,
σ the variance and b the weights for each of the
K components m. For the GMM SND two GMMs
are trained, one for speech and one for non-speech.
The number of components was determined using the
Bayes information criterion and lies between 8 and
32. In the test we compute the probability density
function for an unknown input for both GMMs and
the maximum classifies into the SND results. We
trained the parameters (b, µ and σ) on two validation
sets and tested on the third. All combinations assured
that we use all utterances in the test.
BIOSIGNALS2015-InternationalConferenceonBio-inspiredSystemsandSignalProcessing
140
0 0.5 1 1.5 2 2.5 3 3.5 4
0
0.05
0.1
0.15
Amplitude
0 0.5 1 1.5 2 2.5 3 3.5 4
0
0.05
0.1
0.15
Amplitude
Time [ms]
Time [ms]
Envelope
Envelope
AD
AD
thr
s,on−of f
thr
d,on
thr
d,o f f
Figure 2: Activity detection (AD) using single threshold
(upper plot) and double threshold (lower plot); Note that
thr
s,on−of f
is equal to thr
d,on
.
3 EXPERIMENTAL EVALUATION
3.1 Threshold Determination
Single threshold as well as double threshold for SND
were determined using receiver operating character-
istics (ROC). In ROC curves sensitivity (true posi-
tive rate) is plotted against 1-specificity (false pos-
itive rate). The rates are calculated analyzing the
database sentences with thresholds going from 1% to
100% in steps of 1%. For single threshold the activa-
tion threshold thr
s,on−of f
(= termination threshold) is
based on the maximal envelope amplitude, for double
threshold the termination threshold thr
d,o f f
is relative
to the activation threshold thr
d,on
.
Under the assumptions of signal detection theory,
we interpolate the ROC points of the different values
of the threshold. These thresholds for best detection
(highest sensitivity in combination with highest speci-
ficity) are calculated by finding the threshold, where
the sum of the sensitivity and the absolute value of
the specificity minus 1 has a maximum. The thresh-
olds were chosen gender dependent.
3.2 Error Calculation
The SND results are compared to the speech ground
truth. Errors are calculated regarding the correctly
detected activation time and taking into account the
interruptions of the detection. The absolute error
is classified in the following parameters (Freeman
et al., 1989): front end error (FEE), back end error
(BEE), middle speech error (MSE) and noise detected
as speech (NDS) (see Figure 3). In order to get error
0.5 1 1.5 2 2.5 3 3.5 4 4.5
Time in [s]
Speech
Ground Truth
FEE Area
NDS Area
MSE Area
BEE Area
Figure 3: Error regions for noise detected as speech (NDS),
front end error (FEE), mid speech error (MSE) and back
end error (BEE) of an EL sentence.
values which are comparable the 4 error types are nor-
malized to the total length of the analyzed sentence.
We assume that MSE and FEE are the most impor-
tant errors. If there is no triggering when the person
wants to say something, information is lost. This er-
ror influences the speech quality much more than un-
wanted triggering when the person does not want to
say anything, which, of course, is annoying and must
also be avoided. The averaged absolute error for one
method was calculated as the averaged sum of each
separate error for a number of N sentences i:
|
er| =
1
N
N
∑
i=1
FEE
i
+ BEE
i
+ MSE
i
+ NDS
i
.
Moreover, the relation between the correct num-
ber of interruptions inside a sentence and the un-
wanted interruptions due to a wrong behavior of the
detection process is presented as an indicator for jit-
ter of the SND. The block detection ratio (BDR) is
defined as the ratio between the number of active
blocks in the detection vector and the desired num-
ber of blocks in the ground truth vector. A perfect
detection in terms of this interruption indicator would
result in a block detection ratio of 1.
3.3 Time Constant Detection Smoothing
For post-processing of short-time SND, it is com-
mon to apply detection smoothing or long time de-
tection algorithms to the detection output. This is
done to avoid short interruptions of the detection.
In live scenarios this is problematic as for offset
events the length of the following interruption can-
not be predicted. The proposed time constant detec-
tion smoothing algorithm treats two problems: 1. de-
tection results might suffer from short interruptions
Speech/Non-SpeechDetectionforElectro-LarynxSpeechUsingEMG
141

and 2. EMG during speech shows a pre-activation of
about 40 ms compared to the speech signal (Atkin-
son, 1978). The algorithm is using a time constant
to smooth the detection output in a real-time applica-
tion and therefore avoids small interruptions of detec-
tion and, at the same step, the algorithm is compensat-
ing EMG pre-activation. The time constant detection
smoothing is delaying everyon- and offset by the time
constant 40 ms.
3.4 Experimental Results
3.4.1 Threshold Determination
Single thresholds thr
s,on−of f
for the female are lower
than for the male speaker. The thresholds for LP and
Hilbert envelope are similar, but for RMS it is lower:
F: LP - 25%, HIL - 24%, RMS - 20%; M: LP - 18%,
HIL - 17%, RMS - 12%. For double threshold the
activation threshold thr
d,on
is higher than thr
s,on−of f
,
the termination threshold thr
d,o f f
is approximately
the same for all envelope calculation strategies and
both genders (see Table 1).
Table 1: Speech/Non-Speech thresholds for female (F) and
male (M) and for different envelope calculation methods:
root mean square (RMS), Hilbert transform (HIL) and low-
pass filtered (LP); thr
d,on
in % based on maximal envelope,
thr
d,o f f
in % based on the activation threshold thr
d,on
(see
subsection 3.1).
F M
thr
d,on
thr
d,o f f
thr
d,on
thr
d,o f f
RMS 26% 66% 18% 53%
HIL 32% 67% 21% 60%
LP 33% 63% 25% 60%
Sensitivity was between 88% and 96% and the
specificity between 77% and 89%. This means that in
each method around 90% was detected correctly and
the false positive rate (1-specificity: speech detected,
no speech in ground truth) was up to 20% which leads
to algorithms with very good performance.
3.4.2 Error Analysis
The individualerror results and the block detection ra-
tio valuesare shownin Figure 4 for the female speaker
and in Figure 5 for the male speaker. The averaged
absolute error |
er| together with the standard devia-
tion (s) and the 95% confidence interval (CI
95%
) for
the mean are presented in Table 2. The presented re-
sults are processed with the proposed time constant
detection smoothing (see subsection 3.3). It was pos-
sible to improve |
er| around 3% where especially FEE
and MSE was reduced. The time constant detection
smoothing also improved the block detection ratio.
• |
er| for the male speaker (6.4% –12.0%) are better
than for the female speaker (9.5% –12.2%).
• Double threshold outperformssingle threshold for
male and female speaker.
• LP envelopeoutperformsthe RMS and Hilbert en-
velope in all tested scenarios (Single threshold,
double threshold and GMM based approach) ex-
cept for female HIL-GMM which slightly outper-
forms (0.1%) LP-GMM.
• In GMM classification the MSE and NDS reaches
low values but the FEE errors are increased.
• GMM is comparable with LP-DT for female
speaker. For male speaker LP-GMM is the best
method but there are huge differences between the
GMM methods.
• Block detection ratio BDR, a measure for inter-
ruptions, results are improved with the time con-
stant detection smoothing and present good re-
sults for both speaker (ca. 3 for female; ca. 2
for male).
With our tuned parameters, LP envelopes with dou-
ble threshold perform best for female (second: HIL-
GMM) and LP envelopeswith GMM for male speaker
(second: LP-DT).
0
1
2
3
4
5
6
7
8
9
10
11
12
NDS
MSE
BEE
FEE
0
2
4
|er| [%]
BDR
RMS-ST
RMS-DT
HIL-ST
HIL-DT
LP-ST
LP-DT
RMS-GMM
HIL-GMM
LP-GMM
Figure 4: FEMALE: Averaged absolute error |er| for all
envelope calculation strategies: (root mean square (RMS),
Hilbert envelope (HIL) and low-pass filter (LP) together
with classification methods: single threshold (ST), double
threshold (DT) and GMM (upper plot); block detection ra-
tio (BDR) (lower plot).
4 DISCUSSION AND
CONCLUSIONS
This works investigates a preliminary strategy in or-
der to perform SND based on EMG signals which are
insensitive to background noise. We compared dif-
ferent envelope calculation methods (RMS, HIL, LP)
BIOSIGNALS2015-InternationalConferenceonBio-inspiredSystemsandSignalProcessing
142

Table 2: Averaged absolute error |er| for female (F) and male (M); Best and second best methods in light Grey (female) and
dark Grey (male); * indicates significant difference to the best method (F: LP-DT; M: LP-GMM).
Method
|er| (s) [%] CI
95
[%]
F M F M
RMS-ST 12.2 (6.7) 12.0 (6.3) 10.9 – 13.5 * 10.8 – 13.2 *
RMS-DT 11.0 (6.8) 11.5 (6.8) 9.7 – 12.3 9.7 – 12.3 *
HIL-ST 11.9 (6.8) 9.9 (5.7) 10.6 – 13.1 * 8.8 – 10.9 *
HIL-DT 10.7 (6.6) 8.7 (6.7) 9.5 – 12.0 7.5 – 10.0 *
LP-ST 10.6 (5.3) 7.8 (4.9) 9.6 – 11.6 6.9 – 8.7 *
LP-DT 9.5 (5.6) 6.6 (4.7) 8.5 – 10.6 5.7 – 7.4
RMS-GMM 9.9 (5.7) 9.1 (5.3) 8.9 – 11.0 8.1 – 10.1 *
HIL-GMM 9.6 (5.5) 8.0 (5.0) 8.6 – 10.6 7.1 – 8.9 *
LP-GMM 9.7 (5.6) 6.4 (5.8) 8.6 – 10.7 5.3 – 7.5
and classification strategies (ST, DT, GMM) to con-
trol the SND. In future the best approach should be
implemented in a real-time system to control an EL
device. In such a system the methods have to be op-
timized concerning the middle speech error and noise
detected as speech error.
The thresholds were chosen gender dependent, be-
cause they change with the SNR. The SNR was lower
for the female speaker than for the male speaker. This
corresponds to the findings in (Goldstein et al., 2004)
which say, that the amplitude of the EMG signal de-
pends on the pitch; the lower the pitch, the larger the
EMG amplitudes.
The different envelope calculation methods differ
in how smooth they become. The smoothing time is
one of the limiting factors in real-time because we can
only look a certain time into the future. The proposed
Hilbert envelope method (HIL) has the advantage that
it incorporates an amplitude follower and therefore in-
cludes a smoothing. In our experiments Hilbert en-
0
1
2
3
4
5
6
7
8
9
10
11
12
NDS
MSE
BEE
FEE
0
2
4
|er| [%]
BDR
RMS-ST
RMS-DT
HIL-ST
HIL-DT
LP-ST
LP-DT
RMS-GMM
HIL-GMM
LP-GMM
Figure 5: MALE: Averaged absolute error |er| for all en-
velope calculation strategies: (root mean square (RMS),
Hilbert envelope (HIL) and low-pass filter (LP) together
with classification methods: single threshold (ST), double
threshold (DT) and GMM (upper plot); block detection ra-
tio (BDR) (lower plot).
velope performs better than RMS and about the same
than LP for low SNRs. For high SNRs LP clearly out-
performs RMS and Hilbert envelope. Furthermore,
Hilbert envelope incorporates a moving average filter
which might be an advantage over the low-pass filter
(LP) because of the attack time of the 3-pole IIR filter.
GMMs suffer from the fact that their might be dif-
ferences in the conditions for the training utterances
and for the test. We can avoid this problem when we
apply an adaptation strategy in the real-time scenario
(Reynolds et al., 2000).
In our experiments a low-pass filtered version of
the EMG signals together with a double threshold de-
tection or a GMM classifier outperform other meth-
ods.
In order to do real-time smoothing, a time constant
detection smoothing was implemented. It takes ad-
vantage of the preceding effect and smooths fast vari-
ations in the detected signal. This especially improves
FEE errors, because the activation is shifted in time.
For future work we have to consider several
things: 1. Using EMG signals, non-speech related
muscle movements like gulping will trigger the EL
device. We assume that within a learning phase such
unwanted events can be avoided. 2. We must keep
in mind that the feedback during real-world test could
(and will) influence the neck muscle activity and the
resulting EMG behavior. In future work we will in-
vestigate the learning effect. 3. We did not investigate
the difference of EMG signals for healthy subjects
and larygectomees. 4. The analysis was performed
subject dependent. We can not talk about gender de-
pendent differences because we only evaluated sig-
nals for 2 subjects, i.e. both gender.
We developed a data acquisition hardware for
EMG signals which can serve as a prototype in a
future real-time implementation. We found out that
Hilbert envelope and LP envelope together with dou-
ble threshold and GMM yield the best results in terms
of error calculation. Due to the strong dependency
Speech/Non-SpeechDetectionforElectro-LarynxSpeechUsingEMG
143

on the SNR the thresholds need to be adjustable dur-
ing speaking. The time constant detection smoothing
turned out to be a good method for smoothing SND
results and can also be implemented in real-time.
ACKNOWLEDGEMENTS
The authors would like to thank HEIMOMED Heinze
GmbH & Co.KG for their support.
REFERENCES
Atkinson, J. E. (1978). Correlation analysis of the phys-
iological factors controlling fundamental voice fre-
quency. The journal of the Acoustical Society of Amer-
ica, 63(1):211–222.
Freeman, D., Cosier, G., Southcott, C., and Boyd, I. (1989).
The voice activity detector for the pan-european digi-
tal cellular mobile telephone service. In International
Conference on Acoustics, Speech, and Signal Process-
ing, pages 369–372.
Goldstein, E. A., Heaton, J. T., Kobler, J. B., Stanley,
G. B., and Hillman, R. E. (2004). Design and imple-
mentation of a hands-free electrolarynx device con-
trolled by neck strap muscle electromyographic activ-
ity. Biomedical Engineering, IEEE Transactions on,
51(2):325–332.
Heaton, J., Robertson, M., and Griffin, C. (2011). De-
velopment of a wireless electromyographically con-
trolled electrolarynx voice prosthesis. In Annual In-
ternational Conference of the IEEE Engineering in
Medicine and Biology Society, EMBC, pages 5352–
5355.
Kubert, H., Stepp, C., Zeitels, S.M. anad Gooey, J., Walsh,
M., Prakash, S., Hillman, R., and Heaton, J. (2009).
Electromyographic control of a hands-free electrolar-
ynx using neck strap muscles. Journal of communica-
tion disorders, 42(3):211–225.
Ooe, K. (2012). Development of controllable artificial lar-
ynx by neck myoelectric signal. Procedia Engineer-
ing, 47(0):869 – 872. 26th European Conference on
Solid-State Transducers.
Ooe, K., Villagran, C., and Fukuda, T. (2010). Develop-
ment of the compact control system using of neck emg
signal for welfare applications. In International Sym-
posium on Micro-NanoMechatronics and Human Sci-
ence (MHS), pages 127–132.
Pineda-Rico, Z., Dieck-Assad, G., Martinez-Chapa, S.,
and Avila-Ortega, A. (2008). A switching capacitor
cmos based device for hands-free electrolarynx acti-
vation using electromyographic signals. In Electron-
ics, Robotics and Automotive Mechanics Conference,
pages 8–13.
Reynolds, D. A., Quatieri, T. F., and Dunn, R. B. (2000).
Speaker verification using adapted gaussian mixture
models. Digital signal processing, 10(1):19–41.
Schiefer, J. and Hagen, R. (2000). Rehabilitation la-
ryngektomierter Karzinompatienten. Der Onkologe,
6(1):36–43.
Shute, B. (2003). Perceptions of Artificial Larynx Re-
liability According to Laryngectomees and Speech-
language Pathologists. Gonzaga University, Spokane,
Washington.
ACRONYMS
BDR Block Detection Ratio
BEE Back End Error
DT Double Threshold
EL Electro-Larynx
EMG Electromyography
FEE Front End Error
GMM Gaussian Mixture Model
HIL Hilbert Transform
IIR Infinite Impulse Response
LP Low-Pass
MSE Mid Speech Error
NDS Noise Detected as Speech
RMS Root Mean Square
ROC Receiver Operating Characteristics
SND Speech/Non-Speech Detection
SNR Signal-to-Noise Ratio
ST Single Threshold
BIOSIGNALS2015-InternationalConferenceonBio-inspiredSystemsandSignalProcessing
144
