
Content Based Retrieval of MRI Based on Brain Structure Changes
in Alzheimer’s Disease
Katarina Trojacanec, Ivan Kitanovski, Ivica Dimitrovski and Suzana Loshkovska
Department of Software Engineering, Faculty of Computer Science and Engineering, “Ss. Cyril and Methodius”
University, “Rugjer Boshkovikj” 16, PO Box 393, 1000 Skopje, Macedonia
Keywords: CBIR, Alzheimer’s Disease, VOI, Segmentation, Feature Extraction, Feature Selection, MRI, ADNI.
Abstract: The aim of the paper is to present Content Based Retrieval of MRI based on the brain structure changes
characteristic for Alzheimer’s Disease (AD). The approach used in this paper aims to improve the retrieval
performance while using smaller number of features in comparison to the descriptor dimensionality
generated by the traditional feature extraction techniques. The feature vector consists of the measurements
of cortical and subcortical brain structures, including volumes of the brain structures and cortical thickness.
Two main stages are required to obtain these features: segmentation and calculation of the quantitative
measurements. The feature subset selection is additionally applied using Correlation-based Feature
Selection (CFS) method. Euclidean distance is used as a similarity measurement. The retrieval performance
is evaluated using MRIs provided by the Alzheimer’s Disease Neuroimaging Initiative (ADNI).
Experimental results show that the strategy used in this research outperforms the traditional one despite its
simplicity and small number of features used for representation.
1 INTRODUCTION
Alzheimer’s Disease (AD) is a progressive
neurodegenerative disorder and the most common
form of dementia for older adults. Its early
diagnoses, monitoring the change in patient’s
condition or the progression of the disease, and
identifying the patients who are most probable to
ultimately develop AD are considered as very
important challenges for physicians and researchers
in this domain (Nho, 2012).
Magnetic Resonance Imaging (MRI) is found to
be a powerful technique preferred to diagnosis of
AD and its prodromal stage, Mild Cognitive
*
Data used in preparation of this article were obtained
from the Alzheimer’s Disease Neuroimaging Initiative
(ADNI) database (adni.loni.usc.edu). As such, the
investigators within the ADNI contributed to the
design and implementation of ADNI and/or provided
data but did not participate in analysis or writing of this
report. A complete listing of ADNI investigators can
be found at:
http://adni.loni.usc.edu/wp-ontent/uploads/how_to_apply/
ADNI_Acknowledgement_List.pdf
Impairment (MCI). It provides rich information
needed for understanding and detecting disease
pathology. This leads to enormously increased
number of images stored in the medical databases
that need to be efficiently organized, searched and
analysed.
The systems that enable efficient retrieval on the
basis of the image content are referred to as Content
Based Image Retrieval (CBIR) systems. Being able
to retrieve images from the database with similar
Volume of Interest (VOI)/pathology/disease might
be very useful in the clinical and research centres in
two directions: (1) providing clinically relevant
information to the physicians at right moment, thus
supporting the diagnosis process and improving its
quality and efficiency (Oliveira, 2007), and (2) for
educational purposes (Rosset, 2004).
The searching capabilities of the CBIR systems
in medical domain are still questionable and a big
research challenge (Akgül, 2011). The reason is
basically related to the specific nature of the medical
images and subtle changes that need to be detected
and taken into consideration. For example, limited
resolution, intensity inhomogeneity, noise, and
partial volume effects are characteristic for MRI and
very often lead to geometrical inaccuracies
13
Trojacanec K., Kitanovski I., Dimitrovski I. and Loshkovska S..
Content Based Retrieval of MRI Based on Brain Structure Changes in Alzheimer’s Disease.
DOI: 10.5220/0005182200130022
In Proceedings of the International Conference on Bioimaging (BIOIMAGING-2015), pages 13-22
ISBN: 978-989-758-072-7
Copyright
c
2015 SCITEPRESS (Science and Technology Publications, Lda.)

(Gerardin, 2009) that can directly affect the CBIR
performance.
The main concern is to find a good
representation of the image content by using
techniques for feature extraction that will properly
represent clinically relevant information and
subsequently make the usage of medical CBIR
systems more suitable, precise and clinically
meaningful. To achieve this, the research is going
towards its specialization in direction of (1)
particular diseases, such as interstitial lung diseases
(Depeursinge, 2011), AD (Akgül, 2009; Agarwal,
2010; Agarwal, 2011; Mizotin, 2012) etc., (2) body
part such as brain (Akgül, 2009; Agarwal, 2010;
Agarwal, 2011; Mizotin, 2012; Simonyan, 2013),
lung (Depeursinge, 2011), or (3) the medical
imaging techniques used for acquisition (e.g.
Magnetic Resonance Imaging (MRI) (Simonyan,
2013), Computed Tomography (CT) (Moore, 2011),
High-Resolution Computed Tomography (HRCT)
(Depeursinge, 2011).
The focus of the paper is on CBIR of MRI
applied to AD. Most of the current techniques in this
domain focus on visual information extraction
following the standard procedures of the traditional
CBIR (Akgül, 2009; Agarwal, 2010; Agarwal, 2011;
Mizotin, 2012). However, considering this approach
in medical volumetric data context, the
dimensionality and complexity become crucial
problems.
To overcome this, we base the retrieval process
on the structural changes in the human brain closely
related to AD (Agarwal, 2011). Wide range of
research has been performed to analyse their
statistical dependence with respect to the disease
(Gerardin, 2009; Lötjönen, 2011; Sabuncu, 2011;
Nho, 2012). Some of them, including volume of the
ventricular structures, hippocampus volume,
amygdala volume or cortical thickness are used by
the researchers for distinguishing or automatically
labelling/classifying patients as AD, MCI, or healthy
controls (Cuingnet, 2011; Gray, 2013), or to
generate high-level semantic words used
subsequently for the purpose of content based
retrieval (Liu, 2013).
In this paper, the MRIs are represented by the
measurements of brain structures, such as volumes
of the separate structures and cortical thickness of
the separate parts of the brain cortex. Two main
stages are required: segmentation and calculation of
quantitative measurements of the selected structures.
The feature selection is additionally applied to
select the best discriminating feature subset.
Experimental results show that this approach
outperforms the traditional one despite its simplicity
and small number of features needed for
representation.
The paper is organized as follows. Section 2
provides the state of the art. The experimental setup
is explained in Section 3, while the experimental
results obtained from the retrieval of MRIs applied
to Alzheimer’s Disease are given in Section 4.
Section 5 provides concluding remarks and future
directions.
2 STATE OF THE ART AND
RELATED WORK
Several studies address CBIR in the context of AD
(Akgül, 2009; Agarwal, 2010; Agarwal, 2011;
Mizotin, 2012). Regarding the feature extraction
used for CBIR in AD context, one usual direction is
following the standard procedure used in the
traditional CBIR through which image features are
derived from the visual cues contained in the image.
For instance, intensity histograms, local binary
pattern and gradient magnitude histograms are used
to generate feature vector for the middle slice for
subsequent usage in automated diagnosis of AD
(Akgül, 2009). Discrete Cosine Transform (DCT),
Daubechie’s Wavelet Transform (DWT) and Local
Binary Patterns (LBP) are used as descriptors
(Agarwal, 2011). Again in this case, the descriptors
are applied on 2D bases on a selected by radiologists
subset of slices. Laguerre Circular Harmonic
Functions expansions enabling capturing the local
image patch structure directly are also used for
feature extraction (Mizotin, 2012). The Bag-of-
Visual-Words approach is then applied on a specific
region (hippocampus). Slice by slice analysis is
performed in this research.
The main disadvantage in the performed research
in this area is that the feature extraction is performed
only on one/several slice/s or slice by slice manner.
This means excluding possibly significant
information that might be extracted from the
volumetric data. Another critical aspect is the
dimensionality of the feature vector which can lead
to a high computational complexity. For example,
the size of each descriptor in (Akgül, 2009) is 256.
Another example of the dimensionality of the
traditional descriptors applied to volumes in the case
of brain MRI includes: 13312 features for 3D Grey
Level Co-occurrence Matrices, 1920 for 3D Wavelet
Transforms, 9216 for Gabor Transforms and 11328
for 3D LBP per volume (Qian, 2011).
BIOIMAGING2015-InternationalConferenceonBioimaging
14

To overcome these disadvantages, the focus of this
paper is to provide content based retrieval by using
an alternative method for feature extraction. It is
based on the structural changes considered as
indicators for AD, including cortical thickness and
volumes of the separate brain structures. While the
traditional direction basically means extraction of
the visual information itself, the alternative one
utilizes the visual information to delineate the
relevant brain structures (regarding AD in this case)
on the bases of which the quantitative measurements
are subsequently obtained. In the context of image
retrieval, the first direction enables retrieval of
images/Volumes of Interest (VOIs) with similar
visual characteristics, while the second provides
retrieval of images/VOIs with similar structural
appearance with the query which in the context of
AD is expected to lead to more relevant results.
To enable this, the pipeline that we propose to
construct the feature vector includes these steps:
Segmentation of the relevant brain
structures/(VOIs)
Calculating the measurements such as volume
of the selected structures and cortical
thickness
Constructing the feature vector from the
measurements obtained in the previous step
There is plenty of research based on making
analysis of VOIs, relevant for detecting anatomical
changes related to or imposed by AD. They usually
include hippocampus, amygdala, ventricular
structures, and brain cortex. For instance, multi-atlas
segmentation framework used for segmentation of
thalamus, caudate, putamen, pallidum, hippocampus
and amygdala is proposed in (Lötjönen, 2010), and
its improved version used for hippocampus
segmentation described in (Lötjönen, 2011). Other
methods for hippocampus extraction are proposed in
(Chupin, 2009a; Chupin, 2009b). A method for
cortical segmentation and parcellation is described
in (Velayudhan, 2013). The anatomical
segmentation of structural images of the human
brain (83 regions) is depicted in (Heckemann, 2011).
Several software tools are also widely used by
researchers in this domain for segmentation of
different structures in the human brain, such as:
FreeSurfer software package (FreeSurfer, 2013)
used for cortical and subcortical segmentation
(Moore, 2011), (Yuan, 2011), Brain Ventricular
Quantification (BVQ) software (Accomazzi, 2009)
for ventricular segmentation (Nestor, 2008),
Statistical Parametric Mapping (SPM) software
package for White Matter (WM), Grey Matter (GM),
and Cerebrospinal Fluid (CSF) segmentation
(Nestor, 2008; Cataldo, 2013), Automatic Lateral
Ventricle delIneatioN (ALVIN) for lateral ventricle
segmentation (Leonardo, 2011), as well as the
FIRST tool as a part of FMRIB Software Library
(FSL) (Leonardo, 2011). In this paper, the
FreeSurfer software package is used, due to its
powerful capabilities for segmentation and
subsequent calculation of the measurements.
Additionally, with the aim to improve the
retrieval results and increase the efficiency, we
apply the feature selection step. As a result, we
obtain better results in comparison to the reported
results by the other authors while using very small
number of features as a representation of the images.
The contributions of our research using this
approach are: (1) key information extracted from the
medical volume itself, (2) possibility to be adapted
to reflect the change of the patient condition/disease
progress (for future use), and (3) efficiency.
3 EXPERIMENTAL SETUP
3.1 Dataset
The images used for preparation of this research
were obtained from the Alzheimer’s Disease
Neuroimaging Initiative (ADNI) database
(adni.loni.usc.edu). The ADNI was launched in 2003
by the National Institute on Aging (NIA), the
National Institute of Biomedical Imaging and
Bioengineering (NIBIB), the Food and Drug
Administration (FDA), private pharmaceutical
companies, and non-profit organizations as a $60
million, 5-year public–private partnership. The main
goal of ADNI is to enable research on whether serial
magnetic resonance imaging (MRI), positron
emission tomography (PET), other biological
markers, such as cerebrospinal fluid (CSF) markers,
APOE status and full-genome genotyping via blood
sample, as well as clinical and neuropsychological
assessments can be combined to measure the
progression of mild cognitive impairment (MCI) and
Alzheimer’s Disease (AD). Determination of
sensitive and specific markers of very early AD
progression is aimed to support the development of
new treatments, to improve the process of
monitoring treatments effectiveness, and to reduce
the time and cost of clinical trials.
The Principal Investigator of this initiative is
Michael W. Weiner, MD, VA Medical Center and
University of California – San Francisco. ADNI is a
valuable product resulting from the efforts of many
ContentBasedRetrievalofMRIBasedonBrainStructureChangesinAlzheimer'sDisease
15
coinvestigators from a broad range of academic
institutions and private corporations, and subjects
have been recruited from over 50 sites across the
U.S. and Canada. Initially, the goal of ADNI was to
recruit 800 subjects. However, ADNI has been
followed by ADNI-GO and ADNI-2, having
recruited over 1500 adults, ages 55 to 90, to
participate in the research. Cognitively normal
individuals, adults with early or late MCI, and
people with early AD can be distinguished in the
dataset with different follow up duration of each
group, specified in the protocols for ADNI-1, ADNI-
2, and ADNI-GO. For up-to-date information, see
http://www.adni-info.org.
3.2 Segmentation and Quantitative
Measurements
The FreeSurfer software package pipeline version
5.1.0 was used to obtain the required measurements:
volume of the brain structures and cortical thickness.
The main methods from the FreeSurfer pipeline are
summarized in Table 1 (Freesurfer Methods, 2014).
Due to the lack of neuroradiology expert, the
quality control on the FreeSurfer output is not
addressed in this research.
Table 1: Methods of the FreeSurfer pipeline.
Methods
Motion correction and averaging
Removal of non-brain tissue using a hybrid
watershed/surface deformation procedure
Automated Talairach transformation
Segmentation of the subcortical white matter and
deep grey matter volumetric structures
Intensity normalization
Tessellation of the grey matter white matter boundary
Automated topology correction
Surface deformation following intensity gradients
Registration to a spherical atlas
Parcellation of the cerebral cortex into units based on
gyral and sulcal structure
3.3 Feature Representation
In this paper, the information extracted from the
MRI volumetric data is represented on the basis of
the quantitative measurements. After the
segmentation has been conducted and the
measurements have been obtained, the feature vector
is constructed. In this context, volume of the
separate brain structures and cortical thickness of the
separate cortical structures from the left and right
hemisphere are used to compose the feature vector.
It consists of 127 features.
Additionally, the feature subset selection method
was applied with the aim to improve the retrieval
performance and further reduce the feature vector
dimensionality. For that purpose, Correlation-based
Feature Selection (CFS) method was used. It
evaluates subset of attributes taking into account the
usefulness of individual features for predicting the
class along the degree of intercorrelation among
them (Hall, 2003).
4 EXPERIMENTAL RESULTS
The strategy used for this research was applied on
two subsets of ADNI database: baseline images
obtained using 3T scanners, and screening images
obtained using 1.5T scanners. Both datasets have
three classes of subjects: subjects with diagnosed
AD, MCI, of normal controls (NL). The number of
subjects in the dataset is given in Table 2.
Demographic information about the subjects
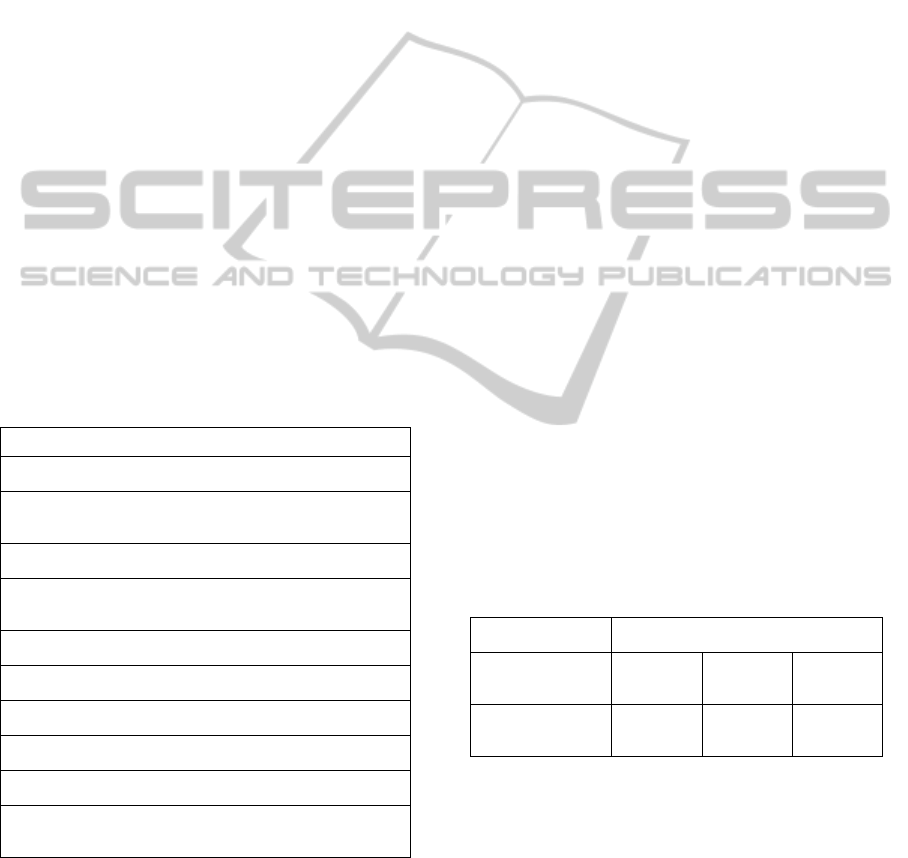
such as gender and age is represented on fig. 1 (for
the Baseline 3T subset) and fig. 2 (for the Screening
1.5T subset). However, this information does not
have direct influence on the retrieval performance in
the performed research, because it is based on the
visual information only and subsequently obtained
measurements.
Table 2: Subjects available for data sets.
Subset Subjects available
Baseline visits
at 3T
Normal n
= 47
MCI
n = 71
AD
n = 33
Screening visits
at 1.5T
Normal n
= 228
MCI
n = 401
AD
n = 188
In the case of MRIs of MCI subjects obtained by
1.5T scanners, five cases did not achieve successful
FreeSurfer segmentation. These subjects were
excluded from the retrieval process. All other
subjects from the Baseline 3T MRI and Screening
1.5T MRI subset are considered.
Because the number of images in the subsets is not
very large, leave-one-out strategy was performed.
This means that each image was used as a query
against all other images in the database. Euclidean
distance was used as a similarity measurement.
BIOIMAGING2015-InternationalConferenceonBioimaging
16
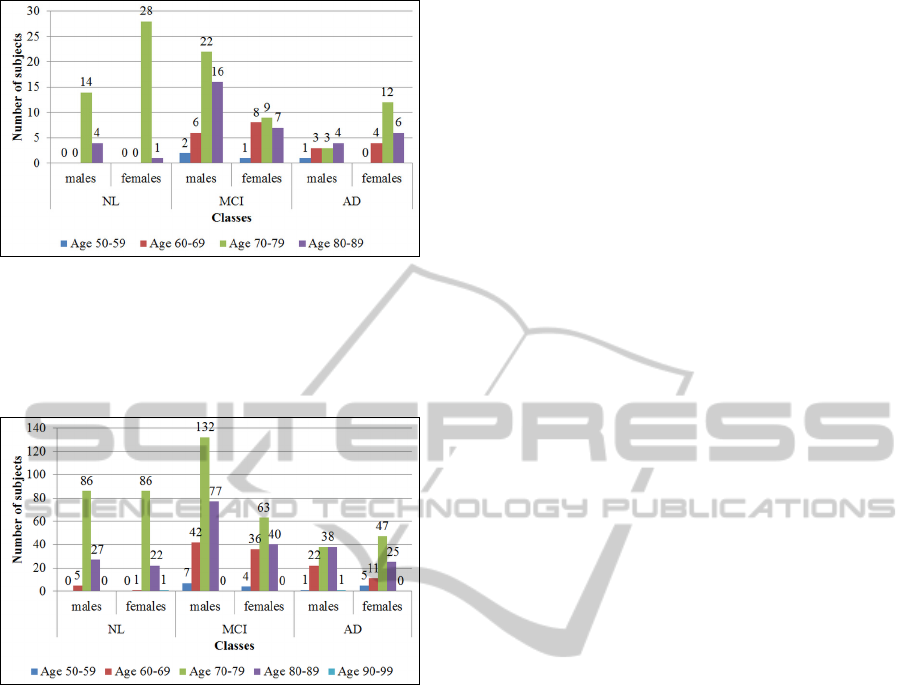
Figure 1: Demographic information such as gender and
age per class (one of NL, MCI, AD) for the Baseline 3T
subset. The horizontal axis denotes gender per each class,
while the vertical one – the number of subjects. In each
class, the number of subjects grouped by age range and
gender is represented.
Figure 2: Demographic information such as gender and
age per class (one of NL, MCI, AD) for the Screening
1.5T subset. The horizontal axis denotes gender per each
class, while the vertical one – the number of subjects. In
each class, the number of subjects grouped by age range
and gender is represented.
To evaluate the retrieval performance, mean
average precision (MAP) was used. The retrieved
image is considered as relevant if it belongs to the
same class as the query (AD, NL, MCI).
The retrieval performance is evaluated for both
data sets in two cases:
Considering only AD and NL subjects
Considering all subjects (AD, NL, MCI)
The influence on the retrieval performance was
also evaluated in the case when the whole feature
vector (127 features) was used or the selected
feature subset using CFS was applied.
4.1 Evaluation Performed on the 3T
MRI Baseline Dataset
In this subsection, the results of the retrieval perfor-
mance evaluation conducted on the 3T MRI baseline
dataset are given. Using the CFS method, the feature
subset is selected. Table 3 summarizes the selected
features in the case of two and three classes
separately. Considering the selected feature subsets,
it should be noted that most of these features are
found to be valuable indicators for AD by the
researchers including volume of the hippocampus,
amygdala, lateral ventricles, entorhinal thickness etc.
Thus, using these feature subsets in the subsequent
retrieval process is very reasonable.
Table 4 and Table 5 summarize the results (on
the bases of MAP) for each form of the feature
vector (the whole, and the selected feature subset)
considering the case with two and three classes for
the Baseline 3T MRI dataset. When two classes are
considered (AD and NL) the value of MAP is 0.53 if
the images are represented with the whole feature
vector. If the feature selection algorithm is applied,
the MAP significantly increases to the value of 0.73.
In this case, only 10 features are used. The case
when all three classes are considered, the results are
worse. Namely, the value of MAP without feature
selection is 0.38. Applying the feature selection
algorithm (leading to 13 features selected by the
algorithm) improves the results to 0.47.
From the presented results it can be concluded
that the feature subset selection significantly
improves the results. From the other hand, the
research conducted on the datasets in the case when
MCI class is included, leads to decreased MAP. This
can be explained by the nature of the MCI condition.
Namely, it is usually transitional condition that very
often develops to AD. Thus, it is very difficult to
automatically make a distinction between this
condition and AD or NL, and a big challenge in this
domain. For example, it is recorded that the volume
of hippocampus does not have as big discriminative
power in distinguishing MCI and AD, as it has in
distinguishing AD and NL (Gerardin, 2009). As a
result, additional research is needed in this case, and
is part of our future work.
To be able to compare the results to the results of
the research performed on the same subset of ADNI
dataset in (Mizotin, 2012) (Baseline 3T dataset with
AD and NL classes), we also provide the curves of
average precision at the first N (up to N=20)
retrieved scans (fig. 3). According to the results
reported in (Mizotin, 2012) for this subset, the best
average precision reaches 0.74 (at N=1). In our case,
we obtain better average precision of 0.78, at the
same level. This means that the method for using
measures of the brain structures used in this paper
reaches even higher average precision at N=1 than
ContentBasedRetrievalofMRIBasedonBrainStructureChangesinAlzheimer'sDisease
17
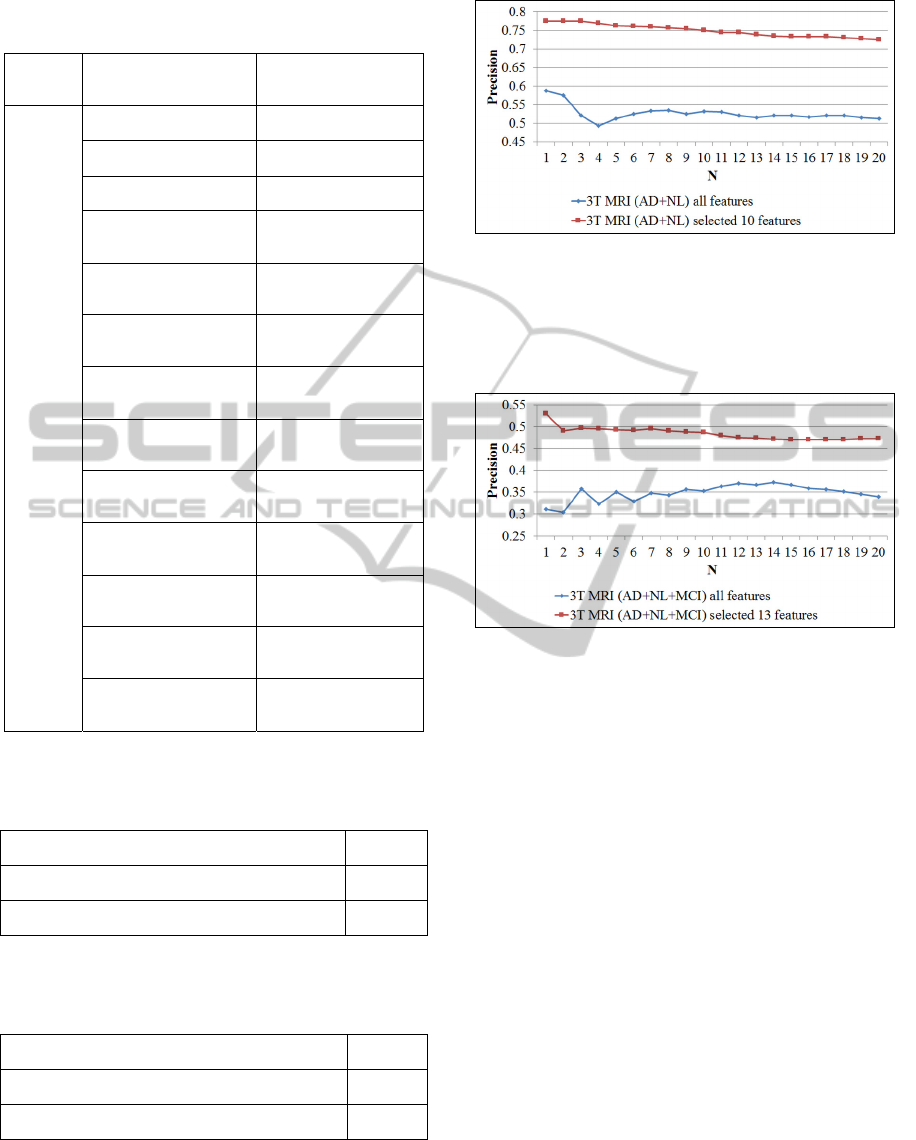
Table 3: Selected feature subsets for 3T MRI Baseline
Dataset.
Classes
included
NL, AD
(10 features)
NL, AD, MCI
(13 features)
Features
Left-Hippocampus Left-Inf-Lat-Vent
Right-Thalamus-Proper Left-Hippocampus
Right-Hippocampus Left-Amygdala
Right-Amygdala
Right-Lateral-
Ventricle
lh_entorhinal_
thickness
Right-Inf-Lat-Vent
lh_inferiortemporal_
thickness
Right-Thalamus-
Proper
lh_parsorbitalis_
thickness
Right-Hippocampus
rh_entorhinal_
thickness
Right-
Amygdala
rh_inferiorparietal_
thickness
rh_entorhinal_
thickness
rh_parahippocampal_
thickness
rh_parahippocampal_
thickness
lh_entorhinal_
thickness
lh_inferiortemporal_
thickness
lh_temporalpole_
thickness
Table 4: Evaluation of the retrieval performance on the
bases of MAP for 3T MRI Baseline Dataset (Classes: NL,
AD).
Feature vector MAP
All features (127 features) 0.53
After feature subset selection (10 features) 0.73
Table 5: Evaluation of the retrieval performance on the
bases of MAP for 3T MRI Baseline Dataset (Classes: NL,
AD, MCI).
Feature vector MAP
All features (127 features) 0.38
After feature subset selection (13 features) 0.47
additionally provide curves of average precision at
the first N (up to N=20) retrieved scans in the case
when all three classes are considered (fig. 4).
Figure 3: Precision at N (up to N=20) for the Baseline 3T
subset of ADNI dataset (considered classes: AD and NL).
N denotes the number of retrieved scans. The lower curve
refers to the case when the all features are used. The upper
curve applies to the case when only 10 features (obtained
after the feature selection process) are used.
Figure 4: Precision at N (up to N=20) for the Baseline 3T
subset of ADNI dataset (considered classes: AD, NL and
MCI). N denotes the number of retrieved scans. The lower
curve refers to the case when the all features are used. The
upper curve applies to the case when only 13 features
(selected by the feature selection algorithm) are used.
The results obtained from this research cannot be
directly compared to the results obtained by the
research about CBIR applied to Alzheimer’s Disease
conducted by the other authors, because of the
differences in the subsets used for evaluation.
4.2 Evaluation Performed on the 1.5T
Screening MRI Dataset
The experimental results of the application of the
proposed strategy to the dataset containing the
screening visits at 1.5T are presented in this
subsection. Table 6 contains the selected feature
subset for the data set of 1.5T Screening MRIs in the
case of two (NL and AD) and three classes (NL, AD
and MCI). Similarly as in the case of 3T Baseline
dataset, the most of the selected features are reported
by the researchers as significant AD indicators.
BIOIMAGING2015-InternationalConferenceonBioimaging
18
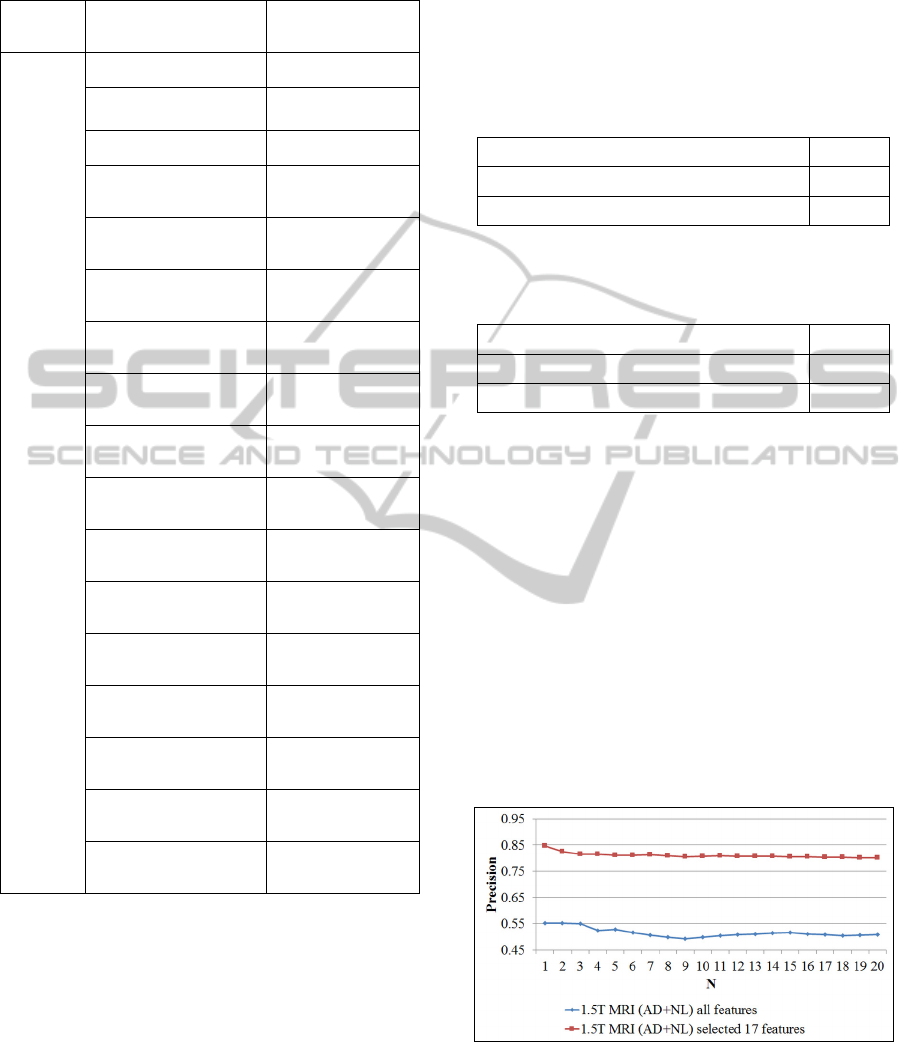
Table 6: Selected feature subsets for 1.5T MRI Screening
Dataset.
Classes
included
NL, AD
(17 features)
NL, AD, MCI
(15 features)
Features
Left-Inf-Lat-Vent Left-Inf-Lat-Vent
Left-Hippocampus
Left-
Hippocampus
Left-Amygdala Left-Amygdala
Right-Putamen
Right-
Hippocampus
Right-Hippocampus
lh_bankssts_
thickness
Right-Amygdala
lh_entorhinal_
thickness
lh_bankssts_
thickness
lh_fusiform_
thickness
lh_entorhinal_
thickness
lh_inferiorparietal
_thickness
lh_inferiorparietal_
thickness
lh_inferiortempor
al_thickness
lh_inferiortemporal_
thickness
lh_middletempor
al_thickness
lh_middletemporal_
thickness
lh_parahippocam
pal_thickness
lh_parahippocampal_
thickness
rh_entorhinal_
thickness
lh_rostralanteriorcing
ulate_thickness
rh_inferiortempor
al_thickness
rh_entorhinal_
thickness
rh_middletempor
al_thickness
rh_inferiortemporal_
thickness
rh_parahippocam
pal_thickness
rh_middletemporal_
thickness
rh_parahippocampal_
thickness
The results (based on MAP) for the Screening
1.5T MRI dataset are given in Table 7 and Table 8
for both cases: the whole feature vector and the
selected feature subset.
Table 7 summarizes the results when only two
classes are considered, while the results in the case
of three classes are depicted in Table 8. According
to the obtained results, it should be noted that in the
case when two classes are considered, the value of
MAP is 0.51. By applying the feature selection
algorithm, significantly increased value of MAP =
0.75 is obtained. In this case, a feature subset of 17
features was used to represent the images. In the
case when three classes are considered, the value of
MAP is 0.37 if the whole feature vector is used.
Applying the feature selection increases MAP to the
value of 0.46.
Table 7: Evaluation of the retrieval performance on the
bases of MAP for 1.5T MRI Screening Dataset (Classes:
NL, AD).
Feature vector MAP
All features (127 features) 0.51
After feature subset selection (17 features) 0.75
Table 8: Evaluation of the retrieval performance on the
bases of MAP for 1.5T MRI Screening Dataset (Classes:
NL, AD, MCI).
Feature vector MAP
All features (127 features) 0.37
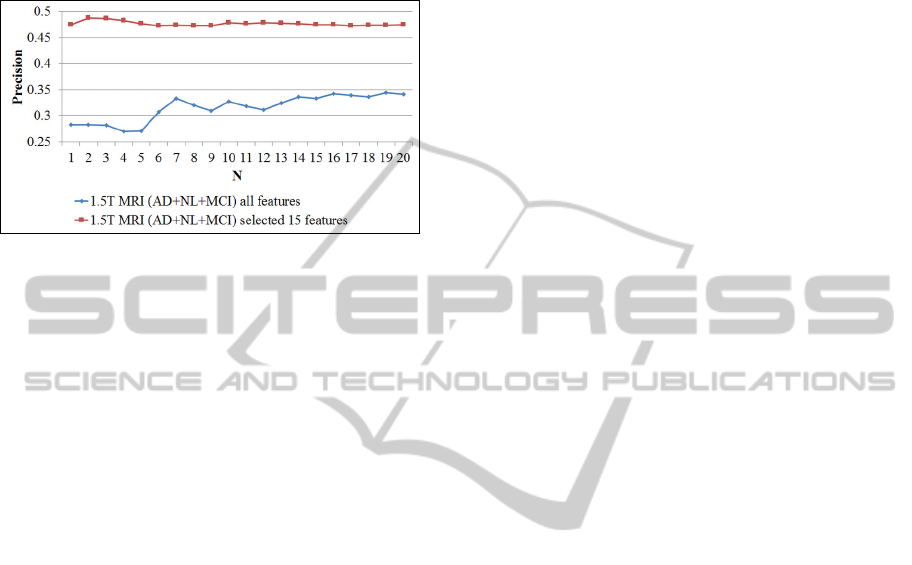
After feature subset selection (15 features) 0.46
We additionally provide curves of average
precision at the first N (up to N=20) retrieved scans
for the 1.5T Screening MRI dataset in the case when
only NL and AD classes are considered (fig. 5) and
in the case where all three classes are considered
(fig. 6).
It should be emphasized that in all cases, the
feature selection leads to significantly improved
retrieval performance, while decreasing the retrieval
process complexity. The reason is that including this
step leads to reduction of irrelevant, redundant or
possibly noisy data. In fact, only the most relevant
and discriminative features are considered. From the
perspective of the application domain of this
research, it should be noticed that the selected
features by the algorithm comply with the most
Figure 5: Precision at N (up to N=20) for the 1.5T
Screening MRI subset of ADNI dataset (considering
subjects with AD and NL). N denotes the number of
retrieved scans. The lower curve refers to the case when
all features are used. The upper curve applies to the case
when the retrieval is based on 17 features only (obtained
by using the feature selection algorithm).
ContentBasedRetrievalofMRIBasedonBrainStructureChangesinAlzheimer'sDisease
19
significant AD markers listed in the literature (for
example: hippocampus, amygdala, left and right
lateral ventricles, entorhinal thickness etc.). This
gives additional impact and makes this step even
more meaningful.
Figure 6: Precision at N (up to N=20) for the 1.5T
Screening MRI subset of ADNI dataset (considering all
three classes AD, NL and MCI). N denotes the number of
retrieved scans. The lower curve refers to the case when
all features are used. The upper curve applies to the case
when the retrieval is based on 15 features only (obtained
by using the feature selection algorithm).
In general, it can be concluded that the method
used in this paper provides very promising results. It
gives better retrieval results (on the bases of MAP)
than the research conducted on the same dataset (3T
Baseline MRI dataset) with very small number of
features. This is very important result for the
practical medical CBIR system. However, further
investigation is needed in the case of inclusion of the
MCI group, which is planned for our future work.
5 CONCLUSIONS
Content based retrieval strategy of MRI on the bases
of the structural changes characteristic for
Alzheimer’s Disease was researched in the paper.
The feature extraction was performed to reflect the
brain structural changes. The feature vector consists
of the volume of the brain structures, as well as the
cortical thickness of the cortical regions. The feature
subset selection using CFS method was also applied.
The retrieval performance was evaluated on the
Baseline 3T MRIs and Screening 1.5T MRIs from
the ADNI database. The experiments were
conducted in the case where only AD and NL
subjects were taken into consideration, and in the
case of all three categories, including MCI.
In this research, the results were significantly
improved by involving feature selection procedure.
Moreover, it should be emphasized that most of the
features selected by the feature evaluator are stressed
in the literature as valuable indicators of AD.
Comparing to the results obtained on the same
subset (Baseline 3T MRI), the strategy used in this
paper leads to better results with only 10 features.
This dimensionality is quite smaller than the
traditional feature vector length.
Considering the categories of subjects included
in the research, the results of the retrieval process
when the MCI group is excluded are significantly
better. This is because of the nature of this condition
and needs further research which is a part of our
future work.
The approach used in this research is very
beneficial. It provides information extraction using
the required volumetric data and efficient
information representation. The usage of the
measurements such as volumes and thickness of the
brain structures as a medical volume representation
in the CBIR system, enables answering the questions
of type “find all subjects that have similar
anatomical structure to the query one” utilizing the
visual information rather than “find all subjects that
have similar visual properties to the query
image/VOI” (which is characteristic for the
traditional approach). This is very important
regarding the application domain. Moreover, the
approach used in this research gives a good
opportunity to extend this work with the aim to
address the progression of the disease.
ACKNOWLEDGEMENTS
Data collection and sharing for this project was
funded by the Alzheimer's Disease Neuroimaging
Initiative (ADNI) (National Institutes of Health
Grant U01 AG024904) and DOD ADNI
(Department of Defense award number W81XWH-
12-2-0012). The National Institute on Aging, the
National Institute of Biomedical Imaging and
Bioengineering, and through generous contributions
from the following: Alzheimer’s Association;
Alzheimer’s Drug Discovery Foundation; Araclon
Biotech; BioClinica, Inc.; Biogen Idec Inc.; Bristol-
Myers Squibb Company; Eisai Inc.; Elan
Pharmaceuticals, Inc.; Eli Lilly and Company;
EuroImmun; F. Hoffmann-La Roche Ltd and its
affiliated company Genentech, Inc.; Fujirebio; GE
Healthcare; IXICO Ltd.; Janssen Alzheimer
Immunotherapy Research & Development, LLC.;
Johnson & Johnson Pharmaceutical Research &
Development LLC.; Medpace, Inc.; Merck & Co.,
Inc.; Meso Scale Diagnostics, LLC.; NeuroRx
BIOIMAGING2015-InternationalConferenceonBioimaging
20

Research; Neurotrack Technologies; Novartis
Pharmaceuticals Corporation; Pfizer Inc.; Piramal
Imaging; Servier; Synarc Inc.; and Takeda
Pharmaceutical Company are all funders of ADNI.
ADNI clinical sites in Canada are supported and
funded by the Canadian Institutes of Health
Research. Private sector contributions are facilitated
by the Foundation for the National Institutes of
Health (www.fnih.org). The grantee organization is
the Northern California Institute for Research and
Education, and the study is coordinated by the
Alzheimer's Disease Cooperative Study at the
University of California, San Diego. ADNI data are
disseminated by the Laboratory for Neuro Imaging
at the University of Southern California.
Authors also acknowledge the support of the
European Commission through the project
MAESTRA - Learning from Massive, Incompletely
annotated, and Structured Data (Grant number ICT-
2013-612944).
REFERENCES
Accomazzi V., Lazarowich R., Barlow, C. J., and Davey,
B., 2009. U.S. Patent No. 7,596,267. Washington, DC:
U.S. Patent and Trademark Office.
Agarwal M., and Mostafa J., 2010 Image Retrieval for
Alzheimer’s Disease Detection. Medical Content-
Based Retrieval for Clinical Decision Support.
Springer Berlin Heidelberg. pp. 49-60.
Agarwal, M., and Mostafa, J., 2011 Content-based image
retrieval for Alzheimer's disease detection. In Content-
Based Multimedia Indexing (CBMI), 2011 9th
International Workshop on pp: 13-18.
Akgül, C. B., Ünay, D., and Ekin, A., 2009. Automated
diagnosis of Alzheimer's disease using image
similarity and user feedback. In Proceedings of the
ACM International Conference on Image and Video
Retrieval, pp. 34.
Akgül C. B., Rubin, D. L., Napel, S., Beaulieu, C. F.,
Greenspan, H., Acar, B., 2011. Content-based image
retrieval in radiology: current status and future
directions. Journal of Digital Imaging, vol. 24 no. 2,
pp. 208-222.
Cataldo R, Agrusti A, De Nunzio G, Carlà A, De Mitri I,
Favetta M, Quarta M, Monno L, Rei L, Fiorina E;
Alzheimer’s Disease Neuroimaging Initiative, 2013.
Generating a minimal set of templates for the
hippocampal region in MR neuroimages. Journal of
Neuroimaging 23, no. 3 pp. 473-483.
Chupin M., Gérardin E., Cuingnet R., Boutet C, Lemieux
L., Lehéricy S., Benali H., Garnero L., and Colliot O.,
2009a. Fully automatic hippocampus segmentation
and classification in Alzheimer's disease and mild
cognitive impairment applied on data from ADNI.
Hippo-campus 19, no. 6 pp: 579-587.
Chupin A., Hammer A., Liu R.S., Colliot O., Burdett J.,
Bardinet E., Duncan J.S., Garnero L., Lemieux L.,
2009b. Automatic segmentation of the hippocampus
and the amygdala driven by hybrid constraints:
method and validation. Neuroimage. vol. 46, no.
3:749–761.
Cuingnet R., Gerardin E., Tessieras J., Auzias G.,
Lehéricy S., Habert M. O., Chupin M., Benali H., and
Colliot O., 2011. Automatic classification of patients
with Alzheimer's disease from structural MRI: a
comparison of ten methods using the ADNI database.
Neuroimage 56, no. 2 pp. 766-781.
Depeursinge, A., Zrimec, T., Busayarat, S., Müller, H.,
2011. 3D lung image retrieval using localized features.
In SPIE Medical Imaging, International Society for
Optics and Photonics, pp. 79632E-79632E.
FreeSurfer, 2013. Available from: <https://surfer.nmr.
mgh.harvard.edu/>. [25.08.2014]
FreeSurfer methods, 2014. Available from: <http://surfer.
nmr.mgh.harvard.edu/fswiki/FreeSurferMethodsCitati
on>. [25.08.2014].
Gerardin E, Gaël C., Marie C., Rémi C., Béatrice D., Ho-
Sung K., Marc N. et al., 2009. Multidimensional
classification of hippocampal shape features
discriminates Alzheimer's disease and mild cognitive
impairment from normal aging. Neuroimage 47, no. 4,
pp. 1476-1486.
Gray, K. R., Aljabar, P., Heckemann, R. A., Hammers, A.,
and Rueckert, D., 2013. Random forest-based
similarity measures for multi-modal classification of
Alzheimer's disease. NeuroImage, 65, pp: 167-175.
Hall, M. A., & Holmes, G., 2003. Benchmarking attribute
selection techniques for discrete class data mining.
Knowledge and Data Engineering, IEEE Transactions
on, 15(6), 1437-1447.
Heckemann R. A., Keihaninejad S, Aljabar P., Gray K. R.,
Nielsen C, Rueckert D., Hajnal J. V., and Hammers A,
2011. Automatic morphometry in Alzheimer's disease
and mild cognitive impairment." Neuroimage 56, no. 4
p.: 024-2037.
Leonardo I., 2011. Atrophy Measurement Biomarkers
using Structural MRI for Alzheimer’s Disease. The
15th Int. Conference on Medical Image Computing
and Computer Assisted Intervention (MICCAI).
Liu, S., Cai, W., Song, Y., Pujol, S., Kikinis, R., & Feng,
D., 2013. A Bag of Semantic Words Model for
Medical Content-based Retrieval. In MICCAI
Workshop on Medical Content-Based Retrieval for
Clinical Decision Support.
Lötjönen, J. M., Wolz, R., Koikkalainen, J. R., Thurfjell,
L., Waldemar, G., Soininen, H., and Rueckert, D.,
2010. Fast and robust multi-atlas segmentation of
brain magnetic resonance images. Neuroimage, vol.
49, no. 3, 2352-2365.
Lötjönen J., Robin W., Juha K., Valtteri J., Lennart T.,
Roger L., Gunhild W., Hilkka S., and Daniel R., 2011
Fast and robust extraction of hippocampus from MR
images for diagnostics of Alzheimer's disease.
Neuroimage 56, no. 1, pp. 185-196.
Mizotin, M., Benois-Pineau, J., Allard, M., and Catheline,
ContentBasedRetrievalofMRIBasedonBrainStructureChangesinAlzheimer'sDisease
21

G., 2012. Feature-based brain MRI retrieval for
Alzheimer disease diagnosis. In Image Processing
(ICIP), 19th IEEE International Conference on pp.
1241-1244.
Moore D. W., Kovanlikaya I., Heier L. A., Raj A., Huang
C., Chu K. W., and Relkin N. R., 2011 A pilot study
of quantitative MRI measurements of ventricular
volume and cortical atrophy for the differential
diagnosis of normal pressure hydrocephalus.
Neurology research international 2012.
Nestor S. M., Raul R., Michael B., Matthew S., Vittorio
A., Jennie L. W., Jennifer F., and Robert B., 2008.
Ventricular enlargement as a possible measure of
Alzheimer's disease progression validated using the
Alzheimer's disease neuroimaging initiative database.
Brain 131, no. 9 pp: 2443-2454.
Nho, K., Risacher, L. S., Crane, P. K., DeCarli, C.,
Glymour, M.M., Habeck, C., Kim, S. et al., 2012.
Voxel and surface-based topography of memory and
executive deficits in mild cognitive impairment and
Alzheimer’s disease. Brain imaging and behavior vol.
6, no. 4 pp. 551-567.
Oliveira, M. C., Cirne, W., and de Azevedo Marques, P.
M., 2007. Towards applying content-based image
retrieval in the clinical routine. Future Generation
Computer Systems, vol. 23, no. 3, pp. 466-474.
Qian, Y., Gao, X., Loomes, M., Comley, R., Barn, B., Hui,
R., Tian, Z., 2011. Content-based re-trieval of 3D
medical images. In eTELEMED 2011, The Third
International Conference on eHealth, Telemedicine,
and Social Medicine, pp. 7-12.
Rosset A., Muller H., Martins M., Dfouni N., Vallée J.-P.,
Ratib O., 2004. Casimage project - a digital teaching
files authoring environment, Journal of Thoracic
Imaging vol. 19 no. 2, 1-6.
Sabuncu, M. R., Desikan R. S., Sepulcre J., Yeo B. T. T,
Liu H., Schmansky N. J., Reuter M. et al., 2011. The
dynamics of cortical and hippocampal atrophy in
Alzheimer disease. Archives of neurology 68, no. 8 pp:
1040-1048.
Simonyan, K., Modat, M., Ourselin, S., Cash, D.,
Criminisi, A., Zisserman, 2013. A. Immediate ROI
search for 3-d medical images. In: Medical Content-
Based Retrieval for Clinical Decision Support, pp. 56-
67, Springer Berlin Heidelberg.
Velayudhan, L., Proitsi, P., Westman, E., Muehlboeck, J.
S., Mecocci, P., Vellas, B.,et al., 2013. Entorhinal
cortex thickness predicts cognitive decline in
Alzheimer's disease. Journal of Alzheimer's Disease,
vol. 33, no. 3, pp. 755-766.
Yuan, L., Wang, Y., Thompson, P. M., Narayan, V. A.,
and Ye, J., 2011. Multi-source feature learning for
joint analysis of incomplete multiple heterogeneous
neuroimaging data. Neu-roImage, 61(3), pp: 622-632.
BIOIMAGING2015-InternationalConferenceonBioimaging
22
